Intrinsic limits to gene regulation by global crosstalk
Abstract
Gene regulation relies on the specificity of transcription factor (TF)-DNA interactions. Limited specificity may lead to crosstalk: a regulatory state in which a gene is either incorrectly activated due to noncognate TF-DNA interactions or remains erroneously inactive. Since each TF can have numerous interactions with noncognate cis-regulatory elements, crosstalk is inherently a global problem, yet has previously not been studied as such. We construct a theoretical framework to analyze the effects of global crosstalk on gene regulation. We find that crosstalk presents a significant challenge for organisms with low-specificity TFs, such as metazoans. Crosstalk is not easily mitigated by known regulatory schemes acting at equilibrium, including variants of cooperativity and combinatorial regulation. Our results suggest that crosstalk imposes a previously unexplored global constraint on the functioning and evolution of regulatory networks, which is qualitatively distinct from the known constraints that act at the level of individual gene regulatory elements.
Introduction
Life depends on the specificity of molecular recognition to ensure that essential reactions only occur between cognate substrates even when similar noncognate substrates are present, sometimes in large excess. A paradigmatic example is that of the aminoacyl tRNA synthetase [1], which uses kinetic proofreading [2] to load appropriate amino acids onto matching tRNAs. This and other examples—including DNA replication, ligand sensing [3], protein-protein interactions [4, 5, 6, 7, 8, 9], recognition events in the immune system [10, 11] and molecular self-assembly [12]—indicate that biology places a large premium on the reduction of unintended “crosstalk”, a generic term that encompasses all potentially disruptive processes due to reactions between noncognate substrates.
Molecular recognition is fundamental also to transcriptional regulation, the primary mechanism by which cells control gene expression. The specificity of this regulation ultimately originates in the binding interactions between special regulatory proteins, called transcription factors (TFs), and short regulatory sequences on the DNA, called binding sites. Although each type of TF preferentially binds certain regulatory DNA sequences, a large body of evidence shows that this binding specificity is limited, and that TFs bind other noncognate targets as well [13, 14, 15, 16, 17]. These additional binding targets were previously discussed in the context of their effect on the TF concentration [18, 19]. However, if these sites happen to also be regulatory elements of other genes, non-cognate binding not only depletes TF molecules, but could also actively interfere with gene regulation. This suggests that the crosstalk problem is global: in a pool of TF molecules of different chemical species co-expressed at any one time, each molecule has a small probability of erroneously regulating some subset of all genes. As the regulatory system grows in complexity, the number of potential noncognate interactions will grow faster than the number of cognate interactions. While this makes the problem biologically relevant and theoretically interesting, existing work has mostly considered a reduced setting, by computing binding probabilities for a single TF to cognate vs noncognate sites [20, 21, 22, 23]. Such a reduced description thus overlooked the effect of this TF on the (mis)regulation of genes that were not its cognate regulatory targets. Motivated by this observation, our primary goal here is to develop a new framework for crosstalk that captures its global nature, by simultaneously treating multiple TFs and multiple regulatory binding sites. Moreover, the focus of prior work has been on how to achieve reliable gene regulation by cognate TFs [24], while the complementary question of how to prevent erroneous regulation by noncognate TFs has remained largely unexplored (but see [25]). As a result, it remains unclear whether crosstalk places strong constraints on the ability of cells to orchestrate their gene expression programs, and to what extent different molecular mechanisms could relax any such constraints.
To address these questions quantitatively, we construct a model of crosstalk in transcriptional regulation that satisfies three key requirements for biophysical plausibility. First, the model should be global. Global models, where many targets are simultaneously regulated by different TFs, will properly capture the faster-than-linear growth in the number of possible noncognate interactions as the number of TFs increases, and the difficulty in ensuring that recognition sequences for all TFs remain sufficiently distinct. Second, the model should explicitly account for differential activation of genes depending on regulatory conditions. Consequently—and in contrast to previously studied cases of molecular recognition [2]—the distinction between “erroneous” and “correct” outcomes of regulation will depend on the presence / absence of the regulatory signals. In particular, the ability of the regulatory system to keep genes reliably inactive when appropriate, despite crosstalk interference, will emerge as an important consideration. Third, textbook models of transcriptional regulation assume that TF-DNA interactions happen in equilibrium [22, 26]. This assumption, which is supported experimentally for prokaryotic regulation [27, 28] and which underlies the majority of modeling and bioinformatic applications, puts strong constraints on models of crosstalk. In this work, we explore its consequences in depth; we report on out-of-equilibrium schemes elsewhere [29].
Using our biophysical model we identify the parameters that have a major influence on crosstalk severity. While some of these parameters, such as the free concentration of TFs, are difficult to estimate, we show that there exists a lower bound to crosstalk with respect to these parameters. This implies the existence of a “crosstalk floor,” which cannot be overcome even if TF concentrations were optimally adjusted by the cell, by various feedback mechanisms or otherwise, and compensated for sequestration at noncognate sites.
Our model allows us to ask a number of fundamental questions: How does the severity of crosstalk depend on the number of (co-expressed) genes or the biophysical properties of TF-DNA interactions, such as binding site length and binding energy, for which we have reliable estimates? How do the regulatory strategies of prokaryotes compare to those of eukaryotes? Do complex regulatory schemes, such as combinatorial regulation by activators and repressors, or cooperative activation, lower crosstalk, as is often implied [24]?
Many biophysical constraints have been shown to shape the properties of genetic regulatory networks, e.g., programmability [20], response speed [30], noise in gene expression and dynamic range of regulation [31, 32, 33, 34], robustness [35] and evolvability of the regulatory sequences [36, 37]. Most of these constraints, however, could be understood at the level of individual genetic regulatory elements. Crosstalk, as analyzed here, is special: while it originates locally due to biophysical limits to molecular recognition, its cumulative effect only emerges globally. At the level of a single genetic regulatory element, crosstalk can always be avoided by increasing the concentration of cognate TFs or introducing multiple binding sites in the promoter. It is only when we self-consistently consider that these same cognate TFs act as noncognate TFs for other genes, or that new binding sites in the promoter drastically increase the number of noncognate binding configurations, that crosstalk constraints become clear.
Results
A thermodynamic model of global crosstalk
We start by introducing a basic model of regulation, in which each gene will be regulated in the simplest possible manner by a dedicated TF type, and the mechanism of regulation will be identical for every gene. For this basic model, where the limits to crosstalk are analytically computable, we will outline the reasoning, sketch the derivation, and interpret the results in the main text. We will then relax our simplifying assumptions in a variety of ways, and extend the analysis to more elaborate regulatory schemes, such as different flavors of cooperative or combinatorial regulation. We will summarize the corresponding results later in this section and present detailed computations in the Supplementary Information.
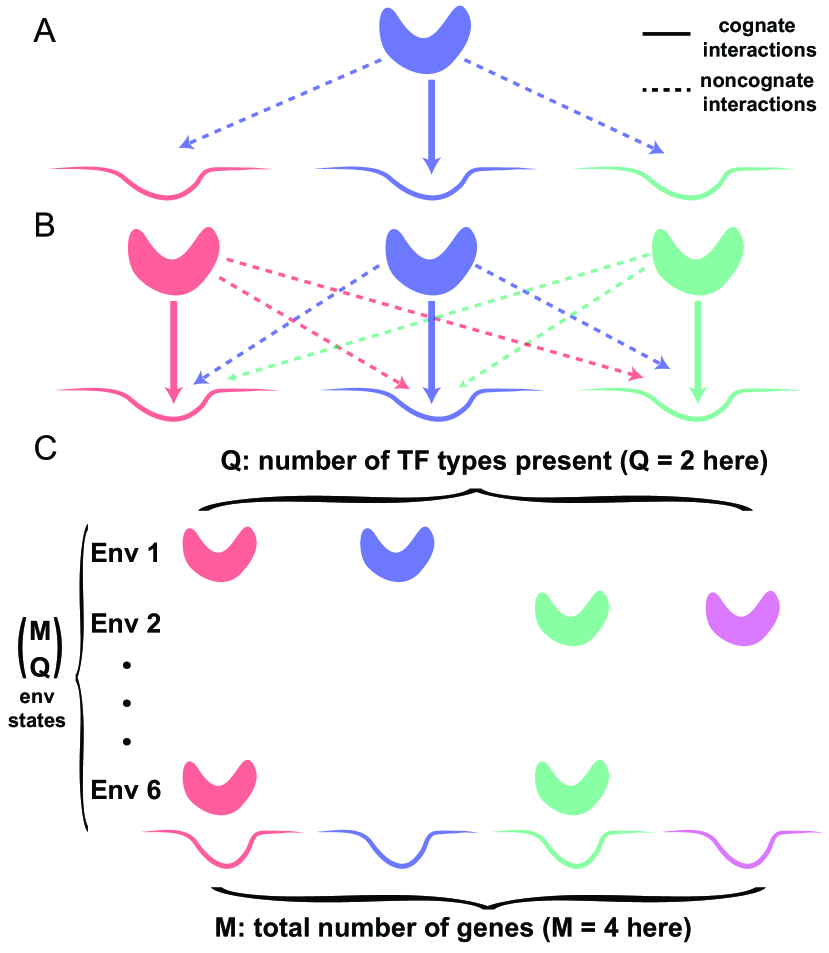
We consider a cell that contains genes, which need to be transcriptionally regulated. In the basic model, each gene is associated with a single binding site of length basepairs, and a unique kind of TF, which—in environments where the TF is expressed—preferably binds to that binding site to activate transcription. We assume that the genes are inactive, unless a TF binds to their binding site. We later relax this simplification to cases where each TF regulates several genes. Every TF can also bind other (noncognate) binding sites, albeit with lower probability, as schematized in Figs 1A, B. These noncognate interactions will contribute to crosstalk in our model.
We employ a thermodynamic model of regulation [27, 38, 23], which postulates that the gene expression level depends on the equilibrium occupancy of TFs at the regulatory sites on the DNA. This model has been widely used to predict gene expression and has been experimentally validated in various systems [39, 40, 41]. In this framework, the binding probability of a TF to any binding site, cognate or noncognate, is determined by two factors: the effective concentration of TFs, and the binding energy.
We assume that the binding energy only depends on the number of mismatches between a particular binding site and the consensus sequence unique to the given TF. Each binding site can thus exist in either of the three possible states [38]: (i) bound by a cognate TF; (ii) bound by a noncognate TF; or (iii) unbound. Binding of the cognate factor (i) is energetically the most favorable state and is assigned the energy . The unbound state (iii) is usually energetically least favorable with energy . Between these two extremes there exist noncognate-bound configurations (ii) with intermediate energies that depend only on the number of nucleotide mismatches between the consensus sequence of the TF and the sequence of a given binding site, i.e., , where is the energy per mismatch. This mismatch energy model provides a tractable approximation to more detailed models [28], and has been extensively used in the literature [42, 20].
Gene regulation gives cells the ability to differentially activate subsets of their genes in a manner appropriate to the environmental conditions, signals, cell type, or time. In our basic model, we imagine a cell that responds to different environments by activating different subsets of genes (out of a total of genes), while keeping the remaining genes inactive (see Fig 1C). As regulation unfolds, the regulatory network thus switches between equilibrium states where any choice of out of genes could be activated; to make the problem tractable, we assume that all these choices are equally probable. In a given environment, activating a particular subset of out of genes is achieved by expressing the corresponding TF types. The remaining TF types, corresponding to the genes that should remain inactive, are absent in the cell.
How does the cell express the correct set of TFs for any particular environment, and at what concentrations are these TFs expressed? The issue is made seemingly even more complicated by the fact that the TF concentration reflects the total number of TF molecules in the cell, as well as any possible effects due to nonspecific TF localization or sequestration on the DNA and elsewhere [18, 19, 43]. What we will show below is that even if the TF presence and concentrations were perfectly adjusted to the environment, a residual level of crosstalk—representing a lower bound or intrinsic limit—is inevitable. Since we are interested precisely in this limit, we will not need to specify the mechanisms by which cells control their TF concentrations, which likely involve complex regulatory network dynamics with feedback loops; instead, we will mathematically look for the lowest achievable crosstalk and show that even in an optimal scenario crosstalk can present a serious regulatory problem.
In our model, the crosstalk error can be separated into two contributions that can be computed using basic statistical mechanics:
-
1.
For a gene that should be active and whose cognate TF is therefore present, error occurs if its binding site is bound by a noncognate regulator (activation out of context due to crosstalk), or if the binding site is mistakenly unbound (gene is inactive). This happens with probability
(1) where is the concentration of the th TF, is the number of mismatches between the th TF consensus sequence and the binding site of gene , and the energy per mismatch; all energies are measured in units of . Here we consider activation by a non-cognate TF as crosstalk; reasons for this choice, as well as an alternative model where such cross-activation is not considered an error state, are presented in SI Section 4.
-
2.
For a gene that should be inactive and whose cognate TF is therefore absent, crosstalk error only happens if its binding site is bound by a noncognate regulator (erroneous activation) rather than remaining unbound. This happens with probability
(2)
We define the global crosstalk as the expected fraction of erroneously regulated genes. In our basic model where all genes are identically regulated and TFs for genes that need to be activated are present at equal concentrations (i.e., , where is the total concentration of all TFs and is the number of distinct TF species present simultaneously), we show in the SI that the crosstalk is
| (3) |
Global crosstalk ranges between zero (no erroneous regulation) and one (every gene is mis-regulated).
The major determinant of crosstalk is the likelihood of TFs to bind noncognate sites, which is determined by the similarity between cognate and noncognate sites. In the global setting, making a particular site less similar to all the remaining sites can only happen at the cost of making the remaining sites more similar amongst themselves. For a large number of sites we describe this effect by introducing an average binding site similarity measure between the binding site of gene and all others, defined as:
| (4) |
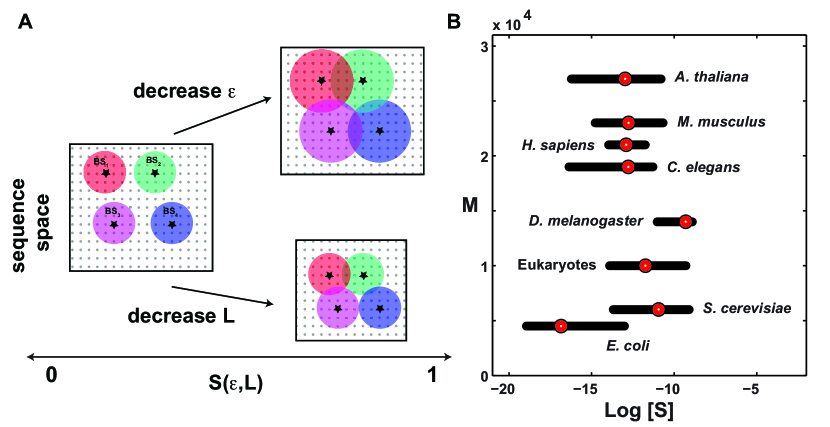
where is the distribution of mismatches between all pairs of binding sites in our model and is the total concentration of all TFs. In the following we assume full symmetry between the genes, so that for every , . depends solely on the binding sites, but it carries no functional meaning in the absence of any TF, namely when . We emphasize that this quantity, , is not arbitrary, but rather emerges from our calculations in Eqs (1,2); a related measure of the likelihood of olfactory or immune receptors to bind an arbitrary ligand from a large repertoire has been previously introduced and measured [44]. is proportional to the probability of the -th TF to bind any noncognate binding site. The highest level of similarity, , occurs if all sites are identical (). Similarity is very low, , if the sites are all significantly different from each other. The shorter the binding site length is and the weaker the binding energy , the larger gets and the less distinguishable the sites are (Fig. 2A); simultaneously, we expect the crosstalk to increase, an intuition we will make precise in the following section.
Binding site similarity of Eq (S9) could be directly measured, by experimentally probing the average TF binding affinity to a large repertoire of known binding sites. Alternatively, can be estimated from bioinformatic data. In Fig 2B we used databases of known TF binding sites to extract organism-specific estimates for . Under certain assumptions about how binding sites are organized in sequence space, can be also computed theoretically. If the binding sites were random sequences of length , one can derive a simple analytical expression for (see SI): . We also studied more realistic models for how TF binding sites are organized, e.g., taking into account the possibility of TFs to bind reverse-complemented sites (SI Section 5.2); an improved biophysical model for mismatch energy that saturates with the number of mismatches (SI Section 5.3); and a model of binding sites that have evolved to be maximally distinct (SI Section 5.1). All these variations ultimately only affect the value of while leaving the crosstalk formalism unchanged. We therefore carried out our main computations as a function of directly. To estimate typical crosstalk for values of that are biophysically realistic, we assumed that binding sites are distributed as randomly as possible in the sequence space while avoiding excessive similarity (i.e., we used the results of Fig S14 with ).
Basic crosstalk model exhibits three distinct regulatory regimes
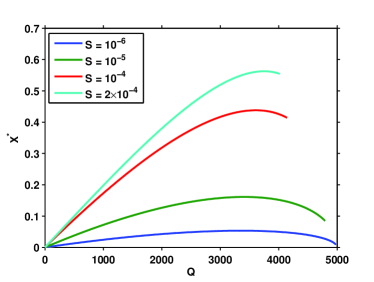
While we can reasonably estimate the major determinants of crosstalk in our model—the number of genes typically coactivated, , the total number of genes, , and the binding site similarity —it is harder to determine the appropriate value for the total concentration of available TFs, . This is not only due to the lack of quantitative data, but also because the relation between the total copy number of TFs in a cell and the concentration of TFs that are available for binding may be complicated [18]. We thus opted for an alternative approach: we look for a concentration that minimizes the crosstalk error . An optimal emerges as a trade-off between activating the genes that should be active (for which a higher concentration is beneficial) and avoiding the activation of the remaining genes (for which a lower concentration is beneficial). Such a minimum, , is a lower bound on crosstalk, which can be analytically computed in the mean field approximation (SI Section 1), as well as validated numerically by simulation (SI Section 2). This level of crosstalk cannot be decreased even if a cell could perfectly adjust its TF concentrations to the environment and optimally compensate the concentrations for nonspecific binding and sequestration.
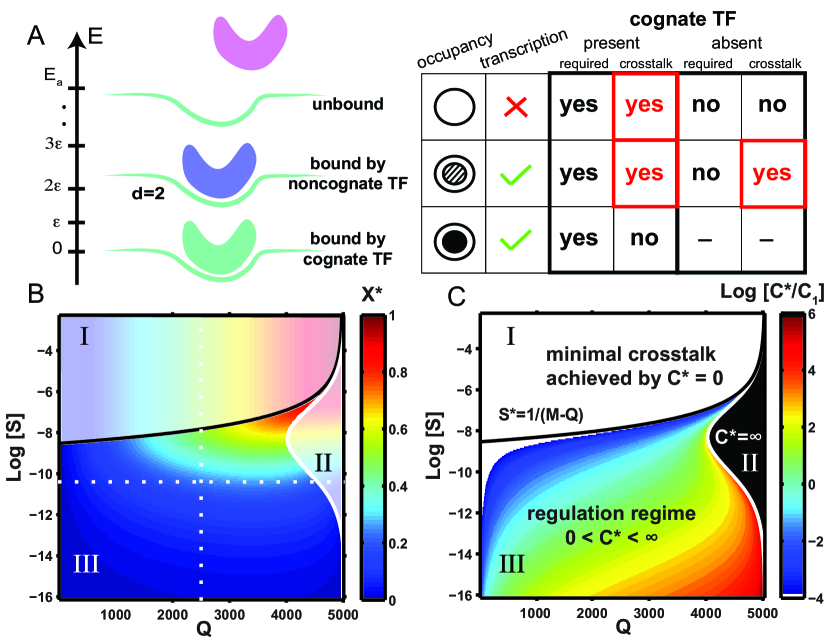
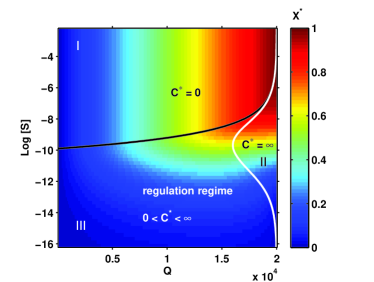
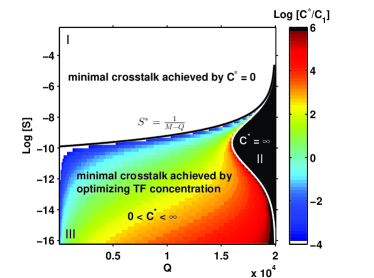
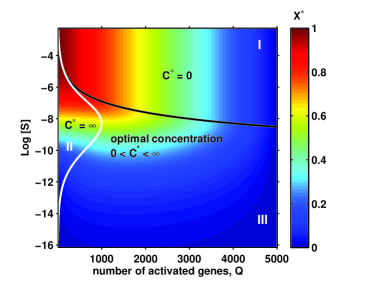
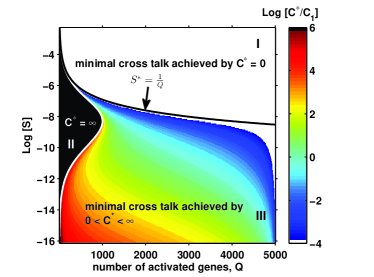
First, we consider a fixed number of total genes, , and ask how crosstalk depends on the number of co-activated genes, , and the binding site similarity, , in our basic model, summarized in Fig 3A. The optimization yields three distinct regulatory regimes, illustrated in Figs 3B, C. For larger values of where binding sites are very similar, regulation is so non-specific that crosstalk is minimized by having no TF at all, i.e., at (region I). This regime, which happens whenever , is dysfunctional and thus biologically implausible. Interestingly, the resulting fundamental limit to , or to how similar binding sites can ever get while still permitting functional regulation, is set by , the typical number of genes that must remain inactive in each environment. This highlights the strong constraint on the regulatory system of keeping undesired gene activation levels low despite crosstalk interference.
As the organism tries to activate increasingly large subsets of genes in each environment and increases, the optimal concentration climbs until we reach a regime where formally diverges (region II), shown in Fig 3C and Fig S2. In this limit, however, a biologically plausible solution would simply be to constitutively express the majority of the genes rather than using transcriptional regulation to do so, thus avoiding any possible crosstalk interference. This strategy might be applicable for organisms living in nearly constant environments, such as obligatory parasites.
Finally, there is a broad region (region III) in the plane where crosstalk is minimized by a finite positive value for the optimal TF concentration. In this regime, which we call the “regulation regime” since it corresponds to the biological notion of regulation, crosstalk is given to a very good approximation by
| (5) |
This simple expression for is one of our key results. It is independent of the energy gap between cognate and unbound states, ; increasing this gap only lowers the optimal concentration, , while leaving the crosstalk unchanged. The crosstalk depends both on the fraction of genes that need to be activated, , as well as on the total number of genes that need to be inactive, , in a typical environment. This dependence also suggests that it is costly to maintain genes that are never expressed, arguing against unlimited accumulation of obsolete genes in organisms. Crosstalk in the regulation regime is dominated by the second term of Eq (S8), and thus increases as and as for sufficiently small . At the boundary between regions I and III, where regulation breaks down, , hence and is independent of throughout region I, because all genes that need to be active are in a crosstalk state due to absence of TFs. Alternatively, we can view Eq (S8) as a function of , the total number of genes, at a fixed fraction of genes typically activated, . In that case we can see that the average binding site similarity sets the limit to the maximum number of genes in the organism, , if the system is to stay in region III where regulation is effective. This is confirmed in Fig. S1 by a detailed analysis of crosstalk for an organism with genes, a typical number for a metazoan.
A quick inspection of Fig 3B shows that crosstalk in the basic model is surprisingly high for an organism of genes of which typically a half () would be activated in each environment, and with TF specificity typical of metazoans (). At these “baseline” parameters, the crosstalk limit is , implying that almost a quarter of the genes at any time would be in an erroneous regulatory state. This suggests that global crosstalk is a serious constraint and that more complex regulatory mechanisms have evolved, in part, to permit reliable regulation despite noncognate TF binding. In what follows, we examine variants of the basic model to assess the robustness of our theoretical conclusions and compare, quantitatively, the crosstalk limit for different regulatory scenarios at our “baseline” parameter set. These results are detailed below as well as in the SI, and are summarized in Table 1.
| Model | Crosstalk | Remarks |
|---|---|---|
| (at baseline | ||
| parameters) | ||
| Basic model (activators-only) | 0.23 | |
| Basic model (repressors-only) | 0.23 | |
| Mixed model (activators + repressors) | 0.14 | 2000 genes expressed in of the env., |
| 3000 genes in . | ||
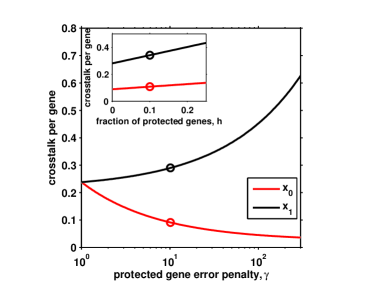
| Genes of unequal importance | 0.31 | 10% of the genes are important and penalized |
| the “normal” rate. | ||
| The resulting error per important gene | ||
| decreases to 0.1, | ||
| but for the other genes increases to 0.33. | ||
| Unequal weights for the two error types | 0.17 | , weight of erroneously-active genes is |
| half that of genes that are erroneously inactive. | ||
| Each TF regulates exactly genes | 0.08 | Also holds for Poisson(). |
| Activators + global non-specific repressor | 0.23 | cannot reduce crosstalk. |
| Activators + specific repressors (non-overlapping) | 0.2 | |
| Activators + specific repressors (overlapping) | 0.15 | |
| Perfect AND-gate combinatorial regulation | 0.07 | Uses only TF species. |
| Generic cooperativity | 0.064 | e.g., dimerization, direct TF-TF contacts, |
| TF/nucleosome competition, etc. | ||
| 2 bindings sites, each of length . | ||
| Cooperativity exclusive to cognate binding | 0.006 | currently unknown molecular mechanisms |
| 2 bindings sites, each of length . |
Crosstalk constraints exist also in variations of the basic model
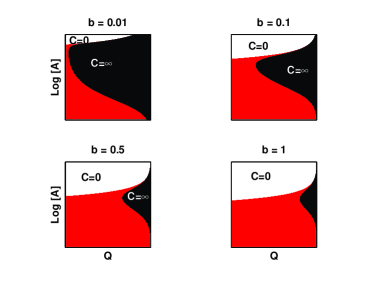
We first ask whether the existence of regimes where regulation in the basic model is ineffective (region I and II) could be an artefact of penalizing expression of unnecessary proteins equally to the incorrect expression of the necessary proteins. To study this, we vary the relative contribution of the two components of crosstalk error, and from Eqs (1,2), to the total crosstalk, . In Fig. S5 we show that all three regimes reported for the basic model exist generically, although their boundaries may shift (see also Table 1 and SI Section 1.3).
Next, we ask how our results change if all genes do not contribute equally to the total crosstalk, . We thus split genes into two groups: “important” genes contribute to the crosstalk error more than “normal” genes, but—in order to compute the lower bound on crosstalk—we allow TFs of the basic model to redistribute optimally between the two groups. Fig. S6 shows that in this scenario the crosstalk for important genes can be reduced, but only at a cost of increasing the crosstalk error for normal genes. Our theoretical framework can be extended easily to treat multiple heterogenous groups of genes.
Next, we examine the situation where each TF can regulate more than one target gene. Specifically, the cell still contains genes in total out of which need to be activated in each environment; in contrast to the basic model, each TF now activates groups of genes, which are assumed to have identical binding sites (if the sites are not identical, one can show that the crosstalk only worsens). In this case the achievable crosstalk is lower than in the basic model, as expected: the regulatory network is trading off detailed control over individual genes for crosstalk improvement. Surprisingly, however, the crosstalk decreases only by a factor of (Table 1; see SI Section 1.5), making it unlikely that crosstalk constraints could be made negligible solely by implementing gene regulation at a very coarse level.
Finally, we modify our basic model to use repression instead of activation to regulate target genes. In the basic model, the default state for each gene is to be inactive, with transcription proceeding only when an activator is bound; in the modified model, the default state for each gene is to be expressed, which can be prevented by binding of a repressor. We find a simple mathematical relation between the crosstalk equations for the basic model and its repressor-only version (SI Section 1.2), showing that the repressor-only case exhibits the same three regulatory regimes and the same range of crosstalk values. One can also consider mixed models, where activation is used for some genes and repression for the others. Unless symmetry between genes is broken such that some genes need to be activated in more environments than other genes, crosstalk is minimized by pure strategies (using either only activators or only repressors); mixed strategies can become optimal when the symmetry is broken (see SI Section 3).
Crosstalk is not easily mitigated by complex regulatory schemes
So far we considered the simplest cis-regulatory element architecture with a single TF binding site. Most genes, especially in eukaryotes, employ complex regulatory elements with multiple TF binding sites, some of which have been suggested in the literature to increase the effective binding specificity of TFs or protect the binding sites from spurious binding [25, 24]. By implication, such effects are expected to also reduce crosstalk. We next use our theoretical framework to study quantitatively under what conditions that may be the case.

Cooperativity. We extend our basic model such that each gene is influenced by two nearby binding sites of length to which cognate TFs can bind cooperatively. For simplicity we assume that cooperativity occurs between TFs of the same type, although the framework can be extended to more general cases. This molecular configuration of two cognate DNA-bound proteins is favored by an additional energy contribution . We assume that only one of the two sites controls transcriptional activity directly (here, the site proximal to the gene start, e.g., by polymerase recruitment [27]), while the other – here, the distal site – helps stabilize the binding to the proximal site, as schematized in Fig 4A. In this model, as goes to zero, the distal binding site has no effect on regulation, and we recover the basic model of regulation by a single binding site (Fig 3).
To assess whether cooperative regulation can reduce crosstalk, we compute the minimal achievable crosstalk, , and compare this in Fig 4B with the minimal crosstalk of the basic model, . We find that cooperativity can significantly reduce crosstalk in a large part of the “regulation regime,” which itself extends towards larger . Examining in detail how the crosstalk behaves in Fig 4C, we see that at a fixed binding site length , minimization of crosstalk prefers strong cooperativity ; nevertheless, the improvement in crosstalk is bounded and as grows, saturates at a limiting value. In this limit, crosstalk can approach and even drop below the crosstalk of the basic model with a binding site which is twice as long. This is a relevant comparison because cooperative regulation does, in fact, have access to a total of base pairs of recognition sequence. Furthermore, the optimal TF concentration required in the cooperative case is lower than in the single site case (Fig 4D), making cooperativity a realistic crosstalk reduction mechanism.
The crucial assumption of the cooperative model presented above is that cooperative interaction between two TF molecules can only occur when they bind their cognate binding sites and never otherwise. This is a very restrictive assumption that is unlikely to hold in many documented models of cooperativity. For example, if cooperative interaction energy originates in protein-protein interactions between the two TF molecules of the same species, this energy will plausibly be gained even when these same TF molecules come into contact while binding two nearby noncognate sites. Similarly, synergistic activation [24] or nucleosome-mediated cooperativity [45] models also imply that noncognately-bound factors could contribute towards cooperativity, violating our assumption that cooperativity is exclusive to cognate binding.
To relax this assumption and study the effects of the resulting “noncognate cooperativity,” we recompute accordingly the crosstalk improvement relative to the basic model, as shown in Fig S19. Not surprisingly, we find that allowing cooperative interactions between TFs of the same type when bound noncognately leads to much smaller reductions in crosstalk compared to cooperativity that is exclusive to cognate binding, as shown in Table 1. When noncognate cooperativity is allowed, we can also look at the strong cooperativity (large ) limit and compare crosstalk improvement due to two TFs cooperatively binding two sites of length , to the basic model of a single TF binding a site of length . Now, cooperative regulation by two TFs is always inferior to the regulation by a single factor with a longer binding site (see SI Section 6).
Dimerization of TFs is very common among prokaryotes, where TF monomers often dimerize in solution before binding to DNA. If the two binding sites in our model predominantly act as half-sites for the binding of a single dimer, the relevant equations for crosstalk are identical to noncognate cooperativity in the large limit, with being the concentration of monomers. Our theory is thus also applicable to this case, although dimerization in solution is often not considered a canonical example of cooperative regulation. Cooperative interactions conditional on DNA binding have been less frequently reported but are also known to occur in prokaryotes (e.g., on proximal binding of two dimers); in experimentally documented cases, the interaction energies are weaker, [27], which still facilitates crosstalk reduction although it is accordingly smaller (Fig S19).
The two cases of cooperativity we considered here represent two extremes of a spectrum: cooperative interaction is either possible exclusively at the cognate site, or at all sites equally. There likely exist intermediate situations which help limit the occurrence of spurious cooperative interactions. A simple example of such a mechanism could utilize the positioning of the binding sites on the DNA: TF cooperative binding is limited only to pairs of sites which are appropriately spaced. If different TF types use different spacing, the harmful effects of cooperativity at a particular noncognate site pair will be restricted to a subset of TFs. More complex geometrical arrangements, e.g., cooperative interactions involving DNA looping or allosteric effects between the two TFs and the DNA [46], could provide similar benefits. While possible in principle, these benefits should be considered as hypothetical, since direct experimental support for cooperativity that is exclusive to cognate binding is still lacking.
Combinatorial regulation by activators and repressors. An important contribution to crosstalk is the erroneous activation of genes that should remain inactive. One might argue that any kind of global repression could alleviate this problem by preventing spurious transcription. We explored this scenario by extending our basic model to include an additional nonspecific repressor (SI Section 8). Perhaps not surprisingly, we find that the minimal achievable crosstalk error in this extended scheme is exactly the same as in the basic setup, regardless of the concentration and the affinity of the sites.
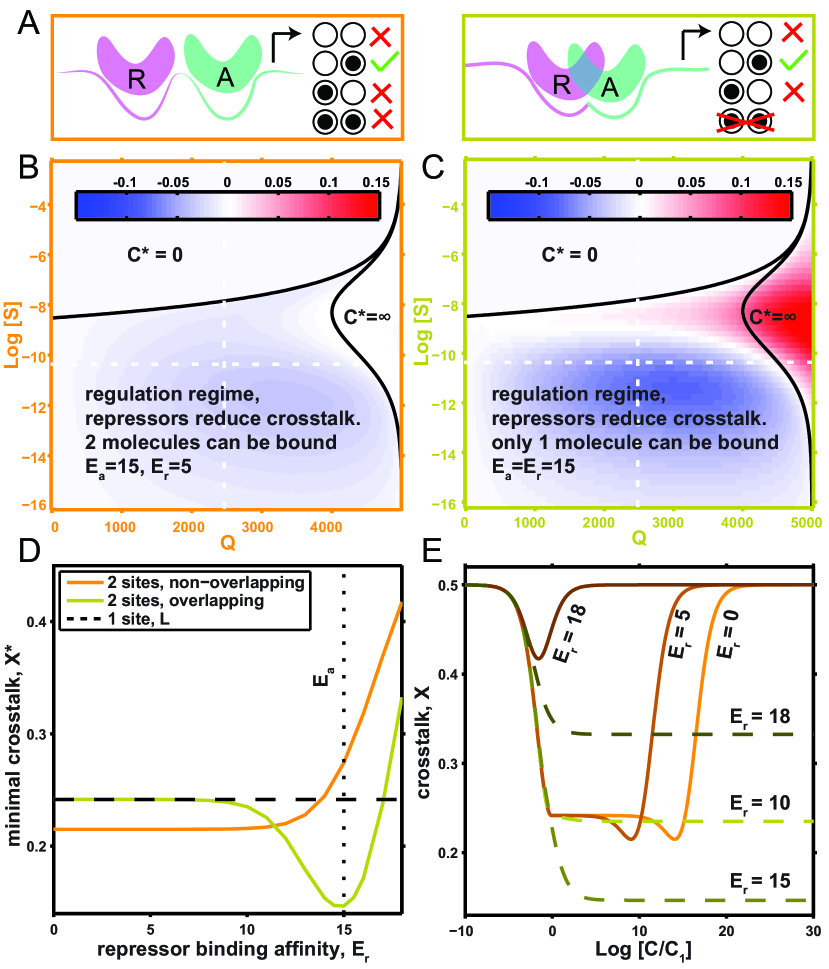
We next turned our attention to a sequence-specific repression mechanism. In an extension to our basic model, we equipped each gene with both an activator and a repressor site, such that each of these sites has its own cognate regulator (activator or repressor). For the genes that should be active, only their cognate activators (but not repressors) were present. For the remaining genes that should be inactive only their cognate repressors (but not activators) were present. Repressor sites could have a different affinity () than the activator sites (). To look for the minimal achievable crosstalk, we optimized over the concentration of activators, repressors, and the affinity . Importantly, we considered two possible molecular arrangements on the promoter: in the non-overlapping sites scenario (Fig Crosstalk is not easily mitigated by complex regulatory schemesA, left) the two binding sites could be occupied by regulatory molecules simultaneously, whereas in the overlapping sites scenario (Fig Crosstalk is not easily mitigated by complex regulatory schemesA, right), either the activator or repressor site, but not both, could simultaneously be occupied. Whether this exclusion happens because the two binding sites literally overlap or due to more complex mechanisms is not crucial for our results. We assumed that a bound repressor inactivates transcription, regardless of the activator state; for a detailed list of molecular configurations on the promoter, see SI Section 9.
In the non-overlapping case, small ( at baseline parameters) decreases in crosstalk error are nominally possible, as shown in Fig Crosstalk is not easily mitigated by complex regulatory schemesB. A detailed examination, however, argues against this mechanism for crosstalk reduction. Optimization in Fig Crosstalk is not easily mitigated by complex regulatory schemesD assigns the repressor sites a very weak, or even vanishing, affinity for the TFs, : in essence, the repressor sites energetically favor staying empty to the same amount as binding a cognate repressor, to fight off noncognate binding. As a costly consequence, the optimal concentration of the required TFs needs to be larger by an unreasonable factor, -fold, relative to the basic model, to achieve this small crosstalk reduction gain.
The overlapping case provides a greater crosstalk reduction ( at baseline parameters), as shown in Fig Crosstalk is not easily mitigated by complex regulatory schemesC. The optimal repressor sites have similar affinity to their cognate TFs as do the optimal activator sites, ; the benefit of the repressors quickly vanishes if this condition is not met. The total required regulator concentration now no longer has a clearly defined optimum, but does exhibit a plateau where the crosstalk is minimized. Importantly, as shown in Fig Crosstalk is not easily mitigated by complex regulatory schemesE, this plateau is reached for concentrations only somewhat higher than in the baseline case, making this solution biologically plausible.
In sum, the case for combinatorial regulation by activators and repressors is complicated. Combinatorial regulation provides a smaller absolute improvement than cooperativity, but this improvement is also centered around smaller values for binding site similarity, , where the crosstalk of the basic model is itself already lower. In contrast to our initial expectation, this small gain is realistically achievable only with one of the two regulatory schemes considered, and only when its parameters are properly tuned.
AND-gate combinatorial regulation. Lastly, we considered the simplest AND-gate regulation scenario. The expression state of each gene is determined by the occupancy of two binding sites; in particular, activation is achieved by binding of a precisely specified, unique pair of cognate activating TFs. Crucially, in the “perfect combinatorial regulation” scenario, TF species (instead of , as in the basic model) are sufficient to specifically regulate any subset of the genes. As we show in SI Section 7 and summarize in Table 1, this leads to a sizeable crosstalk reduction. Using TF species means, on average, regulated genes per TF. If sets of genes were regulated jointly by a common TF, crosstalk should decrease as , as we argued above. Figure S21 shows that for the AND-gate the decrease is somewhat smaller, but unlike in the simple scenario where each TF regulates groups of genes with no possibility of control over individual genes, the AND-gate allows each gene to be regulated individually. While this combinatorial strategy allows crosstalk reduction and has been documented at specific promoters, we point out that the predicted, square-root scaling of the number of TF species with the total number of genes, , is inconsistent with published reports [47, 48], making it unlikely that crosstalk reduction is achieved through genome-scale combinatorial control as analyzed here.
Discussion
Finite specificity of recognition reactions is a fact of life at the molecular scale. In transcriptional regulation, which takes place in a mix of cognate and noncognate transcription factor species, the consequences of this fact could be severe—but have surprisingly not been taken to their logical conclusion so far. Here, we constructed a theoretical framework for crosstalk that accounts for all possible cross interactions between regulators and their binding sites. This global model enabled us to compute the lower bound on crosstalk and assess the effectiveness of various regulatory schemes. We derived limits to reliable gene regulation that depend only on the total number of genes , the typical number of co-activated genes, , and the average level of similarity between pairs of binding sites, .
We find that these parameters robustly define three possible regulatory regimes. A nonzero TF concentration that minimizes crosstalk exists only when binding sites are sufficiently distinguishable from each other and the typical number of co-activated genes is not extreme. We call this the “regulation regime.” The other two regimes are anomalous cases where regulation is dysfunctional. Looking closely at the boundaries between the three regulatory regimes, we find that the average similarity between binding sites, , puts an upper bound to the total number of genes that an organism can effectively regulate [49].
An analogous problem exists in protein-protein interaction networks, where protein function requires strong binding to a few partner-proteins but avoidance of binding to all the others [7, 6]. Previous works have studied the evolution of such networks by applying a combination of positive and negative design using computer simulations, concluding that “negative design” seriously constrains the possible architectures [50, 51, 52, 6]. As a quantitative measure for the likelihood of specific vs. nonspecific interactions, Johnson et al used the minimal energy gap between specific and nonspecific interactions, in analogy to our measure of binding sites similarity . They found a power-law scaling of the energy gap with the total number of proteins in the network and also found that it depends inversely on the size of binding surface, – both results are in qualitative agreement with ours for the total number of genes and length of the binding sites . Similarly, a larger binding domain was found to enable a larger number of specific interactions in a protein mixture when other nonspecific interactions are excluded [51]. Johnson et al also found that network designs in which some proteins have multiple specific partners (“hubs”) have higher crosstalk compared to networks with only pairwise interactions. At this point protein-protein interaction networks significantly differ from TF-DNA interactions: if multiple binding sites share a common TF, these binding sites cannot bind each other, as would be the case for different protein species interacting with a common hub. Zhang et al identified a trade-off between proteome diversity and concentration due to crosstalk considerations, concluding that the numbers found experimentally are close to the possible limit [7]. Protein concentrations face trade-off: they should be high enough to form specific interactions, but not so high as to form many non-specific ones. The optimal TF concentration in our model is determined by a similar trade-off. Analogous problems due to explosion of non-cognate configurations were studied in the context of prebiotic metabolism [53] and the immune system, where receptors are selected to recognize foreign peptides, but avoid binding self-peptides [54]. In the context of TF-DNA interactions Sengupta et al [21] studied how the evolutionary mutation-selection balance tunes TF specificities to its DNA targets and how this depends on the number of targets. They identified a trade-off between avoiding the loss of current targets (for which a lower specificity is favored) and avoiding the spurious recruitment of new ones (for which a higher specificity is favored); they also report an inverse relation between the number of different targets and the TF specificity for each. An intriguing direction for future research is to explore how crosstalk might limit the complexity of regulatory networks in an evolutionary setting.
| prokaryotes | eukaryotes | |
|---|---|---|
| binding site length | 10-20 bp | 6-10 bp |
| binding site similarity, | ||
| number of genes, | a few thousands | |
| crosstalk in the basic model | 20%-50% (depending on ) | |
| crosstalk with cooperative regulation |
Where do real organisms find themselves in this parameter space? Prokaryotes tend to have longer binding sites and fewer genes than eukaryotes. In Table 2 we present typical biophysical parameters for each and the resulting crosstalk estimates. While for prokaryotes we expect crosstalk to easily be between and even if each gene is regulated by a single site, and below for biophysically realistic cooperative regulation, for eukaryotes the situation is significantly different. Even for a short genome of genes, such as yeast, or for longer genomes of metazoans where most of the genes have been non-transcriptionally silenced, we expect minimal crosstalk of . In an organism with regulated genes crosstalk would increase substantially according to the basic model: more than 40% of all genes would be erroneously regulated. Incorporating known constraints on the biophysics of TF-DNA interaction (Figs. S16, S17) increases crosstalk even further and pushes metazoan regulation towards the anomalous regime.
Complex regulatory schemes increase the specificity of gene regulation by cognate factors, and high specificity was tacitly assumed to provide automatic resilience against crosstalk. In contrast, our analysis of several complex regulatory mechanisms reveals a more intricate picture. We focused on two broad classes of regulatory mechanisms. The first class comprises various schemes of cooperative regulation. Cooperativity can lower crosstalk because it effectively increases the binding site length and energy and thus reduces binding site similarity. We found that the effectiveness of cooperativity for reducing crosstalk crucially depends on the strength of the cooperative interaction and on whether cooperative interactions are restricted exclusively to cognate sites. With respect to cooperative interaction strength, the optimal crosstalk reduction happens at very strong cooperativity, but this might be hard to realize biophysically. Commonly reported values are indeed small (), comparable to the energetic contribution of only bp in the TF-DNA interaction [27, 28]. With respect to cooperative interactions being exclusive to cognate binding, such regulatory schemes, while optimal for crosstalk reduction, would require additional sequence recognition mechanisms, and it is unclear to what extent they exist or how effective they are. If cooperative interactions can occur at non-cognate sites as well, as is the case for most documented mechanisms of cooperativity, its effectiveness in mitigating crosstalk is significantly diminished. The second class of mechanisms we considered relies on combinatorial regulation by multiple TFs. As a representative example we studied combinatorial regulation by activators and repressors. Contrary to the common expectation that repression should eliminate spurious gene activation [25, 24], we found various mechanisms to be either ineffective (global repression) or providing marginal global improvement at best (activator-repressor regulation with overlapping binding sites). While crosstalk can indeed be mitigated for particular gene(s) by employing a complex promoter architecture, this inevitably comes at a cost for the regulation of other genes. The intuitive explanation for the limited benefit of combinatorial schemes is that adding new regulatory components—in this case, repressors and their respective binding sites—drastically increases the number of possible noncognate interactions, thereby potentially aggravating, instead of mitigating, the crosstalk problem. A similar detrimental effect due to growth in the number of undesired configurations with the number of molecular species has been reported in the study of molecular self-assembly [12]. A potentially powerful set of mechanisms are therefore schemes in which combinatorial regulation is used primarily to decrease the required number of molecular species, as in the simple AND-gate example we explored in SI Section 7. Further work is needed to fully elucidate crosstalk limits in more general models of combinatorial control and cooperativity, with interesting parallels to precision in biochemical sensing, in equilibrium as well as out-of-equilibrium scenarios [55, 3, 56, 29].
An interesting result of our study is that various schemes of molecular control logic at promoters and enhancers [57], while nearly equivalent in the absence of crosstalk, can behave very differently in the presence of noncognate regulators [58]. For example, the issue of cooperative interactions during noncognate binding is a striking demonstration of how a seemingly microscopic detail may influence global crosstalk, while it has no bearing on the aspects for which cooperativity has been studied traditionally: its ability to sharply activate the cognate gene in response to small increases in TF concentration. A similar remark applies for the case of overlapping vs nonoverlapping binding sites in the combinatorial regulation scenario. By going beyond mean-field approximations, this could be extended to biologically relevant situations where pairs of binding sites overlap so as to share large sequence fragments [59]. Clearly, there is a need to further understand signal processing at complex promoters [60], and calls for experimental measurements of crosstalk in various regulatory architectures.
Direct measurements of crosstalk are challenging precisely because crosstalk is a global effect and experimentally influencing noncognate binding in a controlled manner is difficult. An alternative approach would be to search for indirect signatures of crosstalk [61]. A promising line of research supported by a large body of recent experimental evidence would be to examine “pervasive transcription” in eukaryotes [15, 62] as a proxy for erroneous initiation, perhaps due to crosstalk interference.
Taken together, our findings suggest that global crosstalk represents a strong constraint in eukaryotic regulation that can be mitigated, but not easily removed. Initially, this conclusion was based on a greatly simplified model of gene regulation. We succeeded in relaxing many of our assumptions only to find that crosstalk constraints remain significant. This is because the major determinant of crosstalk is the binding site similarity , which primarily depends on the typical mismatch energy and the length of the binding sites, . While crosstalk could be reduced by extending binding site length and/or augmenting the binding energy, both parameters are severely constrained by a combination of biophysical and evolutionary factors. The scale of the mismatch energy is set by the energetics of hydrogen bonds to , while the length of individual binding sites in eukaryotes appears strongly constrained by evolutionary considerations to bp [21, 63, 64]. Moreover, the performance of complex regulatory schemes, which appear beneficial at first glance, is also limited by the explosion of possible noncognate configurations that may lead to erroneous regulation. These constraints should apply universally, beyond the specific mechanisms we analyzed in detail: any regulatory scheme operating at equilibrium, no matter how complex, faces a fundamental limit to its achievable error, for reasons that led Hopfield to propose kinetic proofreading [2].
The main conclusion of our work is that crosstalk in gene regulation is far from being a solved problem. We find several commonly studied regulatory mechanisms to be insufficient for eliminating crosstalk in metazoans, at least when acting alone. While it is theoretically possible that a combination of equilibrium mechanisms acting in unison could achieve low crosstalk levels, this possibility is by no means obvious and indeed appears unlikely. Alternatively, cells might have evolved out-of-equilibrium solutions where energy is deliberately spent to counteract the detrimental effects of crosstalk; example mechanisms could include permanent gene silencing, localization of transcriptional activity to specific cellular compartments, or molecular reaction schemes for gene regulation that implement variants of kinetic proofreading [29].
Acknowledgments The research leading to these results has received funding from the People Programme (Marie Curie Actions) of the European Union’s Seventh Framework Programme (FP7/2007-2013) under REA grant agreement Nr. 291734 (T.F.), ERC grant Nr. 250152 (N.B.), and Austrian Science Fund grant FWF P28844 (G.T.). We thank Rok Grah, Tiago Paixão, Georg Rieckh, Thomas Sokolowski and Marcin Zagorski for critical reading of the manuscript, and Dominik Schröder for valuable insights to our mean-field approximation.
Intrinsic limits to gene regulation by global crosstalk – Supporting Information
Tamar Friedlander, Roshan Prizak, Călin C. Guet, Nicholas H. Barton and Gašper Tkačik
1 Basic model – analytical solution
We assume that the genome of a cell contains “target” genes, each of which is regulated by a single unique transcription factor binding site (BS). In the basic formulation, there exist also distinct TF types, such that each TF can preferentially activate its corresponding target gene by binding to its binding site. At any point in time, however, not all TF types are present: we assume that only subsets of size are present at some nonzero concentration, and that the optimal gene regulatory state for the cell would be to express exactly and only those genes for which the corresponding TFs are present.
Let regulation be determined by the (mis)match between the binding site sequence and the recognition sequence of any transcription factor. Each binding site is associated with a single TF type with which it forms a perfect match – this is the cognate TF for the given binding site. However, each site could also occasionally be bound by other (noncognate) TFs, at an energetic cost of a certain number of mismatches. Following earlier works [38, 20], we assume that the contribution of mismatches at individual positions in a binding site to the binding energy is equal, additive, and independent. We define the energy scale such that binding with cognate TF has zero energy and all other binding configurations have positive energies, proportional to the number of mismatches , , where is the per-nucleotide binding energy. The unbound state has energy with respect to the cognate bound state. The different states and their energies are illustrated in Fig. 3A in the main text. We employ a thermodynamic model to calculate the equilibrium binding probabilities of cognate and noncognate factors to each binding sequence.
TFs can also be non-specifically bound to the DNA. These configurations only sequester TFs from free solution, but do not directly interfere with gene expression. As explained later, we will lump together the TFs freely diffusing in the solution, as well as nonspecifically bound TFs and any other TF “reservoirs” into one effective concentration of available TFs (equivalently, we work with the chemical potential of the available TFs using the grand-canonical ensemble).
Previous studies calculated the probability of a given transcription factor to be bound or unbound to certain DNA sequences [20]. These probabilities were calculated assuming that the site is vacant or bound by the TF under study, but not bound by TFs of other types. This approach is cumbersome when a large number of TF types are considered simultaneously, because the probability that the site is bound by other factors is non-negligible, and due to steric hinderance, a site cannot be bound by more than one molecule at any given time. Previous studies also proceeded by using the canonical ensemble. These two modeling choices together make the problem of many TFs binding to multiple binding sites coupled and not easily tractable, because one would need to enumerate all possible combinations of TF-BS states. However, an alternative and much simpler approach is to employ the grand-canonical ensemble, and calculate the binding probabilities for the binding sites, rather than for the TFs. The necessary assumption is that binding sites behave independently (e.g., they are sufficiently separated on the DNA so that binding at one site does not overlap the binding at another, or if it does, this is treated explicitly). Underlying the grand-canonical ensemble is the assumption that TFs are present at sufficient copy numbers, so that the binding of a single site under consideration does not appreciably affect the chemical potential of the remaining TFs. Experimental support for such decoupling and the applicability of the grand-canonical approach has been demonstrated recently [43]. In the following we assume equal concentrations of all TF types.
We distinguish two contributions to crosstalk:
-
1.
For a gene that should be active and whose cognate TF is therefore present, error occurs if its binding site is bound by a noncognate regulator (activation out of context due to crosstalk), or if the binding site is unbound (gene is inactive). This happens with probability
(S6) where is the concentration of the th TF, is the number of mismatches between the th TF consensus sequence and the binding site of gene , the energy per mismatch and the energy difference between unbound and cognate bound states; all energies are measured in units of .
-
2.
For a gene that should be inactive and whose cognate TF is therefore absent, crosstalk error only happens if its binding site is bound by a noncognate regulator (erroneous activation) rather than remaining unbound. This happens with probability
(S7)
In general depend on the specific set of pair-wise distances between the consensus sequence of each TF present and the site of gene . Hence they could vary between genes, and even for each gene different sets of TFs can yield different values of crosstalk. In the following we assume a fully symmetric setup, such that all genes are equivalent in their sensitivity to crosstalk ( is independent of ). We assume that for each gene the mismatches of all the noncognate TFs are distributed according to a probability density (independent of the gene). For a particular gene , clearly different sets of TFs provide different pairwise distances . However, for the fraction of sets of same size that yield distances which are distributed very differently from is small. In the following we neglect this fraction and assume that all choices of TFs yield exactly the same crosstalk contribution ; this mean-field assumption is explicitly validated by numerical simulations in SI Section 2. We will also consider that all possible sets of TFs (sets of genes that need to be active) are equally likely to occur.
See SI Section 4 for the alternative definitions of and .
Our next step is to calculate total crosstalk as a function of the above parameters (the total number of binding sites and the number of TF types available at any given time ). We define total crosstalk as the fraction of genes found in any of the possible erroneous states. We assume that the particular choice of TFs that are present is random (hence we average over all possible ways to choose out of TFs). In reality only certain sets of TFs need to be active together in which case the genes that are co-activated could have mutually similar binding sites, especially if they were regulated by the same TF, compared to genes that are activated separately, possibly by different TFs. In SI Section 1.5 we treat a simple extension of our model where each TF can co-regulate several target genes. We also assume equivalence between the two types of error (we relax this assumption below in SI Section 1.3).
Clearly, if each of the genes that should be active has probability to be in any of the crosstalk states, then the expected number of genes in that state is . Similarly, of the genes that should be inactive the expected number that are in crosstalk state is . To obtain the fraction of genes in any of the crosstalk states we simply divide by the total number of genes :
| (S8) |
Using the definition of introduced in the main text
| (S9) |
where we approximated which is valid for (an assumption we make here and throughout the paper). is an average similarity measure between all pairs of binding sites. If binding site sequences are drawn randomly from a uniform distribution, . This is easy to derive: since individual base pairs are assumed to be statistically independent, at each position the probability of a random sequence to be identical to a given TF consensus sequence is , whereas with probability it is different, implying a decrease of in binding energy. Since the complete binding site consists of independent base pairs, this expression for a single base pair is now raised to the power of .
The expressions for read:
| (S10a) | ||||
| (S10b) | ||||
The two extreme cases occur when TF concentrations are either zero or very large (Table 3). If , and , i.e., is maximal due to binding sites that should be bound, while zero error for occurs due to binding sites that should be unbound. The total error then amounts to the fraction of genes that need to be activated . At the other extreme, if , and , i.e., no site is left unbound. The magnitude of error due to noncognate binding is determined by the binding site similarity . If , . The total crosstalk then amounts to . If , .
| crosstalk, X | |||
|---|---|---|---|
| 1 | 0 | ||
| 1 | |||
| optimal ; only activators | |||
| optimal ; activators and global repressor |
Next, we analyze the dependence of crosstalk on various parameters. One unknown in these expressions is the TF concentration . Because we are searching for a lower bound on crosstalk, we can find the concentration that minimizes . Taking the derivative of and solving for its zeros,
we find two potential extrema
but only one of them can yield non-negative concentration values (and is consistently a minimum):
| (S11) |
For small the leading terms in the optimal concentration are
| (S12) |
For a constant number of co-activated genes , increases to leading order like the square root of ,
| (S14) |
Substituting into the single gene crosstalk expressions Eqs. (S6)-(S7), we obtain the minimal per-gene crosstalk
| (S15a) | ||||
| (S15b) | ||||
Since crosstalk must be in the range [0,1] and , this solution is only valid under the condition that . Thus, minimal crosstalk has 3 regimes:
-
1.
For , crosstalk is minimized by taking . This is the “no regulation” regime. In this case, crosstalk amounts to , which is simply the fraction of genes that were supposed to be activated (but are not due to lack of their TFs).
-
2.
For , crosstalk is minimized by taking ; this is the “constitutive regime.” is given by two of the roots of the 4th order equation, , solved for . We find the boundaries between the 3 different regulatory regimes by solving for .
-
3.
Otherwise, there is an optimal concentration , given by Eq. (S11), that minimizes crosstalk; this is the “regulation regime.”
The boundary between the first and third region is at and the boundary between the second and the third is at . Hence, the second region (where ) only applies for . Fig S7 illustrates the dependence of the TF concentration , which minimizes crosstalk, on the number of co-activated genes . It demonstrates how the range in which gets narrower when increases. Fig S6 demonstrates crosstalk and values for (compare to Fig. 3 in the main text with ).
1.1 Basic model: Dependence on variables
1.1.1 Dependence on TF concentration
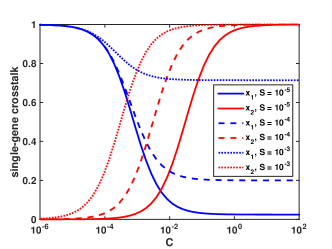
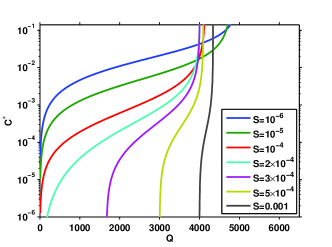
The optimal TF concentration in our model arises as a trade-off between the genes that need to be active (for which a higher is favored) and the genes that need to be inactive (for which a lower is favored). Note, however, the asymmetry between the two crosstalk types: while the component (genes that should remain inactive) can be completely suppressed by having no TF (), the opposite does not hold. The component (genes that should be active) cannot be fully eliminated even for infinitely high , because of the cross-activation between the distinct genes that should be active; see Fig S7(a). This trade-off varies with the relative weights of and , which depend on both and . We find that a concentration that minimizes crosstalk exists only in the third regime (“regulation regime”). In the first regime where , binding sites are so similar that crosstalk due to the inactive genes dominates the total crosstalk. Hence the choice of completely eliminates crosstalk, and minimizes the total crosstalk. In the second regime, where a large number of genes need to be active, crosstalk due to the active genes dominates ( type), hence diverges to infinity. Fig S7(b) illustrates curves of the optimal concentration as a function of the number of active genes for constant values of . As increases, the relative weight of the genes that need to be active increases, hence is always a monotonously increasing function of .
1.1.2 Dependence on the similarity
Both crosstalk types and increase with the similarity (see Fig S7(a)). For a fixed , decreases as a function of . Again, this is because for larger the weight of the genes that should remain inactive is more significant, hence the trade-off shifts towards lower TF concentrations (but the minimal crosstalk still increases!). This behavior applies only in the regulation regime, hence for . For larger values of (), a more complex behavior is found because by changing we pass through all three regimes: then first decreases, then diverges (because it enters the second regime), but then decreases back again.
1.1.3 Dependence on the number of active genes
The two crosstalk types show opposite dependence on the number of active genes : crosstalk per gene that needs to be active () decreases with , whereas crosstalk per gene that needs to remain inactive increases with . The total crosstalk is a weighted sum of both with varying weights, hence it is not surprising that the total crosstalk has a non-monotonous dependence on the number of active genes with a maximum at an intermediate value; see Fig S8. The optimal TF concentration increases with the number of active genes ; see Fig S7(b).
1.2 Basic model with regulation by repressors only
Our basic model assumed that all gene regulation is achieved by using specific activators to drive the expression of genes that would otherwise remain inactive. An alternative formulation of the problem postulates that genes are strongly expressed without TFs bound to their regulatory sites, but need to be repressed by the binding of specific regulators to stop their expression. Indeed, many bacterial genes seem to be regulated in this way. We thus studied this complementary model, in which all regulators are repressors instead of activators. We assume, as before, that out of genes should be active, but now this implies that types of cognate repressors are present for all the genes that should remain inactive.
The expressions for crosstalk per gene that should be active () or inactive () read:
| (S16a) | ||||
| (S16b) | ||||
The total crosstalk is still
| (S17) |
Eqs. (S16) are mathematically identical to Eqs. (S10), where the roles of and are simply swapped. Not surprisingly, the minimal crosstalk in this case is:
| (S18a) | ||||
| (S18b) | ||||
| (S18c) | ||||
which is valid for .
The optimal TF concentration that minimizes crosstalk is now
| (S19) |
The minimal crosstalk and optimal concentration are illustrated in Fig S9. It retains the 3 regulatory regimes observed with activators only:
-
1.
For we obtain the “no regulation” regime where crosstalk is minimized by taking .
-
2.
For we obtain the “constitutive regime” where crosstalk is minimized by taking . is obtained when of Eq. (S19) diverges (the denominator equals to zero).
-
3.
Otherwise, there is an optimal concentration , given by Eq. (S19), that minimizes crosstalk; this is the “regulation regime.”
The three regions are marked with Roman numerals, in accordance with Fig. 3 of the main text. The boundaries between the three regimes are now: (between regimes I and III) and (between regime II to both I and III).
The results are clearly a mirror image of the results shown in Fig. 3 of the main text for the activator-only basic model. They can be obtained simply by mapping . Since we keep the convention that is the number of genes that are active, the difference in regulation strategies amounts to having either activator types and keeping binding sites unbound (activator-only) or having repressor types and keeping binding sites unbound. Comparing the expressions for minimal crosstalk, Eq. (S18c) to Eq. (S13), we conclude that crosstalk depends on the fraction of TFs that are expressed and on the absolute number of binding sites that need to remain unbound.
1.3 Breaking the symmetry between the two crosstalk types
In our basic model we made a simplifying assumption that the two crosstalk types, and , have equal weights: not activating a gene that should be active or erroneously activating a gene that should be silenced are assumed to be equally disadvantageous. We now relax this symmetry by allowing different weights, and , for the two crosstalk types, to model possible differences in their biological significance. Eq. (S8) for the total crosstalk now takes the form:
| (S20) |
The expression for the optimal TF concentration then reads:
| (S21) |
where again only one of the two solutions yields non-negative concentration values. The resulting minimal crosstalk is:
| (S22) |
Setting reduces the above formula to the previous solution, Eqs. (S11)-(S13). Note the asymmetry between the two crosstalk types: if , i.e., when crosstalk in genes that should remain inactive is insignificant, the minimal achievable crosstalk equals zero. This is not true in the other extreme case, when . In Fig S10 we show that the three different regulatory regimes still exist under this generalized definition of crosstalk, but their boundaries may shift.
1.4 Breaking the symmetry between the co-activated genes
In our basic model we imposed full symmetry between the co-activated genes: they contributed equally to crosstalk and all types of TFs were assumed to exist in equal concentrations. We now relax these assumptions. We examine the situation in which a fraction of these genes is more important to the functioning of the cell. Mathematically, we postulate that the per-gene crosstalk error for the important genes contributes with a -times higher weight to the total crosstalk relative to the non-important genes. We introduce an additional degree of freedom to the model, by allowing the concentration of the TFs to split unevenly between important and other genes: each important gene has TFs present at concentration , while a TF of a non-important gene is present at concentration .
As we obtain:
| (S23a) | ||||
| (S23b) | ||||
If either or this reduces back to the basic model with . The total crosstalk now takes the form:
| (S24a) | ||||
| (S24b) | ||||
| (S24c) | ||||
| (S24d) | ||||
where is the per-gene error of the important genes, is the error of other genes that need to be activated, and , as before, denotes crosstalk at genes that need to be kept inactive.
We can optimize numerically for both the total TF concentration and the factor by which the TF concentration of the important genes is amplified. Alternatively, we can assume that remains fixed at the optimal value for the case where all genes are equally important, and only optimize for . We display the latter option in Fig S11, to explore crosstalk at varying under equal resource constraints.
The special case when only a single gene is important is analytically solvable assuming , yielding:
| (S25) |
In particular the per-gene errors read:
| (S26a) | ||||
| (S26b) | ||||
| (S26c) | ||||
The error of the single important gene can be reduced at most by a factor of relative to the other co-activated genes. The error for the other genes remains the same, because we assumed that . Interestingly, the genes that need to be kept inactive suffer an increase in crosstalk as a consequence of protecting the important gene.
1.5 Every transcription factor regulates genes
In the basic model we considered a regulatory scheme in which every gene has its own unique TF type. This allows for maximal flexibility in regulating each gene individually. Real gene regulatory networks typically have fewer TFs than the number of target genes, so that at least some transcription factors regulate several genes. Here we consider a simple extension of the basic model, in which each TF regulates genes (with identical binding sites) rather than one. We assume no overlap between the sets of genes regulated by various TFs, so that the total number of TFs species is now times smaller than before. If genes should be active, then TF species should be present in a given condition. Assuming that , we can approximate as before. The only change from the basic crosstalk formulation is in , because the concentration of cognate factors is now times larger than before:
| (S27a) | ||||
| (S27b) | ||||
This formulation is analytically solvable, yielding
| (S28a) | ||||
| (S28b) | ||||
| (S28c) | ||||
| (S28d) | ||||
The equations for minimal crosstalk are equivalent to the basic model if we map . Since crosstalk depends on to first order, this amounts to crosstalk reduction by a factor of .
For small the leading term in the optimal concentration is
| (S29) |
These gains in crosstalk have, however, been achieved by sacrificing the ability to regulate each gene individually: now, the smallest set of genes that can be co-activated is of size . Typically, TFs might constitute of the genes [47]; with , the crosstalk could be reduced by a factor of at best.
1.5.1 Non-constant
Until now, we assumed that each TF regulates exactly genes. This assumption can be relaxed using numerical simulations; in particular, we considered the case where the number of genes that each TF regulates is a random variable drawn from a specified distribution. We started by defining which TF controls which sets of genes through explicit enumeration of binding site sequences. We assumed that the number of genes that a given TF regulates is approximately Poisson distributed (with mean ) and that all these regulated genes use the same sequence for their binding site, equal to the consensus sequence of the cognate TF. We then sample the environments in which out of the total of genes are active; given the regulatory network structure, not all picks out of can be realized, as is also the case with constant model. The crosstalk is evaluated in each environment exactly, by computing all thermodynamic states of all binding sites, and is subsequently averaged by Monte Carlo sampling through the possible environments. This extension to the model introduces no new parameters, so its crosstalk and regime boundaries can be straightforwardly compared to the model where is constant. We find that Poisson-distributed changes crosstalk at a below-percent level, and produces no notable shifts in regime boundaries, showing that our results are robust with respect to this particular distributional assumption.
2 Validity of the mean-field assumption
In computing crosstalk at given and , we have made a mean-field assumption on the similarity measure . For a given set of binding site sequences in the sequence space (total in number), this amounts to assuming that the distribution of neighbours for each binding site comes from the same underlying distribution. For a particular selection of genes, for each binding site from the binding sites, similarity can be defined using where indexes over the binding sites of the selected genes.
| (S30) |
From this, we have for crosstalk for a particular selection of genes,
| (S31) |
where and depend on as shown. We are interested in the mean crosstalk over all selections of out of genes, which requires us to know the full distribution of . The crosstalk is then
| (S32) |
In the mean-field assumption, we have and , which gives us
| (S33) |
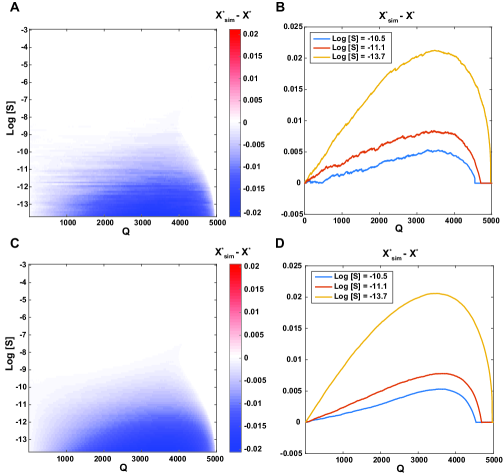
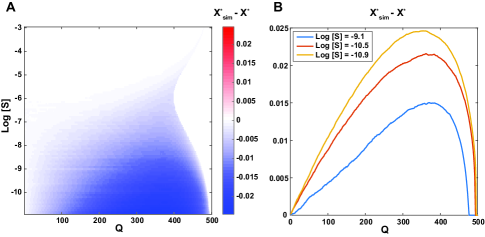
From this, one can obtain the optimal crosstalk . To check the validity of such a mean-field assumption, we performed numerical simulations by drawing lists of binding sites from the sequence space, computing optimal crosstalk by explicit enumeration of all thermodynamic states, and comparing this with the mean-field crosstalk . In detail, we first picked binding sites (to regulate genes) randomly from the sequence space and held this choice fixed. Now, for each , we performed different selections of out of genes. For each such selection, after computing the binding site mismatches and occupancies, we compute the crosstalk. To get the mean crosstalk for , we perform a Monte Carlo estimate of the mean crosstalk over these different selections of out of genes. Figures S12 and S13 show that the mean-field crosstalk systematically over-estimates the actual crosstalk, but nevertheless remains a very good approximation to the true crosstalk.
3 Mixed models
In the baseline model we consider genes, all of which are regulated either solely by activators or solely by repressors. Here, we consider mixed models, i.e., models that utilize repression to control one subset of genes and activation to control the other genes. Let’s assume that genes are regulated by activators and genes are regulated by repressors, where . In a particular environment, let’s assume that genes need to be ON. Out of these, let’s assume that genes are activator-regulated and genes are repressor-regulated, where . For activating genes, the number of TFs present now amounts to : activators and repressors. As before, is the similarity of the binding sites and the total concentration of TFs (activators+repressors). The concentration of a particular TF type, when present, will now be . We assume that any non-cognate interaction (“activation out-of-context” or “repression out-of context”) counts as a crosstalk error. We distinguish 4 types of per-gene crosstalk errors:
An activator-regulated gene that needs to be ON, should be bound by the cognate activator. The unbound state and any non-cognate binding (non-cognate activator or repressor) are crosstalk states:
| (S34) |
An activator-regulated gene that needs to be OFF, should be unbound. Any non-cognate binding is a crosstalk state:
| (S35) |
A repressor-regulated gene that needs to be ON, should be unbound. Any non-cognate binding is a crosstalk state:
| (S36) |
Lastly, a repressor-regulated gene that needs to be OFF, should be bound by the cognate repressor. The unbound state and any non-cognate binding (non-cognate repressor or activator) are crosstalk states:
| (S37) |
As and , the overall crosstalk error reads
| (S38) |
Hence, given a set of of the mixed model, crosstalk is same as that in an equivalent baseline activator model with and .
For a given , different (,) partitions are possible, which differ in the number of genes under activator or repressor control. This can be tuned on an evolutionary timescale. Once is chosen, different selections of genes that should be active potentially have different numbers of genes under the control of activators and repressors . However, the optimal TF concentration and the minimal crosstalk only depend on the total number of TFs .
For given , and , we find the best possible , which minimizes the crosstalk. For a particular , we define the optimal crosstalk as the average optimal mixed crosstalk for all selections of genes out of (averaged over different choices of ),
| (S39) |
where is the fraction of gene selections that have activated genes. We have
| (S40) |
| (S41) |
| (S42) |
where is the value which minimizes crosstalk for a given . In Fig. S14, we see that for , the best strategy is to use all activators (), and for , the best strategy is to use all repressors; optimization of crosstalk in mixed models therefore always picks out one of the two “pure” regulatory strategies and does not yield an optimal mixed model.
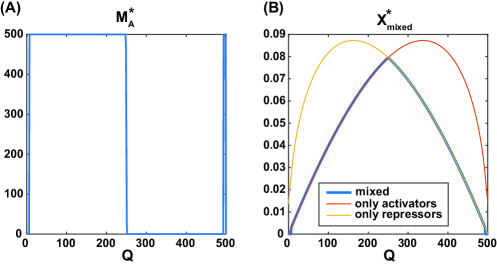
To see if the pure strategies get chosen because the activation of all genes is symmetric in all environments, we studied a simple system in which different subsets of genes are required to be activated with different probabilities. So far, when genes are required to be ON, each gene had the same probability, , to be among the out of required genes, i.e. is the probability of each gene to be activated.
Here, we introduce two classes of genes, with genes in the first class and genes in the second class. Genes in each of the two classes have different probabilities of requiring activation across environments: for the first class and for the second class. If , then genes in class are called “hot” genes, and if , genes in class are called “cold” genes. Given certain , and , different environments correspond to different choices of the genes that should be active, where is no longer constant as before, but a random variable with mean
In a similar fashion as before, we compute the crosstalk (at optimal ) for different choices of mixed models (how many class genes are under activators or repressors). Then, we obtain the optimal (,) strategy among these mixed models that minimizes crosstalk. In Fig. S15, we show how this optimal strategy varies, along with , as a function of and for a fixed choice of . First, we note that increases in any direction that increases or . In the symmetric mixed model setup, we essentially studied the system along the diagonal from to on the plane (dashed white line), increasing from to . The previously studied results yielded two “pure” strategies—all activators or all repressors, depending on whether is bigger or smaller than —which is consistent with the following observations in the asymmetric mixed models. When and (all genes are cold), the optimal strategy is a pure one, namely, to put all genes under activators; when and (all genes are hot), the optimal strategy is to put all genes under repressors, which is also a pure strategy. But when or (one class is hot, while the other is cold), the optimal strategy is “mixed”: put hot genes under repressors and cold genes under activators. Note that not all are possible with these optimal mixed strategies. From here onwards, we study mixed models in the bottom right square of Fig. S15, where and , i.e., class is hot and class is cold.
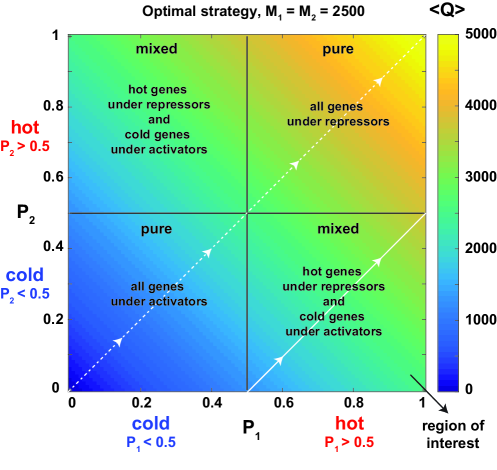
At fixed and , crosstalk gains from using the optimal mixed strategy (instead of using all activators) increase with both and the number of hot genes , as shown in Fig. S16.
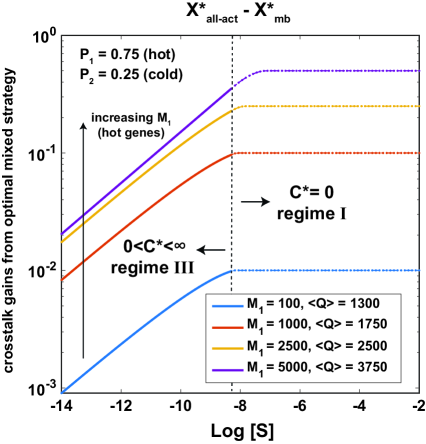
In Fig. S17, we show in detail the crosstalk gains from using the optimal mixed strategy instead of the optimal pure strategy (either all activators or all repressors), for different and , for four different and .
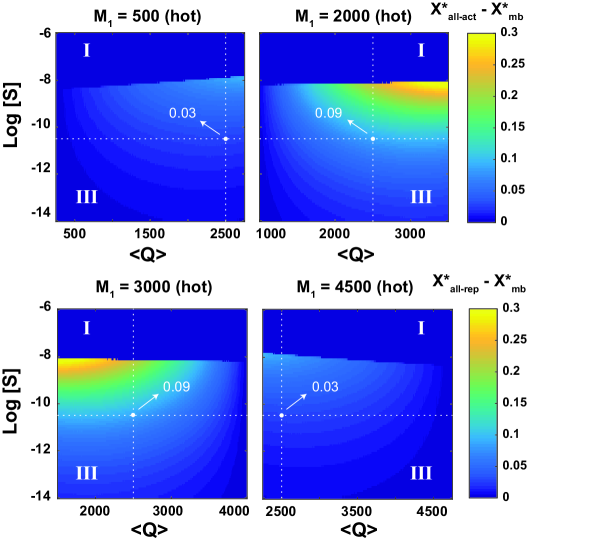
4 Alternative crosstalk definition
In the basic setup presented in the main text, we considered “activation out-of-context”—i.e., activation by the binding of a noncognate TF when the cognate TF is present (but not bound)—to be a crosstalk state. Our reasoning was motivated by viewing transcriptional regulation as a signal transmission apparatus. In this interpretation, gene activation by a noncognate TF amounts to generating a response (transcriptional activity) to a wrong input signal. Consequently, this should count as crosstalk, despite the fact that (by chance) the correct signal was simultaneously present in the cell. This is perhaps easiest to appreciate if one considers more realistic setups in which genes are not simply “ON” and “OFF”, but can be quantitatively regulated by the level of their cognate TF. In such a model, there might be two TFs present and varying in concentration as a function of time: one cognate for the gene of interest and one not. In this case it is clear that the correct response of the gene is to track the changes in the cognate TF, and not to simply be expressed in a constant “ON” state; consequently, tracking the noncognate TF due to crosstalk is obviously an error, even if the cognate TF is present at the same time.
One could, however, argue that “activation-out-of-context” shouldn’t be considered as an error state. If the presence or absence of TF signals is a binary variable and if the binary response is defined solely by the state of transcriptional activity (activation/inactivation of gene), then when the presence of the signal matches the response state, the regulation outcome is correct, irrespective of the molecular details on the promoter. For example, for a gene whose cognate TF is present, activation by any means (either by cognate or noncognate binding) is the correct response. In this scenario, the ”out-of-context activation” is actually what one might call beneficial crosstalk: here, noncognate TF can be seen as helping to activate the gene when the cognate TF is also present. For a gene whose cognate TF is absent, activation is still an incorrect response, like before.
Hence, retains the same expression, but changes to
| (S43) |
As shown in Fig. 4, optimizing results in three distinct regulatory regimes, like in the default basic setup. For small in the regulation regime, the optimal is given to the leading order by:
| (S44) |
The minimal crosstalk error at the optimal concentration is given by
| (S45) |
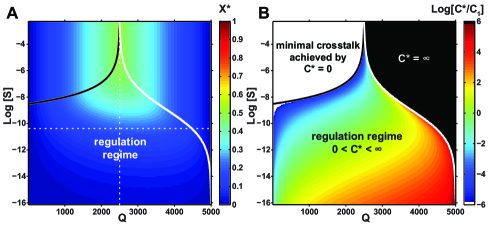
5 Estimating the binding site similarity,
5.1 Optimal packing
In real organisms, binding site sequences for different genes could depart from a random distribution (even after taking into account the statistical structure of the genomic background). For example, to achieve high specificity of regulation, we could hypothesize that binding site sequences evolved to minimize the overlap between any pair of consensus sequences. To explore the crosstalk limit under such optimal use of sequence space and contrast it with the random choice of binding sites, we synthetically constructed binding site sequences that are as distinct as possible. Specifically, our optimal codes are described by a parameter , which is the minimum required number of basepair differences between any pair of binding site sequences. This is the Hamming distance, , between sequences. The problem of choosing sequences of length such that each pair differs by at least is not tractably solvable in general. We construct numerical approximations to these optimal codes using the following algorithm:
-
1.
Generate all possible sequences of length and store them in a list called . Create an empty list, called , which will store the binding site sequences.
-
2.
Pick the first entry, , from the list , to be a binding site sequence, and append it to the list .
-
3.
Erase and all of its Hamming neighbours at distance strictly less than from the list .
-
4.
If the list is not empty, repeat from step . If the list is empty, stop.
When the procedure terminates, the list will contain binding site sequences that are separated by at least mismatches. The outcome of this procedure depends on the initial ordering of the list of all possible sequences. The procedure is not guaranteed to generate the maximal set of sequences satisfying the Hamming distance criteria. From the list of generated binding site sequences, we obtain , the distribution of mismatch distances between all pairs of binding sites, and hence obtain the value of as
| (S46) |
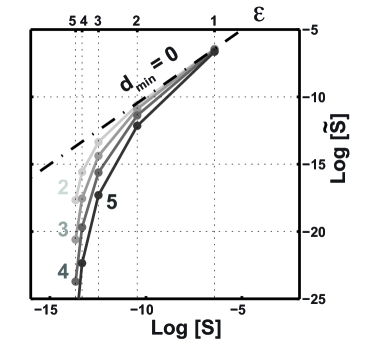
corresponds to the ”random code” and results in . Note that increasing decreases the maximum possible as sequences move further apart in sequence space whose size is fixed. A well-known upper bound on the number of sequences satisfying the Hamming distance criterion is the Singleton bound [65]: . As shown in Fig. 5.2, with and , we already have . With and , we have . As becomes smaller, the possible range of also decreases. This suggests that prokaryotes are capable of having optimally packed binding site sequences, because they typically have and . On the other hand, eukaryotes have smaller and larger and might not have enough sequence space to pack it optimally.
5.2 Reverse complemented sequences
We have also considered a different definition of distance between sequences that takes the double-stranded nature of DNA into account. This brings into picture the reverse complement of both sequences in question. If and are two sequences with reverse complements and respectively, this new definition of Hamming distance is
| (S47) |
where is the usual Hamming distance as considered previously. This restricts the sequence space much more than with the usual definition and as such, as seen in Fig. 5.2, we can pack fewer binding sites in the sequence space at a specific . Given that there are enough sequences under measure in the sequence space, we can also ask how changes in relative to the random code. Intuitively, should increase since each binding site sequence also contributes its reverse complement into the pool of sequences to which TFs can bind non-cognately. Indeed, Fig. 5.2, which maps from the reverse complement code to from a random code, shows that increases by about a factor of due to the addition of reverse-complemented sites.
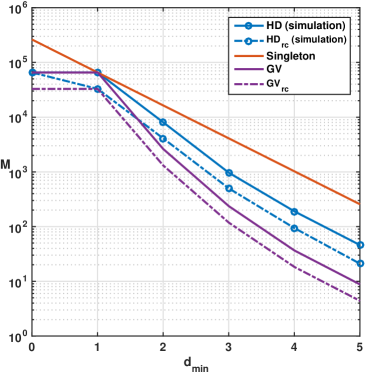
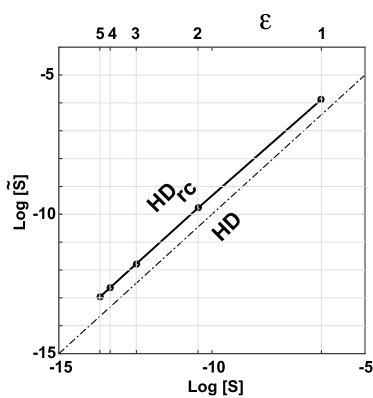
5.3 Saturating model of TF-DNA binding energy
It has been experimentally observed that the binding energy between TF and DNA saturates to some nonspecific value after a certain number of mismatches between the TF’s cognate sequence and the DNA sequence in question [16]. We consider such a saturating energy model, characterized by a parameter , the number of mismatches after which binding energy saturates. The binding energy is given by . We obtain as
| (S48) |
where is the distribution of mismatch distances between all pairs of binding sites picked at random from the sequence space. corresponds to a mismatch model with non-saturating energy. Decreasing limits the specificity of the TF towards binding site sequences far away from the consensus and thereby increases .
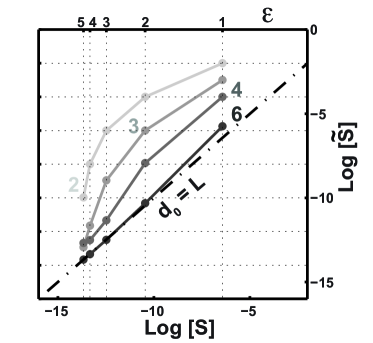
5.4 Empirical values
We obtain organism-specific estimates of from known databases [66, 67, 68] of the binding site sequences of different TFs. In the main text, for a particular genome, we defined for a collection of TFs with the same mismatch penalty and binding sites of a specific constant length . In real organisms, different TFs have different and , making it difficult to directly calculate for a genome. Instead we obtain a value of for each TF by defining it as the value of of a hypothetical genome in which all TFs have the same binding site properties as our TF. Hence, for each organism, we obtain a set of values.
Many databases document the binding site sequences of TFs in Position Count Matrices (PCMs). The PCM of a TF with a binding site of length is a matrix with denoting the number of known TF binding site sequences that have nucleotide in position . One can obtain estimates of and from , and use them to calculate . There are two broad ways to estimate and (and hence, ) of a TF: (a) Information method, (b) Pseudo-count method. In (a), we calculate the information contained in the whole binding site motif and obtain an that distributes this information uniformly among all sites in an equivalent ”effective” motif that has the same length as the original, but only has or mismatch energy values. In (b), we obtain for all entries of the PCM and calculate an average from these entries. To handle zeros in the PCM which lead to undefined , (b) uses an arbitrary pseudo-count. Method (a) can, in contrast, avoid the use of pseudo-counts and, additionally, reproduces by construction the information content of each known motif, which is the key statistical property of TF specificity [14, 69]. Hence, we used (a) to infer values. In both the methods, we used PCMs that have that have been constructed from at least distinct binding site sequences.
5.4.1 Information method
In this method, we first obtain the binding site length and also the total information , contained in the binding site sequences of the TF.
| (S49) |
where is the information contained in position , is the frequency of nucleotide in position , obtained in a straightforward way from , and is the expected background frequency. To get rid of non-specific positions, we neglect all positions that contain information less than a certain threshold ( bits for position to be considered part of the binding site). For a random genome, , resulting in
| (S50) |
The maximum information in the motif is bits (when ) with each position contributing a maximum of bits, which for finite , is reduced by an entropy term. Obtaining information per position , we infer an that uniformly distributes the information in the motif among individual positions. At a specific position , without loss of generality, assume that has the best binding energy . The probability of observing at is given by while the probability of observing any of the three other possible nucleotides is given by , with [42]. Hence,
| (S51) | |||||
| (S52) | |||||
| (S53) |
The mismatch energy can be obtained from the above expression, and from and , we obtain .
5.4.2 Pseudo-count method
In this method, we infer for all three non-cognate nucleotides in each position, and obtain for the TF as an average of these values. For an arbitrary position , as before, assume that has the maximum counts . We obtain and mismatch penalty for position as . If some entry , is undefined. To take care of this, we first add a pseudocount to all entries of and obtain a modified PCM to infer . The value of chosen is arbitrary and it is common practice to use or . As before, to get rid of non-specific positions, we consider positions that have . From the remaining, we take a mean to obtain , and finally obtain .
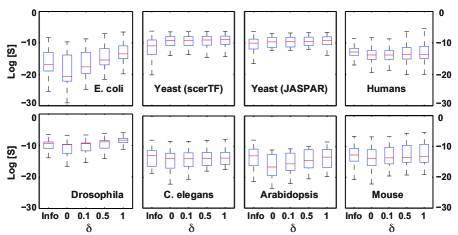
6 Cooperative regulation
So far, we assumed a single binding site for every gene. Yet, some genes employ combinatorial regulation, with several binding sites regulated by a number of transcription factors. As a next step in extending our model we consider cooperative regulation, where every gene has two binding sites that are bound by two copies of the same type of transcription factor.
We assume 2 binding sites per gene, with energy gap between cognate-bound and unbound states. An additional energy contribution is obtained if both sites are bound by cognate factors, which then interact with each other. We consider also the configuration that two noncognate factors of the same type bind to the double binding sites and interact with each other as well. In the limit that once one of the sites is bound, the binding of the other becomes energetically favorable. This cooperative binding energy only applies for two molecules of the same type. Thus, if one site is bound by the cognate and the other by a noncognate molecule, cooperative interaction doesn’t apply. We assume that only binding of one of the two sites induces transcription. The reasoning for this assumption is that for many bacterial and yeast genes activators are thought to work by recruiting the transcriptional machinery to the DNA [70]. Following this rationale, only one of the two sites is in the correct physical location (in bacteria, the proximal one) to do so successfully. Technically, if we assume that only one of the two sites determines transcription, for , the cooperativity case reduces back to the basic model (Section 1). We list the possible binding configurations of the two sites, their energies and statistical weight in Table 4.
| configuration | activity | crosstalk | crosstalk | strong | Energy | Weight | |
|---|---|---|---|---|---|---|---|
| if ON | if OFF | cooperativity | |||||
| 1 | CC | ON | - | + | 0 | ||
| 2 | UC | ON | - | ||||
| 3 | NC | ON | - | ||||
| 4 | UU | OFF | + | - | + | ||
| 5 | CU | OFF | + | - | |||
| 6 | NU | OFF | + | - | |||
| 7 | UN | * | + | + | |||
| 8 | CN | * | + | ||||
| 9 | * | + | + | ||||
| 10 | * | + | + | + |
The general case of this model, incorporating all possible binding configurations yields a 6th order equation in the TF concentration , which we only handle numerically. The following limiting cases are however analytically solvable:
-
1.
Limit of strong cooperativity: Assume that the cooperative interaction is strong compared to the individual protein-DNA binding energies . We can then neglect binding configurations in which only one of the sites is bound and the other is vacant, and the ones in which both are bound, but by molecules that do not interact cooperatively. That leaves us with only 3 possible binding configurations: both sites unbound, both bound by cognate TF or both bound by noncognate TF molecules of the same type with cooperative interaction (configurations 1,4 and 10 in Table 4). By proper change of variables this case can be reduced back to the basic single-binding-site model. The minimal crosstalk then reads:
(S54) where . This error is achievable with TF concentration
(S55) Since the cooperative binding model allows for a binding site which is twice as long and higher total binding energy the parameters need to be correctly transformed to compare to the 1-site model. If we transform: we obtain exactly the same minimal error as in the single-site model. By proper transformation of the energy of the unbound state the TF concentration that minimizes the error is a square root of the one we had in the single-site model Eq. (S11). In similarity with the basic single-site model, here too we obtain different parameter regimes, whereas For the minimal error is obtained by taking , namely regulation is not advantageous. While seemingly the cooperative binding is equivalent to a 1-site model which has twice as long binding site, this is not accurate. The reason is that cooperative interaction occurs only between two specific molecules, which limits the possible sequence space.
-
2.
Limit of weak cooperativity: If , the problem reduces to the basic single-site model.
6.1 Cooperativity with interactions between noncognate pairs
In Fig. 4 of the main text we neglected the possibility of cooperative interaction between pairs of noncognate molecules at the binding site of interest. This situation is plausible if the interaction between the molecules is facilitated by the specific binding sites. However, the molecules can also cooperatively interact in solution before binding and then bind a noncognate site as a complex. This possibility was not taken into account in Fig. 4 (main text). In the following we repeat the calculation including this interaction too (state no. 10 in Table 4). The results are illustrated in Fig S24. Evidently, the improvement in crosstalk owing to cooperativity is now significantly smaller.
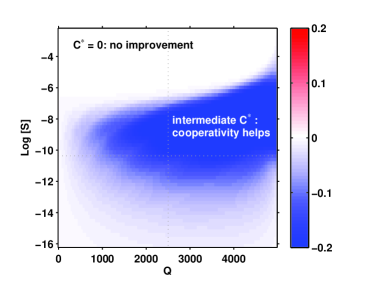
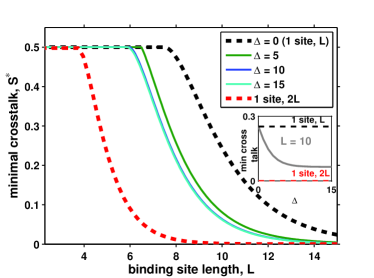
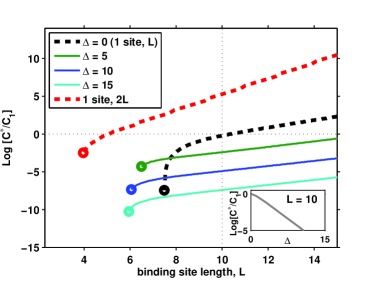
7 Combinatorial regulation (AND gate)
So far, we have been dealing with models in which each gene is regulated by a single type of TF, be it by a single activator, a single repressor, or multiple TFs of the same type using cooperative interactions. Here, we will consider a simple model of combinatorial regulation by a combination of two activators of different types, and compute optimal crosstalk for this setup as a function of parameters of interest.
As before, we have genes in total, with each gene having two binding sites, corresponding to two different (cognate) TF types. For a particular gene to be ON, we need the presence of both cognate TF types, which need to occupy both binding sites. This regulatory architecture corresponds to an AND gate. We don’t specify how this AND gate is implemented on the molecular level. Unlike in cooperative regulation, no additional energy gain is assumed here due to the interaction between the two TFs when bound to the DNA.
Each TF can pair with various other TFs in regulating a particular gene. In the basic activation setup, the total number of TFs, , was equal to the total number of genes. In the combinatorial regulation setup, which is an extension of the basic activation setup, the total number of genes will be equal to the total number of different TF-TF combinations that can exist. This will depend on the extent of combinatorial regulation, which we quantify using , the fraction of TF-TF combinations each TF type realizes out of the theoretically maximal number of pairwise combinations it could have.
If there are TFs in total, each TF can potentially pair with other TF types, where is the fraction of pairs each TF type realizes. This gives us , and thus and . But each TF should pair with at least one other TF, so we require 1. Taking both of these limits into account, we have, for , the number of TFs each TF pairs with, and the number of total TFs ,
| (S56) | |||
| (S57) |
If each TF pairs with all other TFs, we have and , which gives us . We call this “perfect combinatorial regulation” because it minimizes the number of TFs needed to regulate a certain number of genes.
If each TF realizes only a fraction of its combinations, we have pairs for each TF, which gives us . We call this “imperfect combinatorial regulation”.
If , we have , which gives us . We call this “worst combinatorial regulation”.
As before, we will compute the optimal crosstalk when genes are required to be ON. Here, we compute the “typical” number of TFs present at any one time, , by following a similar recipe as before. We have , where is the number of pairs per TF present at any one time. This will be smaller as there are fewer TFs present at any given time relative to the total number of TF types, i.e., . As before, we have
| (S58) | |||
| (S59) |
When , we have and when , we have .
| crosstalk if gene needs to be | ||||||||
| configuration | activity | ON | OFF, C can be | Energy | Weight | |||
| (XY) | X | Y | none | |||||
| 1 | CC | ON | - | 0 | ||||
| 2 | UC | OFF | + | - | ||||
| 3 | NC | ON | + | + | ||||
| 4 | CU | OFF | + | - | ||||
| 5 | CN | ON | + | + | ||||
| 6 | UU | OFF | + | - | - | - | ||
| 7 | UN | OFF | + | - | - | - | ||
| 8 | NU | OFF | + | - | - | - | ||
| 9 | ON | + | + | + | + | |||
| 10 | ON | + | + | + | + | |||
Unlike in the basic activation setup, genes that are required to be ON have two cognate TFs present, but genes that are required to be OFF have either none of the cognate types present, or one (but not both) of TF types present. As calculated above, we have TFs and each TF has combinations, while the total number of combinations it can have are ; each TF that is present therefore has missing combinations. The number of genes (that should be OFF) which have only one TF present can be obtained as
| (S60) |
The number of genes with no cognate TFs present is . In Table 5, we have listed all possible configurations for the two binding sites of a gene, along with details of crosstalk states and statistical weights. From this, we get the per-gene crosstalk for different types of genes. For genes that have both cognate TFs present ( out of ), the per-gene crosstalk error is
| (S61) |
For genes that have only one of the two cognate TFs present ( out of genes), the per-gene crosstalk error is
| (S62) |
For genes that don’t have any of their two cognate TFs present ( out of genes), the per-gene crosstalk error is
| (S63) |
The total crosstalk is:
| (S64) |
For a given and and for each pair, we compute the optimal concentration numerically, and obtain the minimal crosstalk .
As plotted in Fig. S25, the boundaries between different regimes shift in the combinatorial setup. In particular, while at small the ”regulation regime” shrinks in the plane, as increases, it expands. As increases towards , the boundary between the ”regulation regime” and ”” regime moves towards larger . In Fig. S26, we have plotted the difference in optimal crosstalk between combinatorial regulation and the basic activation setup. For , combinatorial regulation doesn’t improve from the basic activation setup in terms of optimal crosstalk. But for and , combinatorial regulation gives a lower optimal crosstalk than the basic activation setup. So, there exists a threshold in such that for combinatorial regulation below that threshold, the ”regulation regime” shrinks in comparison to the basic activation setup and performs worse. Above the threshold, the ”regulation regime” expands towards larger and gives a lower optimal crosstalk than the basic activation setup. At the baseline parameters of and , optimal crosstalk for the combinatorial setups reads as and for and respectively, compared to for the basic activation setup.
This decrease in crosstalk is consistent with the reduction in the number of regulatory components ( and , the number of TFs, see Fig. S27), as discussed in SI Section 1.5. In the case of perfect combinatorial regulation (), we have roughly instead of TF species in the basic activation setup, which is a significant reduction in the number of regulatory components. Hence, each TF now effectively controls genes, and so the decrease in crosstalk is expected to be roughly compared to the basic activation setup. For genes, this would suggest that perfect combinatorial regulation could decrease the crosstalk by -fold over the basic model. The actual reduction in crosstalk (from 0.23 to 0.07) isn’t as large because of certain differences between the combinatorial setup and -genes setup of SI Section 1.5. One major difference is that in the -genes setup, the cell can only activate sets of genes of size , while in the combinatorial setup, the cell has the power to activate single genes at will, albeit at the cost of partially activating genes that aren’t needed (since a considerable fraction of genes that should be OFF must have one of the two activators present) and allowing new non-cognate configurations. Fundamentally, therefore, crosstalk reduction comes from the decrease in the number of regulatory components (TF species) needed in the system, which again points to the explosion in the number of possible noncognate interactions as the crucial origin of the crosstalk. In other words, what qualitatively seems to matter is , the number of regulated genes per TF, while the detailed manner in which these TFs regulate is less important for the actual numerical value of crosstalk (but is important for the functioning of the cell; e.g., in combinatorial regulation genes can be addressed individually, while in the model of SI Section 1.5 they cannot be).
We also note that while near-ideal combinatorial regulation appears to be a useful strategy to reduce the crosstalk, studies of scaling laws in gene regulatory networks do not appear to be consistent with the use of such a pure combinatorial strategy. In particular, the number of TFs scales at least linearly (quadratically, in prokaryotes) with the total number of genes [47] across different organisms, while an efficient combinatorial strategy would suggest sub-linear (e.g., square-root) scaling. This clearly does not preclude the use of combinatorial regulation in some regulatory elements, but does show that even with the possible utilization of the combinatorial strategy the observed growth in the number of distinct TF species (which seems to be an important crosstalk parameter) is extensive.
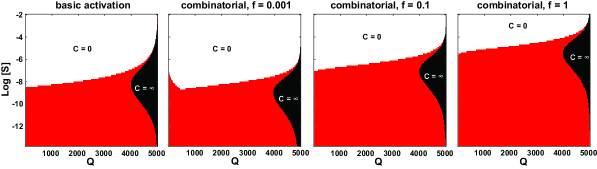
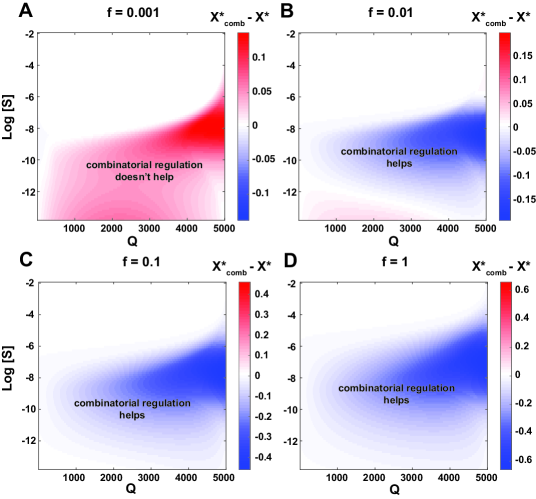
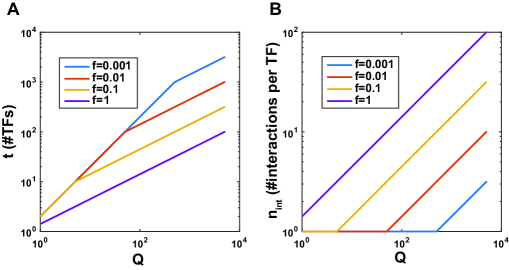
8 Weak global repressor
So far we only considered gene regulation by activators. Cells however also have repression mechanisms as an additional means of regulation. As a first step to account for that we incorporate in the model one type of an abundant weak global repressor that interacts with all binding sites with sequence-independent low affinity. Non-specific repression mechanisms such as the nuclear envelope, histones and DNA methylation are thought to mitigate spurious transcription [25]. It was hypothesized that their emergence enabled the genome expansion in the transitions between prokaryotes to eukaryotes and from invertebrates to vertebrates [25]. We include an additional molecule in the model, which is found in concentration and can bind all binding sites equally well with energy , namely it is more favorable than the unbound state, but not as favorable as the specific cognate activator of each site. Hence, our intuition was that such a global repressor cannot compete equally with specific binding, but it can reduce non-specific binding. The crosstalk expressions now read:
| (S65) |
| (S66) |
As before, we minimize the crosstalk with respect to the TF concentration. The optimal concentration is now:
| (S67) |
This is the same optimal concentration as in Eq. (S11) only scaled by a factor , instead of there. We conclude that the mere effect of a global repressor is to scale down the concentration of the specific activator. This is simply compensated for by a larger concentration of the activator. Hence, regardless of the global repressor affinity and concentration this additional regulatory mechanism cannot lower the crosstalk beyond what is possible with specific activators only. As before, the minimal crosstalk is:
| (S68) |
9 Regulation by a combination of specific activators and specific repressors
As the global repressor examined in the previous section did not show any additional improvement in crosstalk, we elaborate the model further to account for specific repressors, in similarity to the specific activators. We extended the basic model (Section 1) in which a gene had a single regulatory site and was regulated by an activator alone, to a more general model in which each gene has two regulatory sites: one compatible with a specific activator binding and the other with a specific repressor. We assume that each gene has a unique activator and unique repressor. In the basic model (Section 1), for a gene to be silent its binding site should be vacant. The only way to achieve this was to lower the activator concentration. On the other hand, to improve activation reliability, the activator concentration, should be increased! Thus, in the simple model there seemed to be a trade-off between reliable activation and elimination of undesirable activation. The existence of a specific molecule that blocks the site from binding of other (potentially activating) molecules is thought to be a more reliable way to prevent undesired gene activation, not at the expense of the activation of other genes [58].
To be consistent with the basic model, we assume that the total concentration of all TFs (activators and repressors together) is constant . As before, genes need to be activated for which specific activators are present. The other genes need to be silent for which we now add their specific repressors. All activators are found in equal concentrations each. All repressors are in equal concentrations each. We allow for different binding energies for the two binding sites and . We assume that activation can only occur by binding of an activator molecule to the ’A’ site. Repression is asymmetric in the sense that binding of any molecule to the repressor site prevents binding regardless of what is bound to the activator site. Thus a gene can only be active if the repressor site is empty and the activator site is bound by an activator. See the list of all possible states of the two binding sites in Tables 6 and 7 below.
| configuration | activity | crosstalk | Energy | Weight | |
| (R-site,A-site) | if ON | ||||
| 1 | U, U | OFF | + | ||
| 2 | U, | ON | - | ||
| 3 | U, | * | + | ||
| 4 | U, | OFF | + | ||
| 5 | , U | OFF | + | ||
| 6 | , U | OFF | + | ||
| 7 | , U | OFF | + | ||
| 8 | (, ), | OFF | + | ||
| 9 | , | OFF | + | ||
| 10 | , | OFF | + | ||
| 11 | (, ), | OFF | + | ||
| 12 | (, , ), | OFF | + |
| configuration | activity | crosstalk | Energy | Weight | |
| (R-site,A-site) | if OFF | ||||
| 1 | U, U | OFF | - | ||
| 2 | , U | OFF | - | ||
| 3 | , U | OFF | - | ||
| 4 | , U | OFF | - | ||
| 5 | U, | * | + | ||
| 6 | U, (, ) | OFF | - | ||
| 7 | , ( , ) | OFF | - | ||
| 8 | , ( , ) | OFF | - | ||
| 9 | , ( ) | OFF | - | ||
| 10 | , | OFF | - |
9.1 Overlapping activator and repressor binding sites
For some genes, the regulatory sites of the activator and repressor partially overlap. Another possibility is ”negative cooperativity” - when one molecule repels the other. The outcome of either option is that either an activator or a repressor could be bound at any given time, but not both of them simultaneously. In Tables 6-7 all the states above the double horizontal line are such that only one site can be bound at any given time (’overlapping sites’). The additional states below the line are only possible if both sites can be bound simultaneously (’non-overlapping sites’). Fig S28 illustrates the dependence of crosstalk on the energy (energy gap between unbound and repressor-bound states) for different values of co-activated genes . Crosstalk is minimized for exactly when , meaning equal number of activated and repressed genes. However, for other values of , is also not significantly different from .
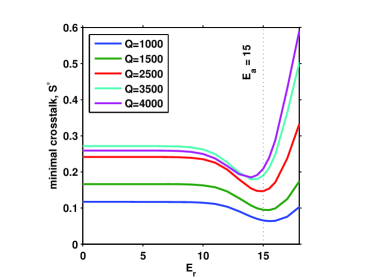
References
- [1] T. Yamane and J. J. Hopfield. Experimental evidence for kinetic proofreading in the aminoacylation of tRNA by synthetase. Proceedings of the National Academy of Sciences, 74(6):2246–2250, June 1977.
- [2] J. J. Hopfield. Kinetic proofreading: a new mechanism for reducing errors in biosynthetic processes requiring high specificity. Proceedings of the National Academy of Sciences, 71(10):4135–4139, October 1974.
- [3] Thierry Mora. Physical limit to concentration sensing amid spurious ligands. arXiv:1504.07203 [physics, q-bio], April 2015. arXiv: 1504.07203.
- [4] Peter S. Swain and Eric D. Siggia. The role of proofreading in signal transduction specificity. Biophysical Journal, 82(6):2928–2933, June 2002.
- [5] Jeffrey M. Skerker, Barrett S. Perchuk, Albert Siryaporn, Emma A. Lubin, Orr Ashenberg, Mark Goulian, and Michael T. Laub. Rewiring the specificity of two-component signal transduction systems. Cell, 133(6):1043–1054, June 2008.
- [6] Margaret E. Johnson and Gerhard Hummer. Nonspecific binding limits the number of proteins in a cell and shapes their interaction networks. Proceedings of the National Academy of Sciences, 108(2):603–608, 2011.
- [7] Jingshan Zhang, Sergei Maslov, and Eugene I. Shakhnovich. Constraints imposed by non-functional protein-protein interactions on gene expression and proteome size. Molecular Systems Biology, 4(1), 2008.
- [8] Thomas Ouldridge and Pieter Rein ten Wolde. The robustness of proofreading to crowding-induced pseudo-processivity in the MAPK pathway. Biophysical Journal, 107(10):2425–2435, November 2014.
- [9] Michael A. Rowland and Eric J. Deeds. Crosstalk and the evolution of specificity in two-component signaling. Proceedings of the National Academy of Sciences, 111(15):5550–5555, April 2014.
- [10] T. W. McKeithan. Kinetic proofreading in T-cell receptor signal transduction. Proceedings of the National Academy of Sciences, 92(11):5042–5046, May 1995.
- [11] Jean-Benoît Lalanne and Paul François. Principles of adaptive sorting revealed by in silico evolution. Physical Review Letters, 110(21):218102, May 2013.
- [12] Arvind Murugan, James Zou, and Michael P. Brenner. Undesired usage and the robust self-assembly of heterogeneous structures. Nature Communications, 6, 2015.
- [13] Peter H. Von Hippel, Arnold Revzin, Carol A. Gross, and Amy C. Wang. Non-specific DNA binding of genome regulating proteins as a biological control mechanism: 1. The lac operon: equilibrium aspects. Proceedings of the National Academy of Sciences, 71(12):4808–4812, 1974.
- [14] Zeba Wunderlich and Leonid A. Mirny. Different gene regulation strategies revealed by analysis of binding motifs. Trends in Genetics, 25(10):434–440, October 2009.
- [15] Jason M. Johnson, Stephen Edwards, Daniel Shoemaker, and Eric E. Schadt. Dark matter in the genome: evidence of widespread transcription detected by microarray tiling experiments. Trends in Genetics, 21(2):93–102, February 2005.
- [16] Sebastian J. Maerkl and Stephen R. Quake. A Systems approach to measuring the binding energy landscapes of transcription factors. Science, 315(5809):233–237, January 2007.
- [17] Sylvie Rockel, Marcel Geertz, Korneel Hens, Bart Deplancke, and Sebastian J. Maerkl. iSLIM: a comprehensive approach to mapping and characterizing gene regulatory networks. Nucleic Acids Research, page gks1323, 2012.
- [18] Anat Burger, Aleksandra M. Walczak, and Peter G. Wolynes. Abduction and asylum in the lives of transcription factors. Proceedings of the National Academy of Sciences, 107(9):4016–4021, March 2010.
- [19] M. Sheinman and Y. Kafri. How does the DNA sequence affect the Hill curve of transcriptional response? Physical Biology, 9(5):056006, October 2012.
- [20] Ulrich Gerland, J. David Moroz, and Terence Hwa. Physical constraints and functional characteristics of transcription factor DNA interaction. Proceedings of the National Academy of Sciences, 99(19):12015–12020, 2002.
- [21] Anirvan M. Sengupta, Marko Djordjevic, and Boris I. Shraiman. Specificity and robustness in transcription control networks. Proceedings of the National Academy of Sciences, 99(4):2072–2077, February 2002.
- [22] Lacramioara Bintu, Nicolas E Buchler, Hernan G Garcia, Ulrich Gerland, Terence Hwa, Jané Kondev, and Rob Phillips. Transcriptional regulation by the numbers: models. Current Opinion in Genetics & Development, 15(2):116–124, April 2005.
- [23] Michael Lynch and Kyle Hagner. Evolutionary meandering of intermolecular interactions along the drift barrier. Proceedings of the National Academy of Sciences, 112(1):E30–E38, January 2015.
- [24] Anne-Laure Todeschini, Adrien Georges, and Reiner A. Veitia. Transcription factors: specific DNA binding and specific gene regulation. Trends in Genetics, 30(6):211–219, 2014.
- [25] Adrian P. Bird. Gene number, noise reduction and biological complexity. Trends in Genetics, 11(3):94–100, March 1995.
- [26] Rob Phillips. Napoleon is in equilibrium. Annual Review of Condensed Matter Physics, 6(1):85–111, 2015.
- [27] G. K. Ackers, A. D. Johnson, and M. A. Shea. Quantitative model for gene regulation by lambda phage repressor. Proceedings of the National Academy of Sciences, 79(4):1129–1133, February 1982.
- [28] Justin B. Kinney, Anand Murugan, Curtis G. Callan, and Edward C. Cox. Using deep sequencing to characterize the biophysical mechanism of a transcriptional regulatory sequence. Proceedings of the National Academy of Sciences, 107(20):9158–9163, May 2010.
- [29] Sarah A. Cepeda-Humerez, Georg Rieckh, and Gašper Tkačik. Stochastic proofreading mechanism alleviates crosstalk in transcriptional regulation. Physical Review Letters, 115(24):248101, December 2015.
- [30] S. Mangan and U. Alon. Structure and function of the feed-forward loop network motif. Proceedings of the National Academy of Sciences, 100(21):11980–11985, October 2003.
- [31] Gašper Tkačik and Aleksandra M. Walczak. Information transmission in genetic regulatory networks: a review. Journal of Physics: Condensed Matter, 23(15):153102, April 2011.
- [32] Julien O. Dubuis, Gašper Tkačik, Eric F. Wieschaus, Thomas Gregor, and William Bialek. Positional information, in bits. Proceedings of the National Academy of Sciences, 110(41):16301–16308, October 2013.
- [33] T. Friedlander and N. Brenner. Adaptive response and enlargement of dynamic range. Mathematical Biosciences and Engineering, 8(2):515–528, 2011.
- [34] T. Friedlander and N. Brenner. Cellular properties and population asymptotics in the population balance equation. Physical Review Letters, 101(1):18104, 2008.
- [35] George von Dassow, Eli Meir, Edwin M. Munro, and Garrett M. Odell. The segment polarity network is a robust developmental module. Nature, 406(6792):188–192, July 2000.
- [36] Joshua L. Payne and Andreas Wagner. The robustness and evolvability of transcription factor binding sites. Science, 343(6173):875–877, February 2014.
- [37] David L. Stern and Virginie Orgogozo. Is genetic evolution predictable? Science, 323(5915):746–751, 2009.
- [38] P. H. Von Hippel and O. G. Berg. On the specificity of DNA-protein interactions. Proceedings of the National Academy of Sciences, 83(6):1608, 1986.
- [39] Xin He, Md. Abul Hassan Samee, Charles Blatti, and Saurabh Sinha. Thermodynamics-based models of transcriptional regulation by enhancers: the roles of synergistic activation, cooperative binding and short-range repression. PLoS Computational Biology, 6(9):e1000935, September 2010.
- [40] Marc S. Sherman and Barak A. Cohen. Thermodynamic state ensemble models of cis-regulation. PLoS Computationl Biology, 8(3):e1002407, March 2012.
- [41] Walid D Fakhouri, Ahmet Ay, Rupinder Sayal, Jacqueline Dresch, Evan Dayringer, and David N Arnosti. Deciphering a transcriptional regulatory code: modeling short-range repression in the Drosophila embryo. Molecular Systems Biology, 6(1), January 2010.
- [42] Otto G. Berg and Peter H. von Hippel. Selection of DNA binding sites by regulatory proteins: Statistical-mechanical theory and application to operators and promoters. Journal of Molecular Biology, 193(4):723–743, February 1987.
- [43] Franz M. Weinert, Robert C. Brewster, Mattias Rydenfelt, Rob Phillips, and Willem K. Kegel. Scaling of gene expression with transcription-factor fugacity. Physical Review Letters, 113(25):258101, December 2014.
- [44] D. Lancet, E. Sadovsky, and E. Seidemann. Probability model for molecular recognition in biological receptor repertoires: significance to the olfactory system. Proceedings of the National Academy of Sciences, 90(8):3715–3719, April 1993.
- [45] Leonid A. Mirny. Nucleosome-mediated cooperativity between transcription factors. Proceedings of the National Academy of Sciences, 107(52):22534–22539, December 2010.
- [46] Felipe Merino, Benjamin Bouvier, and Vlad Cojocaru. Cooperative DNA recognition modulated by an interplay between protein-protein interactions and DNA-mediated allostery. PLoS Computational Biology, 11(6):e1004287, June 2015.
- [47] Erik van Nimwegen. Scaling laws in the functional content of genomes. Trends in Genetics, 19(9):479–484, September 2003.
- [48] S. Maslov, Krishna S., Pang T. Y., and K. Sneppen. Toolbox model of evolution of prokaryotic metabolic networks and their regulation. Proceedings of the National Academy of Sciences, 106(24):9743—9748, 2009.
- [49] Shalev Itzkovitz, Tsvi Tlusty, and Uri Alon. Coding limits on the number of transcription factors. BMC Genomics, 7(1):239, September 2006.
- [50] Richard P. Sear. Highly specific protein-protein interactions, evolution and negative design. Physical Biology, 1(3):166, 2004.
- [51] Richard P. Sear. Specific protein-protein binding in many-component mixtures of proteins. Physical Biology, 1(2):53, 2004.
- [52] Christopher R. Myers. Satisfiability, sequence niches and molecular codes in cellular signalling. IET systems biology, 2(5):304–312, 2008.
- [53] Peter Schuster. Taming combinatorial explosion. Proceedings of the National Academy of Sciences, 97(14):7678–7680, July 2000.
- [54] Andrej Košmrlj, Abhishek K. Jha, Eric S. Huseby, Mehran Kardar, and Arup K. Chakraborty. How the thymus designs antigen-specific and self-tolerant T cell receptor sequences. Proceedings of the National Academy of Sciences, 105(43):16671–16676, October 2008.
- [55] Christopher C. Govern and Pieter Rein ten Wolde. Energy dissipation and noise correlations in biochemical sensing. Physical Review Letters, 113(25):258102, December 2014.
- [56] Monica Skoge, Sahin Naqvi, Yigal Meir, and Ned S. Wingreen. Chemical sensing by nonequilibrium cooperative receptors. Physical Review Letters, 110(24):248102, June 2013.
- [57] Nicolas E. Buchler, Ulrich Gerland, and Terence Hwa. On schemes of combinatorial transcription logic. Proceedings of the National Academy of Sciences, 100(9):5136–5141, April 2003.
- [58] Guy Shinar, Erez Dekel, Tsvi Tlusty, and Uri Alon. Rules for biological regulation based on error minimization. Proceedings of the National Academy of Sciences, 103(11):3999–4004, March 2006.
- [59] Rutger Hermsen, Sander Tans, and Pieter Rein ten Wolde. Transcriptional regulation by competing transcription factor modules. PLoS Computational Biology, 2(12):e164, December 2006.
- [60] Georg Rieckh and Gašper Tkačik. Noise and information transmission in promoters with multiple internal states. Biophysical Journal, 106(5):1194–1204, March 2014.
- [61] Vered Sasson, Irit Shachrai, Anat Bren, Erez Dekel, and Uri Alon. Mode of regulation and the insulation of bacterial gene expression. Molecular Cell, 46(4):399–407, May 2012.
- [62] Michael B. Clark, Paulo P. Amaral, Felix J. Schlesinger, Marcel E. Dinger, Ryan J. Taft, John L. Rinn, Chris P. Ponting, Peter F. Stadler, Kevin V. Morris, Antonin Morillon, Joel S. Rozowsky, Mark B. Gerstein, Claes Wahlestedt, Yoshihide Hayashizaki, Piero Carninci, Thomas R. Gingeras, and John S. Mattick. The reality of pervasive transcription. PLoS Biology, 9(7):e1000625, July 2011.
- [63] Alexander J. Stewart, Sridhar Hannenhalli, and Joshua B. Plotkin. Why transcription factor binding sites are ten nucleotides long. Genetics, 192(3):973–985, November 2012.
- [64] Murat Tuğrul, Tiago Paixão, Nicholas H. Barton, and Gašper Tkačik. Dynamics of transcription factor binding site evolution. PLoS Genetics, 11(11):e1005639, November 2015.
- [65] Error Control Coding. Prentice Hall, Upper Saddle River, N.J, 2 edition edition, June 2004.
- [66] S. Gama-Castro, H. Salgado, M. Peralta-Gil, A. Santos-Zavaleta, L. Muñiz-Rascado, H. Solano-Lira, V. Jimenez-Jacinto, V. Weiss, J. S. García-Sotelo, A. López-Fuentes, et al. RegulonDB version 7.0: transcriptional regulation of Escherichia coli K-12 integrated within genetic sensory response units (Gensor Units). Nucleic Acids Research, 39(suppl 1):D98–D105, 2011.
- [67] Anthony Mathelier, Xiaobei Zhao, Allen W. Zhang, François Parcy, Rebecca Worsley-Hunt, David J. Arenillas, Sorana Buchman, Chih-yu Chen, Alice Chou, Hans Ienasescu, Jonathan Lim, Casper Shyr, Ge Tan, Michelle Zhou, Boris Lenhard, Albin Sandelin, and Wyeth W. Wasserman. JASPAR 2014: an extensively expanded and updated open-access database of transcription factor binding profiles. Nucleic Acids Research, page gkt997, November 2013.
- [68] Aaron T. Spivak and Gary D. Stormo. ScerTF: a comprehensive database of benchmarked position weight matrices for Saccharomyces species. Nucleic Acids Research, 40(D1):D162–D168, January 2012.
- [69] Thomas D. Schneider, Gary D. Stormo, Larry Gold, and Andrzej Ehrenfeucht. Information content of binding sites on nucleotide sequences. Journal of Molecular Biology, 188(3):415–431, April 1986.
- [70] Mark Ptashne and Alexander Gann. Transcriptional activation by recruitment. Nature, 386(6625):569–577, 1997.