Structure of the glass-forming metallic liquids by ab-initio and classical molecular dynamics, a case study: quenching the Cu60Ti20Zr20 alloy
Abstract
We consider the question of the amorphization of metallic alloys by melt quenching, as predicted by molecular dynamics simulations with semi-empirical potentials. The parametrization of the potentials is discussed on the example of the ternary Cu-Ti-Zr transition metals alloy, using as reference the ab-initio simulation. The pair structure in the amorphous state is computed from a potential of the Stillinger Weber form. The transferability of the parameters during the quench is investigated using two parametrizations: from solid state data, as usual, and from a new parametrization on the liquid structure. When the adjustment is made on the pair structure of the liquid, a satisfactory transferability is found between the pure components and their alloys. The liquid structure predicted in this way agrees well with experiment, in contrast with the one obtained using the adjustment on the solid. The final structure, after quenches down to the amorphous state, determined with the new set of parameters is shown to be very close to the ab-initio one, the latter being in excellent agreement with recent X-rays diffraction experiments. The corresponding critical temperature of the glass transition is estimated from the behavior of the heat capacity. Discussion of the consistency between the structures predicted using semi-empirical potentials and ab-initio simulation, and comparison of different experimental data underlines the question of the dependence of the final structure on the thermodynamic path followed to reach the amorphous state.
I Introduction
Since their discovery in the late eighties Inoue et al. (1988), multicomponent bulk metallic glasses (BMG) have been the subject of numerous experimental and theoretical studies. The unique physical, mechanical, and corrosion properties of these novel materials indeed enable a variety of applications Trexler and Thadani (2010); Gong et al. (2013); Niinomi (2003). A particular attention has been paid to the BMGs based on late transition metals, especially in the Cu-based family Inoue et al. (2001); Xu, Duan, and Johnson (2004), including alloys with Zr Das et al. (2005); Venkataraman et al. (2006), Ti Ma et al. (2004), or Al Zhou et al. (2010). These studies have shown that the glass forming ability (GFA) of an alloy and its properties in the amorphous state depend on several factors such as the nature of its components, its composition, or the cooling rate. Simulations are then helpful for a systematic exploration of the parameters space, including domains that are difficult to study experimentally. They are also useful for understanding the underlying physics at an atomic scale. Most often, they consist in classical molecular dynamics (MD) with semi-empirical atomic potentials, such as the embedded atom model (EAM) Daw and Baskes (1984), the tight binding, second moment approximation (TB-SMA) Rosato, Guillope, and Legrand (1989), and Finnis-Sinclair (F-S) potentials Finnis and Sinclair (1984) and their variants. Their parameters are adjusted from available structural and thermodynamic data. EAM potentials for fcc elements are given for example in Ref. Sheng et al., 2011 and n-body potentials for ternary alloys are reviewed in Ref. Li, Dai, and Dai, 2012. For the Cu family see Ref. Fujita et al., 2010 for Cu-Zr-Ag, or Ref. Mendelev et al., 2009 for Cu-Zr alloys. For the latter, the parameters were determined from a combination of ab-initio calculations and experimental data. Other methods, such as the force matching technique in which ab-initio potential energies are used as input, have also been used (see for example Refs. Cheng and Ma, 2008 for the Cu-Zr-Al alloy and Jakse, Nassour, and Pasturel, 2012 for Cu-Zr). Carefully adjusted potentials can then be used for practical applicationsSheng et al. (2011), like searching optimized compositions Li, Dai, and Dai (2012).
The central question in this classical route remains the transferability of the parametrized force fields, to different state points or compositions, for example. The transferability, especially for the n-body potentials has been discussed e.g. in Ref. Alemany et al., 1999 for fcc metals in the liquid phase (TB-SMA), Ref. Noya, Rey, and Gallego, 2002 for Ni-Al (EAM), or Ref. Kart et al., 2004 for liquid Pd-Ni alloys (modified Sutton-Chen Sutton and Chen (1990) potential). Furthermore, the data used for the fits – say the cohesive energy, lattice constants, etc. – are usually relative to the solid phase. It is then not obvious that the same parameters will also describe the properties of liquid and amorphous metals Alemany et al. (1999), which lack the periodicity which is important for the electronic structure of the solid Foiles (1985). In related areas, this question is discussed in Refs. Aguado and Madden, 2004; Tafipolsky and Schmid, 2009, or Harvey, Gheribi, and Chartrand, 2012 for the use of this approach in thermodynamic integration methods.
As an alternative, one may consider first-principles simulations for which the question of transferability does not arise. Their computational cost however makes them often unfeasible without resorting to supercomputers. This holds even with non all-electron ones, which use pseudopotentials and approximate functionals. This includes paths involving a wide range of variation of the parameters, such as in cooling rate studies Cheng, Ma, and Sheng (2009) – see also Refs. Tian et al., 2012, 2011. They are thus used occasionally, say for supplementing the information required to fit the phenomenological potentials Tafipolsky and Schmid (2009); Zope and Mishin (2003); Li et al. (2008); Behler and Parrinello (2007); Eshet et al. (2010). To this end, when the amorphous state is obtained by quenching a liquid, namely through a path between two disordered states, it may be preferable to adjust the parameters on the liquid properties.
Since there is no systematic means to devise the optimum transferability (for alternatives see for example Ref. Tafipolsky and Schmid, 2009), new elements collected in representative cases are useful to ascertain this question. In this work, we shall illustrate this on the example of the ternary Cu60Ti20Zr20 alloy which has been studied recently by experiment (see references in Refs. Inoue et al., 2001; Jiang et al., 2003; Dai et al., 2008a, b; Zhang, Dai, and Xu, 2009; Pauly et al., 2009; Ďurišin et al., 2014) and simulation with parametrized potentials Han and Teichler (2007); Qin and Lai (2011); Senturk Dalgic and Celtek (2011a); Fujii and Tokuyama (2011) for its importance as a model system of transition-metal-based BMGs, and its technological relevance. To our knowledge, this alloy has not been studied from first-principles simulation, in contrast with Cu-based binary alloys (see for example Refs. Jakse and Pasturel, 2008a, b for Cu-Zr). Using molecular dynamics at the Born-Oppenheimer level (BOMD) and density functional theory (DFT)Kohn and Sham (1965), as implemented in the Quantum Espresso (QE) package Giannozzi et al. (2009), we present here such a study intended to highlight some questions raised by the use of locally adjusted atomic potentials in multicomponent glass forming alloys (a recent review of ab-initio molecular dynamics (AIMD) methods applied to glass formation can be found in Ref. Pasturel and Jakse, 2010). This will be done by comparing the pair structure determined from the ab-initio and classical routes, in the liquid and at ambient temperature which is well below the critical temperature of the glass transition of this alloy. By adjustment to the high-temperature structure of the alloy determined from AIMD, a new set of parameters of the effective potential is determined. Their transferability is investigated by comparison with the ab-initio structure at the final temperature. The corresponding critical temperature of the glass transition is estimated from the behavior of the heat capacity. The stability of the structure predicted using the semi-empirical potential with respect to the AIMD simulation is discussed. Comparison with other simulations and available experiments is made to underline the importance of thermodynamic path followed to reach the amorphous state.
This paper is thus organized as follows: in section II, we detail the methodology we use for this purpose. In section III, we present the main results concerning the ab-initio () and classical () radial distribution functions (rdfs) and the estimated glass transition temperature. The system size dependence is finally discussed. We conclude this paper by a summary of the main conclusions.
II Methodology
II.1 General method
The question of transferability is actually independent of the reality of the reference data used to parametrize the potentials. As we could not find experimental data for the pair structure of Cu60Ti20Zr20 at high temperature, we decided to use as “experimental” data the rdfs of the alloy obtained from AIMD in the liquid state. We postpone to the next section the question of its relationship with the actual structure of the liquid alloy. The “classical” rdfs are determined by MD simulation using the simplified (i.e. without 3-body terms) Stillinger-Weber Stillinger and Weber (1985) (SW) potential used by Han and Teichler Han and Teichler (2007):
| (1) |
These simulations will be referred to as -MD. The set of parameters of the SW potential adjusted using data from the solid Han and Teichler (2007) will be designated as and those from the liquid, determined as . The parameters are varied until the pair structure determined with the -MD simulation () agrees reasonably well with the ab-initio one (). Once this is achieved, the alloy is cooled down to K. Starting from the last equilibrated MD configuration so obtained, the AIMD is run at ambient temperature, until satisfactory equilibration is reached. This is followed by a series of accumulation steps for obtaining the statistical averages. A first comparison can thus be made between the two final sets of rdfs at K, and . As a test of the role of the initial configuration, we perform an “instantaneous” quench by using as input at K a configuration equilibrated in (or near) the liquid state. One may then compare the rdf determined with finite and infinite cooling rates (with necessary caution in the latter case). We also used the last configuration obtained with the parametrization. Before presenting these comparisons, we give below some technical details of the classical and ab-initio runs.
II.2 Computational details
II.2.1 Classical MD
The extensive -MD runs were performed using the LAMMPS package Plimpton (1995) in the isobaric NPT ensemble using the Nose-Hoover integration, with a time step ps. Over a total length of about steps, the last were used to compute the averages. All potentials were cut at and finite size effects were investigated by changing the particle number from 260 to 1372. The quenches were performed in the NPT ensemble (at ), either with a stepwise change of temperature or a continuous one. Different cooling rates were considered (besides an instantaneous quench): K s-1 and a 10 times slower one.
II.2.2 Ab-initio MD
The AIMD simulations were run using of the plane-wave self consistent field (PWscf) code in the QE package with no modification other than adding the computation of the six rdfs at regular time intervals (say every twelve hours) to monitor equilibration and production steps directly on the pair structure. The ions dynamics used a time step of a.u. ( ps), the equations of motion being integrated with the Verlet algorithm. Between (pure components) and (ternary alloy) particle numbers were considered, and a simple velocity rescaling method was used to fix the temperature. (N,V,T) simulations were performed, but, to bracket the desired zero pressure, the volume was initially varied starting from the value for an ideal mixture (see below). A series of short runs (about 200-300 steps) with different box sizes were made to monitor the fluctuation of the pressure above and below . Full NPT simulations using the variable cell-shape method implemented in the QE distribution indeed proved too costly on the rather small 24-core machine we used.
The accuracy of the AIMD simulation depends mostly on the quality of the electronic energy computed in the scf cycles. The quality of the exchange-correlation functional used in the DFT treatment of the electronic structure and some parameters such as the number of plane waves used in the expansion of the Kohn-Sham orbitals are known to be important, but they were found not to be critical here (i.e. for the determination of the pair structure). After several trials, an energy cutoff of 30 Ry and a density cutoff of 240 Ry, in the range of the recommended values, were found sufficient to ensure a satisfactory convergence. Ultra-soft (USP) Vanderbilt (1990) pseudopotentials from the QE library 111Cu.pbe-n-van_ak.UPF, Ti.pbe-sp-van_ak.UPF, Zr.pbe-nsp-van.UPF from the QE library. Details on their generation are given in the file headers and accompanying text files., all with the PBE functional of Perdew et al. Perdew, Burke, and Ernzerhof (1996) were used (with valence electrons for Cu,Ti and Zr). While more accurate Kresse (2002) projector augmented-wave (PAW) Kresse and Joubert (1999) pseudopotentials are available, our tests did not indicate a significant effect at the level of the rdfs (see below the discussion for pure Cu). The convergence threshold for the scf cycles was Ry for typical energies of Ry. Due to the large supercell size used (typically 15 Å), calculations were performed at the point only (except for the density of states discussed in section III.3). In these conditions and using standard values (for metals) for the other settings of the PW code, one scf cycle for a total number of 2964 electrons (for 260 atoms) takes on our machine roughly 2300 s.
III Results
III.1 High temperature structure
III.1.1 Liquid copper
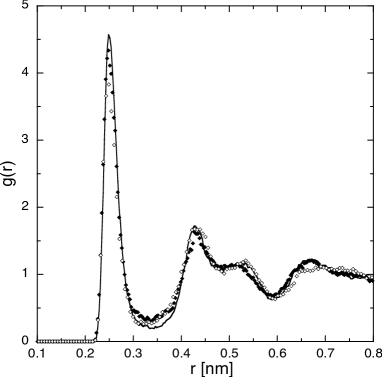
To test various parameters in the AIMD runs, we computed the rdf for pure Cu. particles were placed in a cubic box with a supercell size a.u. to achieve the experimental equilibrium density Å-3 at atmospheric pressure Waseda (1980). was computed in the liquid at K to allow comparison with the AIMD of Ganesh and Widom Ganesh and Widom (2006) (PAW pseudopotentials) and the experimental data of Ref. Waseda, 1980. The AIMD parameters are those indicated above. The result is shown in figure (1).

Symbols: experimental X-ray diffraction data Waseda (1980) interpolated to 1623 K. Full line: simulation of Ref. Ganesh and Widom, 2006 (PAW). Dots: this work (USP).
To test the sensitivity to the pseudopotential, both USP and PAW ones were used. The value of the pressure is actually sensitive to the pseudopotential, but the difference between USP and PAW pseudopotentials (a few kilobars here) has a negligible effect on the equilibrium density and hence on the rdf. With the USP, the peak is higher by two percents but the oscillations are of similar quality as those with the PAW potentials. The similar agreement between USP and PAW calculations with experiment led us to use the USP since the scf cycles are then less time-consuming. Computing an accurate rdf for Cu has actually no novelty per se since this can be achieved using a much faster parametrized version of the generalized pseudopotential theory for the noble metals, as known since the mid-eighties Regnaut, Fusco, and Badiali (1985). This calculation was only intended to check various parameters in the scf cycles, besides giving an indication of the expected structure in the alloy. A previous study by Jakse and Pasturel Jakse and Pasturel (2008a, b) indeed showed a relative insensitivity of the ab-initio Cu-Cu rdf (at least in the first peak) to copper concentration in the binary CuxZr1-x alloys. We could not find a similar study for Cu-Ti but the data in Refs. Ristić et al., 2014 and Senturk Dalgic and Celtek, 2011b do not indicate qualitative effects of alloying with Ti. The important point then is that since Cu is the majority component in Cu60Ti20Zr20, the rdf of Cu should be similar in the alloy and in the pure component, which is very well described by AIMD. This is also a good indication that the structure determined from the simulation of a small periodic system is representative of the one in the true alloy, as discussed later.
III.1.2 Liquid alloy
The partial rdfs of Cu60Ti20Zr20 at 1600 K determined from the AIMD with ultra-soft pseudopotentials are shown in figure (2). They were obtained with particles ( atoms for Cu, Ti, and Zr respectively) to keep the CPU time in a tolerable range. The system was initially prepared as follows: an initial density was computed from the known experimental densities of the pure liquid components, assuming an ideal mixture behavior. This gives Å-3. For the corresponding volume, a cubic box is filled with the particles randomly distributed on the vertices of a cfc lattice (plus a small random displacement), to form the supercell. Its size is then varied about the initial value a.u. to bracket the zero pressure at 1600 K. Within a tolerance of a few kilobars, converged rather rapidly, the final value being a.u. The corresponding volume was then used to continue the AIMD runs in the NVT condition. After about 500 steps to monitor equilibration, 1500 steps of accumulation generate, in about 45 days of computation, reasonably smooth curves for , as well as for the cross ones involving Cu, somewhat less so for the minority species Ti and Zr . Note for the latter a significantly larger effective diameter and a “smoother” , clearly calling for a refined parametrization, possibly with the three-body terms (with the present model, we recently reached a total of 2475 steps which showed no significant effect aside from a progressive smoothing of the data). As a check of equilibrium, we noted that the total energy is very stable, with a very small relative fluctuation and the pressure recorded during the last 839 steps fluctuates about a slightly negative but well-defined average value222See supplemental material at [energy_1600K.pdf] for a plot of the energy and at [pressure_300_1600.pdf] for a plot of the pressure..
The set of parameters was then determined by (hand) adjustment on these ab-initio rdfs, in the liquid ternary alloy. They are given in table I.
| (eV) | (Å) | |||||
|---|---|---|---|---|---|---|
| Cu-Cu | 1.135 (0.485) | 2.290 (2.275) | 1.681 (1.681) | 9 (9) | ||
| Cu-Ti | 1.725 (1.695) | 2.325 (2.300) | 1.805 (1.794) | 7 (7) | ||
| Ti-Ti | 1.364 (1.588) | 2.380 (2.350) | 1.960 (2.056) | 9 (4) | ||
| Cu-Zr | 1.942 (1.943) | 2.450 (2.496) | 1.792 (1.792) | 8 (8) | ||
| Ti-Zr | 1.959 (2.722) | 2.530 (2.481) | 1.900 (1.968) | 7 (3) | ||
| Zr-Zr | 1.695 (3.655) | 2.710 (2.646) | 1.950 (1.855) | 9 (3) |
The corresponding are drawn as lines in figure (2).


Symbols: AIMD; lines: -MD (with parameters as in table I).
It is stressed that this set of parameters is by no means unique. The goal was not to determine the best parametrization but to investigate whether one that gives a reasonably accurate initial structure (in comparison to a given reference) keeps its quality after a quench down to the amorphous state. For this reason, the much longer runs that would have been needed to improve the statistics for the minority species were not attempted. With this caveat in mind, it is clear from the table that the values determined from the adjustment to the liquid structure differ considerably from those of Ref. Han and Teichler, 2007. We note in particular the large difference for the exponent parameters which affect the short-range behavior of such effective potentials (see above the remark for Zr). This is a clear evidence of non-transferability from the solid to the liquid phase.
III.1.3 Transferability of the parametrization at high temperature
The transferability of the parameters in the liquid state was first checked on the pure components. We show in figure (3) the rdfs for the pure components computed with the parameters adjusted on the ab-initio rdfs in the alloy, along with experiment for pure Cu Waseda (1980), Zr Waseda (1980), and Ti Holland-Moritz et al. (2007).

Symbols: experiment (Cu and Zr: Ref. Waseda, 1980, Ti: Ref. Holland-Moritz et al., 2007); full curves: -MD, ; dotted curve: -MD, for Cu; dashed lines: AIMD (from Ref. Jakse and Pasturel, 2003 for Zr at 2500 K).
Similarly to the ab-initio ones, the rdfs for the pure components determined with the parameters adjusted on the alloy are in very good agreement with experiment. On the contrary, with the parameters determined from lattice constants and cohesive energy data as in Ref. Han and Teichler, 2007, differs significantly from experiment (see figure (3) for Cu). The situation is thus different from that of the pure components since it was observed in Ref. Alemany et al., 1999 for example that tight-binding potentials give a reasonable description of the dynamic properties of several liquid metals, in spite of having been parametrized on the basis of solid-state data. Determining fully transferable parameters from the solid to the liquid and vice-versa remains thus an important task in the future.
From the good transferability between the ternary alloy and the pure components, one expects a similar quality of for the binary alloys. This was checked for the Cu-Zr alloy for which data for the pair structure are available. In figure (4) we show the comparison with the ab-initio results of Jakse and Pasturel Jakse and Pasturel (2008a). It clearly confirms the expectation. We did not investigate other binary alloys formed with Cu, Ti and Zr, but we see a priori no reason why the parametrization should then behave differently.

Symbols: AIMD of Ref. Jakse and Pasturel, 2008a. Full lines: -MD, .
A test of different nature is to compare the predicted structure directly with experiment. We did this with the data of Ref. Mizuno et al., 2005 for the Zr70Cu30 alloy at K. This constitutes a severe test since Cu is a minority component for this composition. then has a large contribution from and . The result is shown in figure (5). The agreement between experiment and simulation is quite satisfactory, especially in view of the fact that the adjustment of the parameters for Zr was made with only 52 atoms in the ternary alloy. Our results are comparable to those of the Monte Carlo simulation of Harvey et al. Harvey, Gheribi, and Chartrand (2011) using a modified EAM formalism. Studying, possibly with refined parameters, the amorphous structure of binary Cu-Zr alloys (like the shoulders in the first peak of Georgarakis et al. (2009), its sensitivity to composition Duan et al. (2005), or the effect of the cooling rate Wang et al. (2009)) is left for future work.

Solid circles: experiment Mizuno et al. (2005); full curve: -MD, parameters ; dotted line: same without the volume term in the pressure to test sensitivity to the average density.
To conclude this section, these comparisons with experiments and other simulations show that when the adjustment is made on the structure in the liquid state, the transferability from the alloy to the pure components and the binary alloys is very good. Thus we have the desired starting point for investigating whether it remains so, after a quench down to ambient temperature.
III.2 Amorphous alloy
III.2.1 Structure from classical and AIMD simulations
Using the parameters in table I in the -MD simulation, we perform a quench from K to K, first at the cooling rate of K s-1 used in Ref. Han and Teichler, 2007. The rdfs at the final temperature are shown in figure (6). We first observe the split second peak, typical of the amorphous solid. The first peak is also much higher than in the liquid and also more pronounced than the one predicted with the parameters (figure (6) in Ref. Han and Teichler, 2007).
To test the resulting structure at K, we determined the AIMD starting from the final configuration of the -MD run (below designated as configuration (1)). To reduce CPU time, as indicated, NVT simulation was used, for the average volume of the -MD run at zero pressure. The corresponding cell size is 29.837 a.u. After runs of length similar to the high-temperature ones (about steps), sufficiently smooth curves were obtained. We first observe in figure (6) that the rdfs involving Cu are very close in the ab-initio and classical MD simulations. The larger discrepancy for Ti-Ti and Zr-Zr is mostly a consequence of the smaller statistics in the ab-initio data, obtained with only 52 atoms. This is confirmed by the smooth behavior of the partial rdfs involving Cu in figure, which are averaged over a larger number of pairs.


Symbols: AIMD; full lines : -MD, ; dashed line for Cu: MD simulation Senturk Dalgic and Celtek (2011a) with tight-binding potentials for Cu50Ti25Zr25.
To check equilibration, the pressure was recorded during the last 750 steps. It oscillates about a stable (albeit slightly too high) average value333See supplemental material at [pressure_300_1600.pdf] for the plot of the pressure.. This should not affect much the pair structure, since the amorphous alloy is rather dense at K ( Å-3 to be compared to Å-3 at K). Since the dynamics is particularly slow in the amorphous state, sensitivity to the initial configuration was tested by starting the AIMD run from two other equilibrium configurations : (2) the AIMD one at K, after 2000 steps – this amounts to performing an instantaneous quench (the positions were rescaled by the density ratio ); (3) the -MD one at K, after steps with the parameters . The latter differs from configuration (1) (the one with the parameters ). The results shown in figure (7) indicate that (i) the initial condition plays a role, which is understandable for amorphous states, but the final AIMD rdfs are not strongly affected. (ii) the ab-initio simulation is not frozen in the initial condition as evidenced by the comparison between the final AIMD rdfs at 300 K and those corresponding to the initial conditions: is very different from that in the liquid (configuration (2)), even for a liquid having the density of the amorphous alloy444See supplemental material at [g_Cu_0.066.pdf] for at K and Å-3.; it is also clearly different from that in the amorphous state as predicted by -MD with parameters (configuration (2)) – see also inset in figure (8) for . Another indication is the mean squared displacement. The AIMD value estimated on the (limited) number of available configurations, Å2, is compatible with the one determined by classical MD 555See supplemental material at [MSD_300K.pdf], both being different from the one obtained by classical MD with parameters . This suggests that the latter parametrization leads to a faster dynamics in the frozen state. A larger diffusivity is also clearly evidenced by the behaviour of in the liquid, as determined by classical simulation over a wider time range (the same should hold also in the undercooled states) 666See supplemental material at [MSD_1700K.pdf]..
The behaviors of the AIMD simulation with configurations (2) and (3) are then clearly distinct from the one observed with configuration (1), that leads to the agreement with experiment. While one might naturally fear freezing for relatively short AIMD runs, this dependence on the initial configuration shows that the microstates explored by the AIMD simulation remain close to those of the classical MD only when they correspond to the correct free energy minimum777See supplemental material for a view of the total particle displacements during the AIMD runs: [displacements.png], run starting from configuration (1); [displacements_a^s.png], run starting from configuration (3). See also the snapshot of configuration (1) at [snapshot.png].. This is reassuring in view of the agreement between the classical and ab-initio rdfs in figure (6) when using the parameters .
Full curve: last configuration with ; open diamonds: last configuration with ; solid diamonds: “instantaneous” quench.
Regardless of the connection between the structure predicted by simulation and the one in the macroscopic alloy (see figure (8)), one first important result is thus the good transferability of the potentials from the liquid to the amorphous state.
A second important observation is the noteworthy similarity of the structure predicted for Cu60Ti20Zr20 to that of the Cu50Ti25Zr25 alloy, with similar composition, studied by Senturk Dalgic and Celtek Senturk Dalgic and Celtek (2011a) using TB potentials in the simulation (dashed line in figure (6)). The amorphous state of this alloy was also obtained from a quench of the high-temperature liquid (the predicted densities at 300 K, nm-3 and nm-3, respectively, are close as well). Such consistent predictions for similar systems deduced from different potentials, adjusted on different data, and the fair agreement with the AIMD for Cu60Ti20Zr20 constitute a strong evidence that the predicted structure is the actual one, when the amorphous state is reached through a rapid quench from the liquid.
This is confirmed by comparison with experiment in figure (8). The agreement between simulation and the recent X-rays diffraction data of Ďurišin et al. Ďurišin et al. (2014) is nearly perfect. This is quite remarkable, considering the absence of adjustable parameters in ab-initio simulations (aside from the use of pseudopotentials, which are purely atomic properties).

Solid circles: XRD data of Ďurišin et al. Ďurišin et al. (2014), crosses: AIMD; full curve: -MD.

Dotted line: -MD with , full curve: same with . Squares: unpublished XRD data of Ref. Mattern et al., shed shown in Ref. Han and Teichler, 2007.
This pair structure is clearly different from the one predicted by Han and Teichler using the parametrization of the SW potential (figure (9)). Since these parameters fitted on the ordered solid cannot describe the structure of the liquid either, as shown above, both the high- and low-temperature limits suggest a possible problem with this parametrization. The puzzling point however is that the same parametrization predicts a total rdf in rather good agreement with the (unpublished) experimental data Mattern et al. (shed) shown in Ref. Han and Teichler, 2007 (figure (9)).
Given the excellent agreement between simulation and the experimental data of Ďurišin et al. Ďurišin et al. (2014), which are clearly different from those of Ref. Mattern et al., shed, and excluding artifacts, one possibility is that the experimental rdfs in figure (8) are different because they actually correspond to different amorphous states. This idea of some dependence on the thermodynamic path through which the amorphous state is reached is found for example in Refs. Duan et al., 2005; McMillan, 2004; Luo et al., 2004; Sheng et al., 2007. The parametrization with – which is not validated by AIMD – might thus correspond to a metastable state close to the one reached in Ref. Mattern et al., shed (the path for these data Mattern et al. (shed) is likely the same as in Ref. Pauly et al., 2009, which does not show the rdf). A slight change in the thermodynamic parameters or in the parametrization should thus drive the system away from a local free energy minimum. To test this, we first performed a 10 times slower quench ( K s-1), with the parametrization . We indeed find a detectable effect on . This differs from the study in Ref. Wang et al., 2009 of the amorphous Cu46Zr54 metallic glass, which showed no significant effect of the quenching rate in the higher range investigated. The authors used TB-SMA n-body potentials parametrized according to the method of Ref. Duan et al., 2005, in which the force-field parameters were obtained from a fit to first-principles/DFT calculation, as we do it here. The slight effect of the cooling rate we found is however insufficient to explain the difference between the two experiments. A path dependence is also suggested by the solid solution model in Ref. Qin and Lai, 2011. It is difficult to compare our results with those for the Cu70ZrxTi1-x systems, but the great sensitivity to the concentration of the minority species shown clearly testifies for the importance of the path leading to the amorphization – the solid solution remaining crystalline at some concentrations, for example (see the discussion of figure (8) in Ref. Qin and Lai, 2011).
In the numerical quench experiment, another source for the observed discrepancy is the initial structure, which, as discussed above, is quite different with and . As a test of the sensitivity to the parametrization, we relaxed the adjustment of the strength parameter for Cu to start with a structure that is in-between the “correct” one (i.e. with ) and the one obtained with (recall that the latter predicts a less structured liquid). As expected, the resulting at 300 K (not shown here) is indeed in between the one obtained with the initial parameters (or experiment) and the one with . Another indication suggesting metastability of the state described by the data of Ref. Mattern et al., shed is the fact that the AIMD run quickly departs from configuration (3) (see also figure (7)). More experiments would thus be useful to ascertain the structure in amorphous states reached through different thermodynamic paths.
III.2.2 Glass transition temperature
The simulation of a small periodic systems is not expected to give an accurate description of the amorphization of the real ternary alloy, besides other questions such as surface effects in the experiment. Its computational cost for the required larger systems discouraged us from attempting it in this work. Nevertheless, to test the idea of adjusting the parameters in the liquid, we used the classical -MD route with the parameters to estimate the critical temperature of the glass transition. This was done from the behavior of the constant-pressure heat capacity , shown in figure (10).

Full curve: -MD with ; dashed curve: same with .
We thus find K, slightly above the value determined with the parameters ( K). This is consistent with the diffusivity being lower with the parameters . Both are above experimental estimates ( K in Ref. Inoue et al., 2001 or K in Ref. Ďurišin et al., 2014). Comparison with experiment is however not immediate for several reasons, including the cooling rates that are achievable in simulation Han and Teichler (2007). The higher cooling rates in the simulation should indeed overestimate the critical temperature. A clarification of this aspect on the basis of ab-initio simulation is left for future work.
III.3 Finite-size effects
The main question we investigated here is the transferability at different temperatures and compositions of parametrized potentials for a representative ternary alloy, using, for computational convenience, a rather small system. This question is actually independent of the closeness of the properties of the small periodic system to those of the macroscopic alloy. Aside from the question of statistics, using a small system does not indeed constitute a limitation as long as the goal remains to test transferability. To have an idea of the influence of the system size, some calculations were nevertheless repeated using atoms, and no significant change of the pair structure was found.
Actually, the possible impact of using a small periodic system has two different aspects: the first one concerns the variation of the structure with the number of atoms considered. The second one is the metallic character of a small system, especially when the minority species are represented by a few tens of atoms.
The first aspect can be important due to the lack of long-range order of amorphous materials which requires using blocks containing at least several hundreds of particles (see Ref. Kulp et al., 1993 for Cu-Ti). To investigate this, we repeated the classical simulations with much larger systems. As we found no significant effect on the rdf, the artificial periodicity related to a small system size should not be a qualitative limitation, as far as the average structure is concerned. This is confirmed by the very good agreement with the recent X-ray data shown in figure (8). On the other hand, the ab-initio rdfs were obtained in NVT conditions for a rather small system having the average density at zero pressure in the classical MD. This gives a slightly too high ab-initio pressure while the small system size makes it slightly anisotropic. But due to the very steep variation of the pressure with density only very accurate values for the latter might require larger systems.
Other structural properties might however be much more sensitive to the size of the system (see e.g. Refs. Cheng, Ma, and Sheng, 2009; Tian et al., 2011; Fujita et al., 2009). In Ref. Fujita et al., 2009, for example, it has been noticed that selective minor additions can dramatically improve the GFA of binary metallic glasses. In particular, the effect of composition on the glass formation of the Cu-Ti-Zr alloys has been discussed in Refs. Dai et al., 2008a, b; Zhang, Dai, and Xu, 2009; Qin and Lai, 2011. For the family of Cu-based alloys, a recent study Ward et al. (2013) based on the parametrization of Ref. Mendelev et al., 2009 evidenced the subtle structural evolution that occurs during cooling. They pointed out that the presence of icosahedrally coordinated clusters and their tendency to form networks is insufficient to explain glass formation at all compositions in the Cu-Zr binary system. Besides the Cu-Ti-Zr alloy considered here, there are several studies of Cu-based ternary alloys, such as Cu-Zr-Al Zhou et al. (2010) and Cu-Zr-Ag Fujita et al. (2010). In Ref. Fujita et al., 2010 a many-body potential was developed using the embedded atom method (EAM) on the basis of ab-initio calculations Cheng, Ma, and Sheng (2009). They pointed out the coupling between chemical and dynamical heterogeneities, which appears to play a crucial role in the improved GFA of this alloy and the Cu family of alloys studied in Ref. Lee et al., 2003. Studying such size-dependent structural effects by ab-initio simulations would likely require larger samples than those considered here.
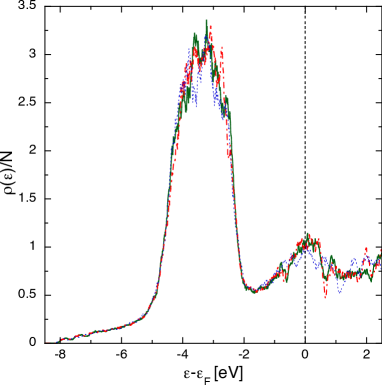
The second question relates to how far the electronic structure would have been different had we used a larger system, due to the actual sensitivity of the metallic character to the number of atoms in a small sample, as discussed in the literature on the related field of metallic clusters (see e.g. Refs. de Heer, 1993; Edwards, Ramakrishnan, and Rao, 1995; von Issendorff and Cheshnovsky, 2005 and references therein). For the actual size used here, an idea can be formed from the system size dependence of typical electronic properties such as the density of states (DOS), the Fermi level, or the energy per particle. Figure (11) shows the instantaneous DOS in equilibrated configurations of the nuclei at 300 K: two for atoms and one for . In the three cases, the DOSs are very similar, being dominated by the d-band-like contribution of Cu in the range eV. The corresponding Fermi energies are , , and eV, and the total energies per particle are , , and eV, respectively. A quite similar behavior for Cu-Zr binaries is shown in figure (4) of Ref. Antonowicz et al., 2014. This shows that the variation with system size is of the same amplitude as the variation between two configurations having the same number of particles. Averaging over a large number of configurations will smooth even more the tiny differences found here (see also Ref. Antonowicz et al., 2014). Thus the systems we used seem large enough also for the electronic structure at fixed configuration of the nuclei.
IV Conclusion
We have discussed in this work the transferability of a simplified model potential of the Stillinger-Weber form, between the pure components and the alloy in the liquid state, and for the alloy during a quench down to the amorphous state. Comparison with ab-initio simulation shows that the parameters adjusted in the liquid are transferable at high temperature independently of the composition, and well below the critical glass transition, as far as the pair structure is concerned. This contrasts with the parameters adjusted in the solid which cannot describe the structure in the liquid, and predict an amorphous structure that is inconsistent with ab-initio simulation and the more recent diffraction experiments. This rises the question of the path followed to reach possibly metastable amorphous states, prior to the comparison with theoretical predictions. Concerning the question of the size of the simulated system, it is found from a discussion of the size dependence of the average structure, and of the metallicity that ab-initio simulations are feasible on medium size computers while the study of other properties such as local structural organization, of low cooling rates, or simulations in NPT conditions still require larger computational resources. Comparison with the prediction of the critical temperature of the glass transition and the available experimental structure using classical simulation, which is less subject to system size limitations, finally underlines the importance of developing thoroughly tested parametrized force fields, in order to keep simulations convenient enough for a quantitative study of the behavior of complex materials.
References
- Inoue et al. (1988) A. Inoue, K. Ohtera, K. Kita, and T. Masumoto, Jpn. J. Appl. Phys. 27, L2248 (1988).
- Trexler and Thadani (2010) M. M. Trexler and N. N. Thadani, Prog. Mater. Sci. 55, 759 (2010).
- Gong et al. (2013) P. Gong, K. Yao, X. Wang, and Y. Shao, Adv. Eng. Mater. 15, 691 (2013).
- Niinomi (2003) M. Niinomi, Sci. Technol. Adv. Mater. 4, 445 (2003).
- Inoue et al. (2001) A. Inoue, W. Zhang, T. Zhang, and K. Kurosaka, Acta Mater. 49, 2645 (2001).
- Xu, Duan, and Johnson (2004) D. Xu, G. Duan, and W. L. Johnson, Phys. Rev. Lett. 92, 245504 (2004).
- Das et al. (2005) J. Das, M. B. Tang, K. B. Kim, R. Theissmann, F. Baier, W. H. Wang, and J. Eckert, Phys. Rev. Lett. 94, 205501 (2005).
- Venkataraman et al. (2006) S. Venkataraman, K. Biswas, B. C. Wei, D. J. Sordelet, and J. Eckert, J. Phys. D 39, 2600 (2006).
- Ma et al. (2004) C. Ma, H. Soejima, S. Ishihara, K. Amiya, N. Nishiyama, and A. Inoue, Mater. Trans. 45, 3223 (2004).
- Zhou et al. (2010) B. W. Zhou, X. G. Zhang, W. Zhang, H. Kimura, T. Zhang, A. Makino, and A. Inoue, Mater. Trans. 51, 826 (2010).
- Daw and Baskes (1984) M. S. Daw and M. I. Baskes, Phys. Rev. B 29, 6443 (1984).
- Rosato, Guillope, and Legrand (1989) V. Rosato, M. Guillope, and B. Legrand, Philos. Mag. A 59, 321 (1989).
- Finnis and Sinclair (1984) M. W. Finnis and J. E. Sinclair, Philos. Mag. A 50, 45 (1984).
- Sheng et al. (2011) H. W. Sheng, M. J. Kramer, A. Cadien, T. Fujita, and M. W. Chen, Phys. Rev. B 83, 134118 (2011).
- Li, Dai, and Dai (2012) J. H. Li, Y. Dai, and X. D. Dai, Intermetallics 31, 292 (2012).
- Fujita et al. (2010) T. Fujita, P. F. Guan, H. W. Sheng, A. Inoue, T. Sakurai, and M. W. Chen, Phys. Rev. B 81, 140204(R) (2010).
- Mendelev et al. (2009) M. I. Mendelev, M. J. Kramer, R. T. Ott, D. J. Sordelet, D. Yagodin, and P. Popel, Philos. Mag. 89, 967 (2009).
- Cheng and Ma (2008) Y. Q. Cheng and E. Ma, Appl. Phys. Lett. 93, 051910 (2008), http://dx.doi.org/10.1063/1.2966154.
- Jakse, Nassour, and Pasturel (2012) N. Jakse, A. Nassour, and A. Pasturel, Phys. Rev. B 85, 174201 (2012).
- Alemany et al. (1999) M. M. G. Alemany, O. Diéguez, C. Rey, and L. J. Gallego, Phys. Rev. B 60, 9208 (1999).
- Noya, Rey, and Gallego (2002) E. G. Noya, C. Rey, and L. J. Gallego, J. Non-Cryst. Solids 298, 60 (2002).
- Kart et al. (2004) S. Ö. Kart, M. Tomak, M. Uludoğan, and T. Çağın, J. Non-Cryst. Solids 337, 101 (2004).
- Sutton and Chen (1990) A. P. Sutton and J. Chen, Philos. Mag. Lett. 61, 139 (1990).
- Foiles (1985) S. M. Foiles, Phys. Rev. B 32, 3409 (1985).
- Aguado and Madden (2004) A. Aguado and P. A. Madden, Phys. Rev. B 70, 245103 (2004).
- Tafipolsky and Schmid (2009) M. Tafipolsky and R. Schmid, J. Phys. Chem. B 113, 1341 (2009).
- Harvey, Gheribi, and Chartrand (2012) J.-P. Harvey, A. E. Gheribi, and P. Chartrand, Phys. Rev. B 86, 224202 (2012).
- Cheng, Ma, and Sheng (2009) Y. Q. Cheng, E. Ma, and H. W. Sheng, Phys. Rev. Lett. 102, 245501 (2009).
- Tian et al. (2012) H. Tian, H. Liu, C. Zhang, J. Zhao, C. Dong, and B. Wen, J. Mater. Sci. 47, 7628 (2012).
- Tian et al. (2011) H. Tian, C. Zhang, L. Wang, J. Zhao, C. Dong, B. Wen, and Q. Wang, J. Appl. Phys. 109, 123520 (2011).
- Zope and Mishin (2003) R. R. Zope and Y. Mishin, Phys. Rev. B 68, 024102 (2003).
- Li et al. (2008) J. H. Li, X. D. Dai, S. H. Liang, K. P. Tai, Y. Kong, and B. X. Liu, Phys. Rep. 455, 1 (2008).
- Behler and Parrinello (2007) J. Behler and M. Parrinello, Phys. Rev. Lett. 98, 146401 (2007).
- Eshet et al. (2010) H. Eshet, R. Z. Khaliullin, T. D. Kühne, J. Behler, and M. Parrinello, Phys. Rev. B 81, 184107 (2010).
- Jiang et al. (2003) J. Z. Jiang, H. Kato, T. Ohsuna, J. Saida, A. Inoue, K. Saksl, H. Franz, and K. Ståhl, Appl. Phys. Lett. 83, 3299 (2003).
- Dai et al. (2008a) C.-L. Dai, H. Guo, Y. Li, and J. Xu, J. Non-Cryst. Solids 354, 3659 (2008a).
- Dai et al. (2008b) C.-L. Dai, J.-W. Deng, Z.-X. Zhang, and J. Xu, J. Mater. Res. 23, 1249 (2008b).
- Zhang, Dai, and Xu (2009) Z.-X. Zhang, C.-L. Dai, and J. Xu, J. Mater. Sci. Technol. (Shenyang, China) 25, 39 (2009).
- Pauly et al. (2009) S. Pauly, J. Das, N. Mattern, D. H. Kim, and J. Eckert, Intermetallics 17, 453 (2009).
- Ďurišin et al. (2014) J. Ďurišin, D. Balga, K. Saksl, and A. Pietriková, J. Alloys Compd. 608, 241 (2014).
- Han and Teichler (2007) X. J. Han and H. Teichler, Phys. Rev. E 75, 061501 (2007).
- Qin and Lai (2011) B. Qin and W. S. Lai, J. Mater. Res. 26, 547 (2011).
- Senturk Dalgic and Celtek (2011a) S. Senturk Dalgic and M. Celtek, EPJ Web of Conferences 15, 03008 (2011a).
- Fujii and Tokuyama (2011) H. Fujii and M. Tokuyama, Phys. Rev. E 83, 021502 (2011).
- Jakse and Pasturel (2008a) N. Jakse and A. Pasturel, Phys. Rev. B 78, 214204 (2008a).
- Jakse and Pasturel (2008b) N. Jakse and A. Pasturel, Appl. Phys. Lett. 93, 113104 (2008b).
- Kohn and Sham (1965) W. Kohn and L. J. Sham, Phys. Rev. 140, A1133 (1965).
- Giannozzi et al. (2009) P. Giannozzi, S. Baroni, N. Bonini, M. Calandra, R. Car, C. Cavazzoni, D. Ceresoli, G. L. Chiarotti, M. Cococcioni, I. Dabo, A. D. Corso, S. de Gironcoli, S. Fabris, G. Fratesi, R. Gebauer, U. Gerstmann, C. Gougoussis, A. Kokalj, M. Lazzeri, L. Martin-Samos, N. Marzari, F. Mauri, R. Mazzarello, S. Paolini, A. Pasquarello, L. Paulatto, C. Sbraccia, S. Scandolo, G. Sclauzero, A. P. Seitsonen, A. Smogunov, P. Umari, and R. M. Wentzcovitch, J. Phys.: Condens. Matter 21, 395502 (2009).
- Pasturel and Jakse (2010) A. Pasturel and N. Jakse, Comput. Mater. Sci. 49, S210 (2010).
- Stillinger and Weber (1985) F. H. Stillinger and T. A. Weber, Phys. Rev. B 31, 5262 (1985).
- Plimpton (1995) S. Plimpton, J. Comput. Phys. 117, 1 (1995).
- Vanderbilt (1990) D. Vanderbilt, Phys. Rev. B 41, 7892 (1990).
- Note (1) Cu.pbe-n-van_ak.UPF, Ti.pbe-sp-van_ak.UPF, Zr.pbe-nsp-van.UPF from the QE library. Details on their generation are given in the file headers and accompanying text files.
- Perdew, Burke, and Ernzerhof (1996) J. P. Perdew, K. Burke, and M. Ernzerhof, Phys. Rev. Lett. 77, 3865 (1996).
- Kresse (2002) G. Kresse, J. Non-Cryst. Solids 312-314, 52 (2002).
- Kresse and Joubert (1999) G. Kresse and D. Joubert, Phys. Rev. B 59, 1758 (1999).
- Waseda (1980) Y. Waseda, The Structure of Non-Crystalline Materials (McGraw-Hill, New York, 1980).
- Ganesh and Widom (2006) P. Ganesh and M. Widom, Phys. Rev. B 74, 134205 (2006).
- Regnaut, Fusco, and Badiali (1985) C. Regnaut, E. Fusco, and J. P. Badiali, Phys. Rev. B 31, 771 (1985).
- Ristić et al. (2014) R. Ristić, J. R. Cooper, K. Zadro, D. Pajić, J. Ivkov, and E. Babić, J. Alloys Compd. 621, 136 (2014).
- Senturk Dalgic and Celtek (2011b) S. Senturk Dalgic and M. Celtek, J. Optoelectron. Adv. Mater. 13, 1563 (2011b).
- Note (2) See supplemental material at [energy_1600K.pdf] for a plot of the energy and at [pressure_300_1600.pdf] for a plot of the pressure.
- Holland-Moritz et al. (2007) D. Holland-Moritz, O. Heinen, R. Bellissent, and T. Schenk, Mater. Sci. Eng.: A 449-451, 42 (2007).
- Jakse and Pasturel (2003) N. Jakse and A. Pasturel, Phys. Rev. Lett. 91, 195501 (2003).
- Mizuno et al. (2005) A. Mizuno, S. Matsumura, M. Watanabe, S. Kohara, and M. Takata, Mater. Trans. 46, 2799 (2005).
- Harvey, Gheribi, and Chartrand (2011) J.-P. Harvey, A. E. Gheribi, and P. Chartrand, J. Chem. Phys. 135, 084502 (2011).
- Georgarakis et al. (2009) K. Georgarakis, A. R. Yavari, D. V. Louzguine-Luzgin, J. Antonowicz, M. Stoica, Y. Li, M. Satta, A. LeMoulec, G. Vaughan, and A. Inoue, Appl. Phys. Lett. 94, 191912 (2009).
- Duan et al. (2005) G. Duan, D. Xu, Q. Zhang, G. Zhang, T. Cagin, W. L. Johnson, and W. A. Goddard, Phys. Rev. B 71, 224208 (2005).
- Wang et al. (2009) J. Wang, P. D. Hodgson, J. Zhang, W. Yan, and C. Yang, J. Mater. Process. Technol. 209, 4601 (2009).
- Note (3) See supplemental material at [pressure_300_1600.pdf] for the plot of the pressure.
- Note (4) See supplemental material at [g_Cu_0.066.pdf] for at K and Å-3.
- Note (5) See supplemental material at [MSD_300K.pdf].
- Note (6) See supplemental material at [MSD_1700K.pdf].
- Note (7) See supplemental material for a view of the total particle displacements during the AIMD runs: [displacements.png], run starting from configuration (1); [displacements_a^s.png], run starting from configuration (3). See also the snapshot of configuration (1) at [snapshot.png].
- Mattern et al. (shed) N. Mattern, J. Sakowski, A. Concustell, P. Jovari, M. D. Baro, and J. Eckert, (unpublished), cited in Ref. Han and Teichler, 2007.
- McMillan (2004) P. F. McMillan, J. Mater. Chem. 14, 1506 (2004).
- Luo et al. (2004) W. K. Luo, H. W. Sheng, F. M. Alamgir, J. M. Bai, J. H. He, and E. Ma, Phys. Rev. Lett. 92, 145502 (2004).
- Sheng et al. (2007) H. W. Sheng, H. Z. Liu, Y. Q. Cheng, J. Wen, P. L. Lee, W. K. Luo, S. D. Shastri, and E. Ma, Nat. Mater. 6, 192 (2007).
- Kulp et al. (1993) D. T. Kulp, G. J. Ackland, M. Sob, V. Vitek, and T. Egami, Modell. Simul. Mater. Sci. Eng. 1, 315 (1993).
- Fujita et al. (2009) T. Fujita, K. Konno, W. Zhang, V. Kumar, M. Matsuura, A. Inoue, T. Sakurai, and M. W. Chen, Phys. Rev. Lett. 103, 075502 (2009).
- Ward et al. (2013) L. Ward, D. Miracle, W. Windl, O. N. Senkov, and K. Flores, Phys. Rev. B 88, 134205 (2013).
- Lee et al. (2003) H.-J. Lee, T. Cagin, W. L. Johnson, and W. A. Goddard, J. Chem. Phys. 119, 9858 (2003).
- de Heer (1993) W. A. de Heer, Rev. Mod. Phys. 65, 611 (1993).
- Edwards, Ramakrishnan, and Rao (1995) P. P. Edwards, T. V. Ramakrishnan, and C. N. R. Rao, J. Phys. Chem. 99, 5228 (1995).
- von Issendorff and Cheshnovsky (2005) B. von Issendorff and O. Cheshnovsky, Annu. Rev. Phys. Chem. 56, 549 (2005).
- Antonowicz et al. (2014) J. Antonowicz, A. Pietnoczka, K. Pękała, J. Latuch, and G. A. Evangelakis, J. Appl. Phys. 115, 203714 (2014).
- Blöchl, Jepsen, and Andersen (1994) P. E. Blöchl, O. Jepsen, and O. K. Andersen, Phys. Rev. B 49, 16223 (1994).