Probing colloidal gels at multiple lengthscales: the role of hydrodynamics
Abstract
Colloidal gels are out-of-equilibrium structures, made up of a rarefied network of colloidal particles. Comparing experiments to numerical simulations, with hydrodynamic interactions switched off, we demonstrate the crucial role of the solvent for gelation. Hydrodynamic interactions suppress the formation of larger local equilibrium structures of closed geometry, and instead lead to the formation of highly anisotropic threads, which promote an open gel network. We confirm these results with simulations which include hydrodynamics. Based on three-point correlations, we propose a scale-resolved quantitative measure for the anisotropy of the gel structure. We find a strong discrepancy for interparticle distances just under twice the particle diameter between systems with and without hydrodynamics, quantifying the role of hydrodynamics from a structural point of view.
pacs:
82.70.Dd; 64.70.Pf; 47.55.-t; 82.70.GgThe formation of a network of arrested material with finite zero-shear viscosity upon slight quenching is among the most striking features of condensed matter Zaccarelli (2007); Poon (2002); Coniglio et al. (2004); Ramos and Cipelletti (2005). Gels can be soft or biological materials such as proteins Tanaka and Nishikawa (2005); Cardinaux et al. (2007), clays Jabbari-Farouji et al. (2007), foods Tanaka (2013), hydrogels Helgeson et al. (2012) and tissues Drury and Mooney (2003); Rose et al. (2014). However a more diverse range of systems including granular matter Ulrich et al. (2009), phase-demixing oxides Bouttes et al. (2014) and metallic glassformers Baumer and Demkowicz (2013) also exhibit gelation. The mechanical properties of gels are influenced by their structure both locally Hsiao et al. (2012); Sabin et al. (2012); Zhang et al. (2012); Zaccone et al. (2011) and at a global level through percolation of particles Valadez-Pérez et al. (2013) and clusters Kroy et al. (2004), network topology Varrato et al. (2012) and confinement Spannuth and Conrad (2012).
Despite its widespread occurrence, a deep understanding of gelation remains a challenge. In particular, numerical simulations with numbers of particles large enough to reveal the percolating network structure are limited to an approximation in which the effect of the fluid containing the particles is disregarded Holm and Kremer (2009). In the colloidal gels we will consider, demixing of the particles into a (colloidal) “gas” and “liquid” occurs. Spinodal demixing leads to a network of particles Verhaegh et al. (1997); Tanaka (1999); Manley et al. (2005); Lu et al. (2008); Zaccarelli et al. (2008) which undergoes dynamical arrest Testard et al. (2011). The final structure can persist for years Ruzicka et al. (2011), if the self-generated or gravitational stress is weaker than the yield stress Tanaka (2013).
Demixing is driven by effective attractions between the colloidal particles induced by the addition of non-absorbing polymer. Thus although the system is a mixture of three important components — colloids, polymers and solvent — in equilibrium we can recast it as an effective one-component system of colloids which experience an attractive interaction whose strength is determined by the polymer concentration Dijkstra et al. (2000); Likos (2001). However out of equilibrium, hydrodynamic interactions (HI), i.e. interactions between particles mediated by the continuous fluid phase, come into play. These are hard to treat as they are both long-ranged and not limited to pairwise interactions.
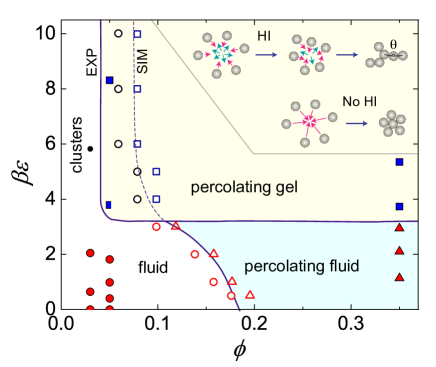
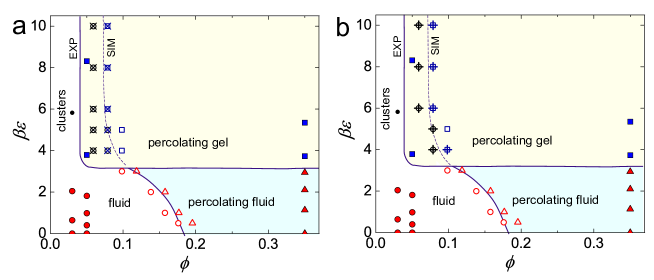
In this Letter, we show that the colloid volume fraction required for gelation is reduced by a factor of 1.75 including HI, see Fig. 1. This occurs although our Brownian dynamics simulations (without HI) are parameterized closely to our experiments Royall et al. (2007, 2008). We back up these findings with simulations including HI using fluid particle dynamics Tanaka and Araki (2000, 2006) for accessible system sizes. Our results call into question the standard theoretical approach used to describe colloidal systems quantitatively.
We show that HI strongly favor gelation since they inhibit the direct formation of energetically locally favored compact structures, which minimize the potential energy between small groups of colloids Doye et al. (1995); Malins et al. (2013). On one hand, the structural mechanism by which the network of colloids forms and becomes rigid has been shown to be condensation into locally favored structures whose geometry underlies the local order of the percolating network Royall et al. (2008). On the other hand, HI lead to solvent back flow, with the effect of slowing down the condensation of colloids, favoring more open elongated local structures than would be the case without HI (see Fig. 1 inset) Tanaka and Araki (2000, 2006); Furukawa and Tanaka (2010); Whitmer and Luijten (2011); Cao et al. (2012). This is a consequence of the incompressibility of the liquid solvent, which allows only transverse (rotational) motion of the fluid. Without HI, large closed structures form, favored by minimizing the energy alone.
We used polymethylmethacrylate colloids, sterically stabilized with polyhydroxyl steric acid. The colloids were labeled with 4-chloro-7-nitrobenzo-2-oxa-1,3-diazol (NBD) and had a diameter of m and polydispersity of 4% as determined by static light scattering Bosma et al. (2002). The polymer was polystyrene, with a molecular weight of with and solvent was a nearly density- and refractive index-matching mixture of cis-decalin and cyclohexyl bromide. To screen any (weak) electrostatic interactions, we dissolved tetra-butyl ammonium bromide (TBAB) salt to a concentration of 4 mM Royall et al. (2007, 2008). We determine the colloid volume fraction and polymer number density by weighing along with particle tracking in the case of the former.
We take the polymer volume fraction as . In these good solvent conditions nm so the polymer-colloid size ratio is Royall et al. (2007). This is much larger than the range of the steric stabilisation layer ( 10 nm) previously identified as a criterion for spherically symmetric effective interactions between colloids, which we assume here, neglecting for example any hindrance of rotational diffusion Prasad et al. (2003) which might otherwise impact significantly on relaxation dynamics Seto et al. (2013).
We prepare the samples in glass capillaries of internal dimensions 100 m 1 mm 1 cm and image the colloidal particles with a Leica SP5 confocal microscope with a resonant scanner and took data at least 20 m from the wall of the sample cell. The particle coordinates are tracked in three dimensions (3D) with an accuracy of around . Samples were prepared 10 minutes prior to imaging and imaged for around 20 minutes. In units of the Brownian time, s, where is the diffusion constant. Data was therefore taken between and rafter preparation. In our simulations we model the colloid-polymer mixture, using the Morse potential
| (1) |
which we have found to provide an accurate description of colloid-polymer mixtures for size ratios such as we consider here Royall et al. (2008); Taffs et al. (2010).
The interaction is truncated and shifted at and the range parameter is set to Royall et al. (2008). The effective temperature is controlled by varying the well depth of the potential scaled by the thermal energy , , which corresponds to the polymer chemical potential in the experiments. This can be estimated from the polymer concentration using Widom particle insertion Widom (1963); Lekkerkerker et al. (1992). Short-ranged attractive systems can be mapped onto one another Noro and Frenkel (2000); Foffi et al. (2005) via the extended law of corresponding states, which equates the reduced second virial coefficient between two potentials where is the effective hard sphere diameter Lu et al. (2008); Royall et al. (2008); Taffs et al. (2010). Here is the second virial coefficient. Knowing the polymer volume fraction in the experiment, we are able to map the effective colloid-colloid interaction to a Morse potential of the same second virial coefficient. We assume that the colloid-colloid interaction has the so-called Asakura-Oosawa form Royall et al. (2007). Further details are provided in Supplementary Material (SM).
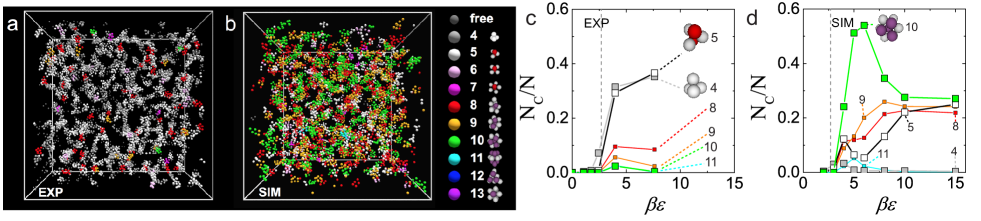
Our colloidal particles used in the experiments are slightly polydisperse, which is treated in our Brownian Dynamics (BD) simulations by scaling in Eq. (1) by a Gaussian distribution in with 4% standard deviation (the same value as the experimental system). For details of our BD simulation methods, see Royall and Malins (2012). Unless otherwise indicated, runs are equilibrated for (close to the value in the experiments). Data are then sampled for a further . The system size was fixed by the box length of up to particles (corresponding to ). For higher volume fractions, the box was reduced and the system size fixed at . In the simulations we define . To analyze the local structure, we identify the bond network using the Voronoi construction with a maximum bond length of . Having identified the bond network, we use the Topological Cluster Classification (TCC) Malins et al. (2013) to decompose the system into a set of locally favored structures comprised of particles, which are the minimum energy clusters for the Morse potential Doye et al. (1995) and illustrated in Fig. 2(a) and (b) Malins et al. (2013).
The most striking observation in the state diagram of Fig. 1 is that experiments form gels (in the sense of a percolating network) even at per . By contrast BD simulations form gels only above , requiring a much higher volume fraction than in the experiments. We consider different simulation run times and system sizes, neither of which have any significant effect on our results (see SM).
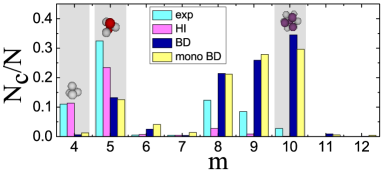
We use the TCC to identify different locally favored structures and consider a state point which typifies the effects of HI on local structure in Fig. 3. At , the experiment exhibits a percolating gel, while BD simulations form isolated (non-percolating) clusters. Under these conditions, the difference in local structure is clear: the experiment (a) is dominated by smaller clusters, mainly tetrahedra and five-membered triangular bipyramids. By contrast the simulation (b) exhibits larger clusters. In Figs. 2(c) (experiment) and (d) (simulation) we consider a range of well depths. We see that over the range relevant to gelation, around 35% of the system is in tetrahedra in the experiment, with a further 35% is in triangular bipyramids, which are formed by the addition of a particle to the center of a face of a tetrahedron; these two simple clusters dominate the experimental system. This contrasts strongly with the BD simulation data, where much larger, compact clusters based on five-membered rings (, 9 and 10) account for over 60% of the particles in the system. Note that tetrahedra are the smallest rigid unit for spheres in 3D, thus we expect that these represent a limiting case for a dynamically arrested gel structure. Our findings for the local structure are thus consistent with the schematic picture outlined above and also with previous simulation work which showed that HI can suppress the formation of compact clusters Tanaka and Araki (2000, 2006); Furukawa and Tanaka (2010); Whitmer and Luijten (2011); Cao et al. (2012).
To provide further evidence in support of our hypothesis we carry out fluid particle dynamics simulations (FPD). This method includes HI by treating both colloids and solvent as a fluid continuum with a sufficient viscosity contrast Tanaka and Araki (2000, 2006), to realize a situation where viscous dissipation occurs predominantly in the solvent as appropriate to a suspension of solid colloidal particles. Such simulations necessarily describe smaller systems due to the high computational cost. Here we consider a monodisperse system of particles at a volume fraction of and attractive well depth . The results are shown in Fig. 3 and Fig. 2(d). We also carried out a monodisperse BD simulation with , i.e. matched to the FPD parameters. We see that FPD simulations with HI are much closer to the experimental results than either BD result, indicating that the main difference between the BD simulations and experiments is HI, rather than polydispersity or system size.
Thus we argue that the origin of the percolation at low colloid density in the experiment is the lack of compact clusters which lead to a more open structure. These more open clusters arise from hydrodynamic back flow during condensation. While the FPD simulations are very much closer to the experiments than the BD simulations, the agreement is not perfect. This might originate from differences in the system size, as the experimental system is very much larger. Furthermore the boundary conditions imposed by the capillaries in the experiment are rather different to the case of of the periodic simulation box.
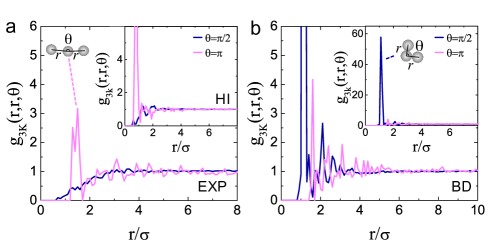
Having identified the fundamental local structures, we now investigate the lengthscales on which HI lead to thread-like structures, which make up the gel network. Inspired by similar efforts to detect elongated structures in cosmology Gaztañaga and Scoccimarro (2005), we consider three-body correlations as function of the bond angle. Figure 1 (inset) indicates that the bond angle distribution is likely to be biased toward bond angles close to compared to the case without HI Tanaka and Araki (2006); Cao et al. (2012). A general three-body correlation function for a triad may be written as Hansen and Macdonald (1976)
where is the number density, and are particle indices. By considering , where and is the angle between and , we probe the angle at different length scales . For simplicity, we compare and , a strong signal in the former demonstrating elongated structures typical of a rarefied gel.
We remove the contribution of pair correlations, which can mask the differences in bond angles we seek, using Kirkwood’s approximation . We thus plot and at for both experiments and simulations in Figs. 4 (a) and (b) respectively. We see in the simulation data in Fig. 4(b) that there is a very strong peak at for , corresponding to the compact structure shown in the inset. As expected, no corresponding signal is seen at , which is sensitive to elongated structures.
By contrast, there is a complete absence of any peak in the data of the experiment, as seen in Fig. 4(a). Such a reduction in compact configurations indicates that the presence of HI has a dramatic effect on the geometry of configurations at the three-body level. On the other hand, experiments show a significant peak at around for , [cf. Fig. 4(a)]. This is indicative of chainlike structures with a length scale , as expected in the case of HI, which tend to align colloids along the flow, as shown schematically in Fig. 1. There is no detectable signal from clusters such as defective icosahedra, whose length scale is as well, as they do not produce chains sufficiently straight to lead to a peak for . As shown in Fig. 4(a) inset, FPD simulations closely follow experiments in their three-body correlations.
In conclusion, we have shown that hydrodynamic interactions have a profound effect on gelation in colloids: the volume fraction above which gelation is found is for simulations without hydrodynamic interactions whereas for experiments with HI. Furthermore, we have found that the effects of HI can also be seen from the distinct difference in the particle-level local structures formed upon phase demixing between experiments and simulations without HI, which we have backed up with simulations which include HI. In the absence of HI, compact clusters comprising around ten particles are formed. However those formed in the case of HI at the same volume fraction and attractive strength are predominantly four-membered tetrahedra or five-membered triangular bipyramids. Tetrahedra are the minimum mechanically stable structure. Thus HI promote the formation of tenuous low-density networks. The range over which HI impact local structure is determined with a three-body correlation function. This is sensitive to the spatial extent of anisotropic bond angle corrections. We find that the effects of HI can be observed over distances of or around 10 m at . We show that, when assessing the low-density limits of gelation, it is crucial to consider hydrodynamics. Thus in designing products based on gels where the concentration of gelling agent is important, one should carry out experiments or simulations which include HI, rather than to rely on Brownian dynamics simulations.
Acknowledgments
We gratefully acknowledge stimulating discussions with Tannie Liverpool, Bob Evans and Alex Malins. CPR acknowledges the Royal Society and European Research Council (ERC Consolidator Grant NANOPRS, project number 617266) for financial support and EPSRC grant code EP/H022333/1 for provision of a confocal microscope. Some of this work was carried out using the computational facilities of the Advanced Computing Research Centre, University of Bristol. HT acknowledges Grants-in-Aid for Scientific Research (S) and Specially Promoted Research from the Japan Society for the Promotion of Science (JSPS) for financial support.
Supplementary Material
Mapping interactions between experiment and simulation — . We have previously Royall et al. (2007) demonstrated that this system is accurately described by the Asakura-Oosawa interaction between the colloids, which reads
| (2) |
Here is the polymer volume fraction in a reservoir in chemical equilibrium with the experiment. Widom particle insertion Widom (1963); Lekkerkerker et al. (1992) is used to map between reservoir and the experimental system. is the polymer diameter where is the radius of gyration. The Asakura-Oosawa interaction is mapped to the Morse potential as described in the main text.
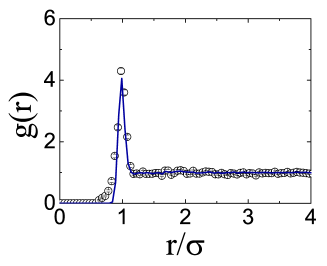
To investigate the accuracy of our technique in Fig. S5 we show the pair correlation function of a stable fluid reproduced with simulation. A Gaussian distribution of standard deviation of is added to the coordinates to mimic the particle tracking errors in the experiment Royall et al. (2007). The agreement in the indicates that the pairwise interactions in the experiment and simulation are very similar.
References
- Zaccarelli (2007) E. Zaccarelli, J. Phys.: Condens. Matter 19, 323101 (2007).
- Poon (2002) W. C. K. Poon, J. Phys: Condens. Matter 14, R859 (2002).
- Coniglio et al. (2004) A. Coniglio, L. De Arcangelis, E. Del Gado, A. Fierro, and N. Sator, J. Phys.: Condens. Matter 16, S4831?S4839 (2004).
- Ramos and Cipelletti (2005) L. Ramos and L. Cipelletti, J. Phys: Condens. Matter 17, R253 (2005).
- Tanaka and Nishikawa (2005) H. Tanaka and Y. Nishikawa, Phys. Rev. Lett. 95, 078103 (2005).
- Cardinaux et al. (2007) F. Cardinaux, T. Gibaud, A. Stradner, and P. Schurtenberger, Phys. Rev. Lett. 99, 118301 (2007).
- Jabbari-Farouji et al. (2007) S. Jabbari-Farouji, G. Wegdam, and D. Bonn, Phys. Rev. Lett. 99, 065701 (2007).
- Tanaka (2013) H. Tanaka, Faraday Discuss. 167, 9 (2013).
- Helgeson et al. (2012) M. E. Helgeson, S. E. Moran, H. Z. An, , and P. S. Doyle, Nature Mater. 11, 344 (2012).
- Drury and Mooney (2003) J. L. Drury and D. J. Mooney, Biomaterials 24, 4337 (2003).
- Rose et al. (2014) S. Rose, A. Prevoteau, P. Elzière, D. Hourdet, A. Marcellan, and L. Leibler, Nature 505, 382 (2014).
- Ulrich et al. (2009) S. Ulrich, T. Aspelmeier, K. Roeller, A. Fingerle, S. Herminghaus, and A. Zippelius, Phys. Rev. Lett. 102, 148002 (2009).
- Bouttes et al. (2014) D. Bouttes, E. Gouillart, E. Boller, D. Dalmas, and D. Vandembroucq, Phys. Rev. Lett. 112, 245701 (2014).
- Baumer and Demkowicz (2013) R. E. Baumer and M. J. Demkowicz, Phys. Rev. Lett. 110, 145502 (2013).
- Hsiao et al. (2012) L. C. Hsiao, R. S. Newman, S. C. Glotzer, and M. J. Solomon, Proc. Nat. Acad. Sci. 109, 16029 (2012).
- Sabin et al. (2012) J. Sabin, A. E. Bailey, G. Espinosa, and B. J. Frisken, Phys. Rev. Lett. 109, 195701 (2012).
- Zhang et al. (2012) T. H. Zhang, J. Klok, R. Hans Tromp, J. Groenewold, and W. K. Kegel, Soft Matter 8, 667 (2012).
- Zaccone et al. (2011) A. Zaccone, D. Gentili, H. Wu, M. Morbidelli, and E. Del Gado, Phys. Rev. Lett 106, 138301 (2011).
- Valadez-Pérez et al. (2013) N. E. Valadez-Pérez, Y. Liu, A. P. R. Eberle, N. J. Wagner, and R. Castañda Priego, Phys. Rev. E 88, 060302(R) (2013).
- Kroy et al. (2004) K. Kroy, M. E. Cates, and W. C. K. Poon, Phys. Rev. Lett. 92, 148302 (2004).
- Varrato et al. (2012) F. Varrato, L. Di Michele, M. Belushkin, N. Dorsaz, S. H. Nathanb, E. Eiser, and G. Foffi, Proc. Nat. Acad. Sci. 109, 19155 (2012).
- Spannuth and Conrad (2012) M. Spannuth and J. C. Conrad, Phys. Rev. Lett. 109, 028301 (2012).
- Holm and Kremer (2009) C. Holm and K. Kremer, eds., Advanced Computer Simulation Approaches for Soft Matter Sciences III (Springer, Berlin, 2009).
- Verhaegh et al. (1997) N. A. M. Verhaegh, D. Asnaghi, H. N. W. Lekkerkerker, M. Giglio, and L. Cipelletti, Physica A 242, 104 (1997).
- Tanaka (1999) H. Tanaka, Phys. Rev. E 59, 6842 (1999).
- Manley et al. (2005) S. Manley, H. M. Wyss, K. Miyazaki, J. C. Conrad, V. Trappe, L. J. Kaufman, D. R. Reichman, and D. A. Weitz, Phys. Rev. Lett. 95, 238302 (2005).
- Lu et al. (2008) P. J. Lu, E. Zaccarelli, F. Ciulla, A. B. Schofield, F. Sciortino, and D. A. Weitz, Nature 453, 499 (2008).
- Zaccarelli et al. (2008) E. Zaccarelli, P. J. Lu, F. Ciulla, D. A. Weitz, and F. Sciortino, J Phys.: Condens Matter 20, 494242 (2008).
- Testard et al. (2011) V. Testard, L. Berthier, and W. Kob, Phys. Rev. Lett. 106, 125702 (2011).
- Ruzicka et al. (2011) B. Ruzicka, E. Zaccarelli, L. Zulian, R. Angelini, M. Sztucki, A. Moussaid, T. Narayanan, and F. Sciortino, Nature Materials 10, 56 (2011).
- Dijkstra et al. (2000) M. Dijkstra, R. van Roij, and R. Evans, J. Chem. Phys 113, 4799 (2000).
- Likos (2001) C. Likos, Phys. Rep. 348, 267 (2001).
- Royall et al. (2007) C. P. Royall, A. A. Louis, and H. Tanaka, J. Chem. Phys. 127, 044507 (pages 8) (2007).
- Royall et al. (2008) C. P. Royall, S. R. Williams, T. Ohtsuka, and H. Tanaka, Nature Mater. 7, 556 (2008).
- Tanaka and Araki (2000) H. Tanaka and T. Araki, Phys. Rev. Lett. 85, 1338 (2000).
- Tanaka and Araki (2006) H. Tanaka and T. Araki, Chem. Eng. Sci. 61, 2108 (2006).
- Doye et al. (1995) J. P. K. Doye, D. J. Wales, and R. S. Berry, J. Chem. Phys. 103, 4234 (1995).
- Malins et al. (2013) A. Malins, S. R. Williams, J. Eggers, and C. P. Royall, J. Chem. Phys. 139, 234506 (2013).
- Furukawa and Tanaka (2010) A. Furukawa and H. Tanaka, Phys. Rev. Lett. 104, 245702 (2010).
- Whitmer and Luijten (2011) J. K. Whitmer and E. Luijten, J. Phys. Chem. B 115, 7294 (2011).
- Cao et al. (2012) X. J. Cao, H. Z. Cummins, and J. F. Morris, J. Colloid&Interface Sci. 368, 86 (2012).
- Bosma et al. (2002) G. Bosma, C. Pathmamanoharan, E. H. A. de Hoog, W. K. Kegel, A. van Blaaderen, and H. N. W. Lekkerkerker, J. Coll. Interf. Sci. 245, 292 (2002).
- Prasad et al. (2003) V. Prasad, V. Trappe, A. D. Dinsmore, P. N. Segre, L. Cipelletti, and D. A. Weitz, Faraday Discuss. 123, 1 (2003).
- Seto et al. (2013) R. Seto, R. Mari, J. F. Morris, and M. M. Denn, Phys. Rev. Lett. 111, 218301 (2013).
- Taffs et al. (2010) J. Taffs, A. Malins, S. R. Williams, and C. P. Royall, J. Phys.: Condens. Matter 22, 104119 (2010).
- Widom (1963) B. Widom, J. Chem. Phys. 39, 2808 (1963).
- Lekkerkerker et al. (1992) H. N. W. Lekkerkerker, W. C. K. Poon, P. N. Pusey, A. Stroobants, and P. B. Warren, Europhys. Lett. 20, 559 (1992).
- Noro and Frenkel (2000) M. G. Noro and D. Frenkel, J. Chem. Phys. 113, 2941 (2000).
- Foffi et al. (2005) G. Foffi, C. De Michele, F. Sciortino, and P. Tartaglia, Phys. Rev. Lett. 94, 078301 (2005).
- Royall and Malins (2012) C. P. Royall and A. Malins, Faraday Discuss. 158, 301?311 (2012).
- (51) In both our experiments and BD simulations, we test for percolation by requiring that more than 50% of configurations have a connected cluster of particles which spans the system in at least one dimension.
- Gaztañaga and Scoccimarro (2005) E. Gaztañaga and R. Scoccimarro, Mon. Not. R. Astron. Soc. 361, 824 (2005).
- Hansen and Macdonald (1976) J.-P. Hansen and I. Macdonald, Theory of Simple Liquids (Academic, London, 1976).