Arrest stress of uniformly sheared wet granular matter
Abstract
We conduct extensive independent numerical experiments considering frictionless disks without internal degrees of freedom (rotation etc.) in two dimensions. We report here that for a large range of the packing fractions below random-close packing, all components of the stress tensor of wet granular materials remain finite in the limit of zero shear rate. This is direct evidence for a fluid-to-solid arrest transition. The offset value of the shear stress characterizes plastic deformation of the arrested state which corresponds to dynamic yield stress of the system. Based on an analytical line of argument, we propose that the mean number of capillary bridges per particle, , follows a non-trivial dependence on the packing fraction, , and the capillary energy, . Most noticeably, we show that is a generic and universal quantity which does not depend on the driving protocol. Using this universal quantity, we calculate the arrest stress, , analytically based on a balance of the energy injection rate due to the external force driving the flow and the dissipation rate accounting for the rupture of capillary bridges. The resulting prediction of is a non-linear function of the packing fraction , and the capillary energy . This formula provides an excellent, parameter-free prediction of the numerical data. Corrections to the theory for small and large packing fractions are connected to the emergence of shear bands and of contributions to the stress from repulsive particle interactions, respectively.
pacs:
45.70.Mg, 62.20.M-, 45.05.+xI Introduction
Careful studies for dry granular materials suggest that the arrest of granular flow is universal in the sense that this non-equilibrium transition admits a continuum description. This points to the existence of an equation of state for dry granular matter GDR MiDi (2004); Desmond et al. (2013); da Cruz et al. (2005); Jop et al. (2006); Delannay et al. (2007); Forterre and Pouliquen (2008). Similarly, various features of phase transition in vertically agitated wet granular materials can faithfully be described in terms of thermodynamic concepts Scheel et al. (2004); Fingerle et al. (2008); Huang et al. (2009); Reller et al. (2011); Strauch and Herminghaus (2012).
Recently, a number of papers Rahbari et al. (2010); Huang et al. (2012); May et al. (2013); Roeller et al. (2014); Rahbari et al. (2013) also addressed phase transitions in sheared wet granular matter. In particular, the arrest of wet granular flows driven by external forces with a cosine profile was attributed to a crossover of the power injected into the flow by the external field and the power dissipated in the rupturing of capillary bridges Rahbari et al. (2010, 2013); Roeller et al. (2014).
This provided a quantitative description of the arrest of shear flows of bidisperse disks Rahbari et al. (2010) and dumbbells Rahbari et al. (2013) with a fixed density, and of three-dimensional gravity-confined flow of monodisperse grains Roeller et al. (2014). The studies established that the minimal external forcing required to maintain flow can be calculated along the same line for transitions in fixed-density and fixed-pressure settings. Also, for both wet disks and dumbbells, a large hysteresis was identified in which the fluid-to-solid arrest stress, , or the dynamic yield stress, has been found to be smaller than the solid-to-fluid yield stress, or the static yield stress. This is in accord with the conventional wisdom where the stress at yield point is conceived to be larger than the minimum (plastic) stress which is required to maintain the flow. Moreover, in a recent study, the difference of the static and dynamic yield stress is pinned down to the nonmonotonicity of the flow curves. Furthermore, it was shown that the nonmonotonicity of the flow curves indicates a shear banding instability Irani et al. (2014).
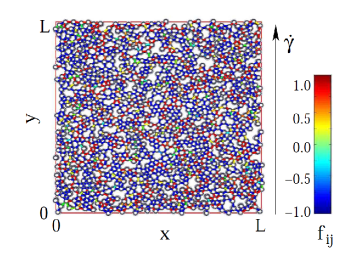
Here, we augment these studies by addressing the arrest stress in systems with a prescribed global shear rate, . Rather than settings with complex flow profiles we consider for our present study uniform shear flows in a Lees-Edwards Lees and Edwards (1972); Allen and Tildesley (1987) periodic boundary flow geometry (Fig. 1). This point of view is dual to the study of force-controlled systems where we prescribe a force amplitude and measure the minimal force required to sustain flow. In the present study we will address the arrest stress, i.e., the smallest value of the stress observed when decreasing the shear shear rate in spatially uniform granular flows. By definition of the stress tensor, the product of this arrest stress and the system size amounts to the minimal force that creeping flows with uniform shear profile exert on the borders of a shear cell. This correspondence provides a quantitative prediction of the arrest stress where the only adjustable parameters have been measured in the force-controlled setting Rahbari et al. (2010). The agreement provides further support for the modeling of the flow threshold based on energy dissipation arguments that were established in Rahbari et al. (2010); Roeller et al. (2014).
The present study is based on extensive simulations of a two dimensional wet granular material whose critical force for the arrest of flow has fully been characterized in Ref. Rahbari et al. (2010). In contrast to that previous work we address now Lees-Edwards shear flow. We determine the dependence of the arrest stress, , on the packing density, , and the capillary energy, .
The data are obtained by careful extrapolation of a sequence of numerical measurements of the stress for larger shear rates to vanishing , where we take care to base this extrapolation only on systems with uniform shear profiles. Requiring consistency with the setting where the flow is driven by an external force Rahbari et al. (2010), provides a parameter-free prediction of that is in excellent quantitative agreement with the numerical results.
The paper is organized as follows: In Sect. II we revisit the theory for the arrest of flow Rahbari et al. (2010), and adapt it to describe the arrest stress of a uniformly sheared system. Subsequently, in Sect. III, we describe our system, its equations of motion, the approach adopted to solve them numerically, and the data analysis. Sect. IV comprises the results on the shear-rate dependence of the stress, and its extrapolation to zero shear rate. We will demonstrate that for intermediate packing densities, , the parameter dependence of the arrest stress is faithfully described by the parameter free prediction derived in Sect. II, and trace down the additional physical processes causing the differences for small and large . Our main results are summarized in Sect. V.
II Predicting the Arrest Stress
We consider uniform shear in a two-dimensional system in a domain of size . By definition, the shear stress, , corresponds to a force required to act at the boundaries of the system in order to maintain the uniform flow. Following Rahbari et al. (2010) we identify the critical force persisting at very small shear rates based on a power balance of the work injected into, and dissipated in the system. Energy is dissipated by breaking capillary bridges spanning the stress network. Hence, the dissipated power takes the form
| (1) |
where is the energy needed to rupture a capillary bridge, and the average number of bridges ruptures when two disks pass in the shear flow. To arrive at the flow configuration (i) the spatial density of disks, , per unit length is the ratio of the total number of disks, , and the width, , of the system, and (ii) the shear rate is constant, const.
On the other hand, for a system with uniform density and shear the total injected power is the product of the off-diagonal element of the stress tensor, , the shear rate, , and the system area, ,
| (2) |
Flow ceases when the forcing injects too little energy to balance dissipation. The threshold value, , is obtained by balancing and ,
| (3) |
where is the areal density of disks.
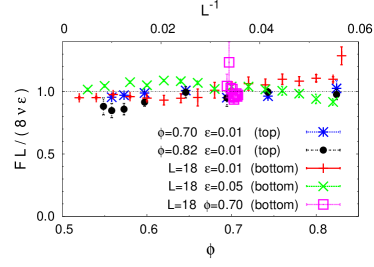
In this expression the number depends on the packing fraction, , and on the capillary energy, , because collective motion is needed when disks pass each other in a dense system—as initially discussed for a system where flow is driven by an external cosinus-shaped force field Rahbari et al. (2010). In Ref. Rahbari et al. (2010), based on systematic data collapses and heuristic scaling arguments, we have derived an explicit analytical formula for the dependence of the average bridge number, , on the packing fraction, , and the capillary energy, . As an alternative equation, in Fig. 2 we show that the data discussed in Rahbari et al. (2010) are also well described by the following equation
| (4) |
with .
In the following we explore in how far the prediction, Eq. (3), complemented with the expression, Eq. (4), provides a faithful description of the arrest stress in systems where the shear rate, , is prescribed.
III Numerical Method
We numerically solve Newton’s equation of motion of a 1:1 mixture of large and small disks moving in a two-dimensional domain of size subjected to Lees-Edwards boundary conditions Allen and Tildesley (1987) that enforce a prescribed total shear, , in the system. All velocities and forces are calculated based on the appropriate representation of the flow in the two-dimensional plane that is obtained by properly unfolding the Lees-Edwards boundary conditions (cf. Allen and Tildesley (1987)). Crystalline ordering is prevented by considering a 1:1 mixture of large and small disks with a ratio of their respective radii and O’Hern et al. (2003). The random-close packing limit of this mixture has been reported O’Hern et al. (2003); Xu et al. (2005) to be . We assume a constant mass per area, , such that the mass of disk is .
III.1 Equations of motion
We adopt a fifth-order predictor-corrector Gear algorithm Allen and Tildesley (1987); Press et al. (2002) to solve Newton’s equation of motion
| (5) |
where and are the mass and the center disk , respectively, is the set of neighbors interacting with , the unit vector points from the center of disk to the center of disk , and is the force exerted by disk on disk . The latter force comprises a repulsion, and whenever applicable also the attractive force, , modeling capillary bridges.
Mutual repulsion between the disks is modeled by the repulsive force
| (6a) | |||
| where is the Euclidean distance between he center of disk and . In the spirit of Hertz’s contact law Poeschel and Schwager (2005) we set | |||
| (6b) | |||
in order to account for different disk radii. The global parameter controls the hardness of the disks.
For the capillary bridges forces we engage the minimal capillary model proposed by Herminghaus in Ref. Herminghaus (2005) in which the capillary force is constant, , as the distance between granulates changes, and where it breaks at a distance . This model has been shown to be well-suited for numerical simulations of wet granular materials Roeller et al. (2014); Fingerle and Herminghaus (2006); Fingerle et al. (2008); Scheel et al. (2004). The force in this model is hysteretic: upon first approach there is no attractive force (); when the disks undergo collision () a constant (capillary) force is activated, and the force persists until the disks separate by a (surface-to-surface) distance (). At that point, , the capillary bridge is removed (it ‘ruptures’). There is no force acting between the disks again, until they undergo their next collision (). Consequently, an energy is dissipated after rupture of the capillary bridge.
Throughout this paper, we employ dimensionless rescaled quantities based on the capillary force, , the mass density of the disks, , and the average disk diameter . Time, , and mass, , is hence measured in units , and , respectively. Using these normalized quantities it is straightforward to normalize all physical quantities derived from mass, length and time, such as the local averages of disk velocities, components of the stress tensor, and the shear rate.
III.2 Data acquisition and analysis
For each parameter set we run simulations over a fixed total strain of . The choice to fix the total strain, rather than fixing the total simulation time, ensures that in the limit of very small flow rates we still sample a representative set of statistically uncorrelated disk configurations. We start to measure the physical quantities at the strain and take shots over the rest of the simulations until . Altogether these configurations for different runs provide independent snapshots for each considered parameter set. For each snapshot, we determine and store the components of the stress tensor, , as well as the average density, partial densities, and granular temperature evaluated in ten bands parallel to the shear.
The components of the stress tensor are calculated Lois et al. (2005); Rahbari et al. (2010, 2013) by evaluating
| (7) | |||||
In Eq. (7) denote the Cartesian components of the respective vectors or tensors. The stress tensor has two contributions: (I) the first term accounts for advective momentum transport, where , is the velocity of the disk , and is the local drift velocity at the position of disk , i.e., the overall center-of-mass velocity of the disks with centers in an interval of width containing . (II) the second term describes the contribution of the interaction forces between particles on the stress to the flux of linear momentum. In this contribution is the vector connecting the centers of disk and , and is the force exerted by the disk on disk . In the limit of small shear rates, , one approaches creep flow, and the latter term in Eq. 7 always dominates the shear stresses.
For non-Newtonian fluids, the relationship between the shear stress, , and the shear rate, , is given by Herschel-Bulkley relation Herschel and Bulkley (1926):
| (8) |
where, , is the arrest (yield) stress, , is a constant, and, , is the shear thinning exponent. According to a recent review by Bonn et al. Bonn et al. (2015), the shear thinning exponent is a material dependent parameter for which no universality has been found. Therefore, Eq. 8 would be a natural choice to be considered as a template function for experimental data fitting. However, we found out that when the shear thinning exponent, , is variable, for large capillary energies, , the fitting algorithm frequently takes very small exponents in the order of . This very small exponent gives rise to a flow profile which is very steep near the origin. As a result of the sharp fall near the origin, it becomes more likely that the fitting algorithm grasps a negative offset. The negative offset corresponds to a negative arrest (yield) stress, , which is non-physical. In order to prevent this fitting failure, it is required that the final fitting flow profile should be smooth at the origin. This is guaranteed by enforcing . To be consistent, we choose a quadratic profile, , which is the most trivial choice given by the Bagnold scaling Vøagberg et al. (2014); Irani et al. (2014).
III.3 Uniform shear profiles
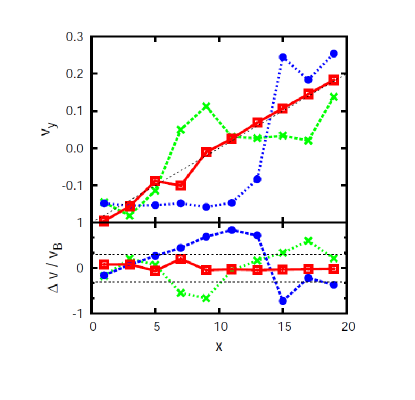
In the analysis of the arrest stress we systematically disregard all the snapshots where the velocity profile deviates by more than a factor of from the ideal linear case
| (9) |
hence excluding phase-separated states (cf. Fig. 3). The ratio at which the snapshots are disregarded from further analysis strongly depends on the packing fraction, . The higher the packing fraction, the lower the exclusion ratio. As an example, for , the rejection ratio is approximately , and for , it is about .
The lower panel of Fig. 3 shows the respective relative deviations from the ideal profile in order to exemplify the criterion for the selection of valid flow configurations. Flow configuration with deviations of the average flow velocities from the ideal profile (the thin dotted line in the upper panel of the figure) up to % commonly appear as fluctuations on statistically uniform shear profiles: these flow configurations will enter the analysis of the arrest stress. On the other hand, larger fluctuations rapidly evolve into shear bands that are persistent in time—once they appear, they do not decay again. The green crosses and blue circles, that are connected by broken lines in according color in Fig. 3, show profiles where the system has formed a shear band. In that case the deviations lie noticeably outside the admissible range, and they persist: the system has phase separated into two domains of almost constant drift velocity; localizing the shear in narrow bands that lie at (green crosses) and (blue circles), respectively. These configurations must be excluded from the analysis because they show a region with a very low (often zero) number of capillary bridges, and hence anomalously low shear stress.
IV Results and Discussion
 |
IV.1 Shear-rate dependence of the arrest stress
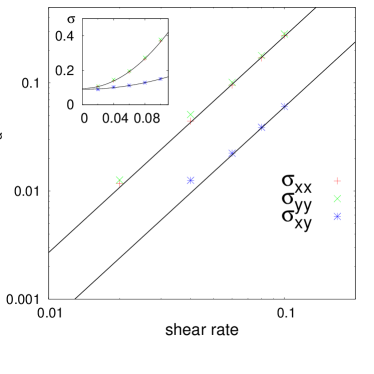
In Fig. 4-Inset, we show the dependence of the components of the stress tensor on the shear rate . The diagonal elements of the stress tensor, and , are depicted by red pluses and green crosses, respectively, and the blue stars show the off-diagonal element . All curves show finite offsets at . The solid lines show the best fits by quadratic functions , where accounts for the non-vanishing stress at zero shear rates, and is the Bagnold scaling expected to arise at large Vøagberg et al. (2014); Irani et al. (2014). In the main panel of Fig. 4, we verify this quadratic scaling for large by plotting the components of on a double logarithmic scale. The offset of the off-diagonal element provides the arrest stress, . It is an intensive parameter of the system that does not depend on the system size. However, clearly, the components of and are functions of the density, , and the capillary energy, .
IV.2 Parameter dependence of
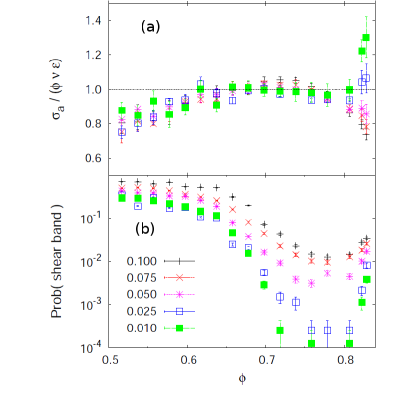
Fig. 5-a demonstrates our data collapse according to Eq. (3) for the dependence of the arrest stress, , on the packing fraction, , for five different capillary energies, . For we find an excellent agreement between our data and the prediction shown by the dotted line.
The data collapse is breaking down upon approaching the random close packing limit for values . We expect that in this range the repulsive forces gives rise to an additional contribution to the stress, as observed in Irani et al. (2014).
For the values of systematically fall below the prediction, Eq. (3). This systematic error results from the choice of the function selected for extrapolating the dependence of to small : it does not account for the slight decrease of for small values of in the regime where one expects shear banding (cf. for instance Fig. 1 of Irani et al. (2014)). As shown in the main panel of Fig. 4 there always is a small mismatch of the simulation data and the fit function for small . We still adopted the function because it involves fewer parameters and results in a more robust fitting of our data. To within our numerical error margins the systematic error in the fit is negligible for , where the dip becomes so minute that shear banding is no longer encountered. On the other hand, for the fit provides a value characterizing the minimum of rather than the asymptotic value for vanishing . When this distinction becomes noticeable the system becomes prone to shear banding ( Fig. 5-b).
V Conclusions
We calculated the arrest stress, , characterizing the minimal value of for two-dimensional isotropic shear flows of wet granular disks by fitting the components of the stress tensor by a quadratic functions, . In the range , all components of the stress tensor of wet granular materials approach non-trivial finite values for small . The resulting offset value for the shear stress is of particular interest. In general it is different from the static yield stress, , that can be obtained Irani et al. (2014) by considering the limit . The latter characterizes the stress where a system at rest can start to flow. In the case of wet granular materials, the static yield stress is the force which is needed to break down the percolation network of capillary bridges. The former, i.e., the dynamic yield stress, is the minimal value of the stress which is required to maintain the flow.
The prediction of the arrest stress is based on a balance of the power injected by increasing strain at a finite stress and the energy dissipation due to rupturing capillary bridges. For uniform shear this argument provides Eq. (3). This prediction has a single free parameter, the average number, , of bridges ruptures when particles pass each other in the flow. We have determined this number Rahbari et al. (2010) in the context of a different flow, non-uniform shear flow driven by an external force field in periodic boundary conditions. Evoking universality of the number, , with respect to the cause of the flow provides a prediction of the arrest stress without adjustable parameters. The excellent data collapse shown in Fig. 5-a confirms the versatility of this approach to determine the arrest of flow Rahbari et al. (2010, 2013); Roeller et al. (2014), and the universality of as far the protocol of inducing the flow are concerned. The difference between our prediction, Eq. (3), and the numerical findings for have been associated to the emergence of contributions to the stress from repulsive forces when approaching random close packing. The systematic difference for is due to a noticeable deviation of the arrest stress from the static yield stress. The larger the difference, the more likely the flow will phase separate into a state featuring shear bands (cf. Fig. 5-b).
Previous studies of far-from equilibrium transitions in wet granular materials have unraveled origins of these transitions to be either force- or energy-driven Strauch and Herminghaus (2012); Fingerle et al. (2008). For instance, for wet granulates in a Petri dish under vertical vibration, solid-to-fluid (fluid-to-gas) transition is force-driven (energy-driven). In sheared wet granular matter, the solid-to-fluid transition, whose threshold represents the static yield stress, has been shown to be of force-driven origin Rahbari et al. (2009)
The present work complements and further substantiates the findings of previous studies Rahbari et al. (2010, 2013); Roeller et al. (2014) that attributed the fluid-to-solid transition in sheared wet granular systems is connected to a balance of the power injected by the forcing of the flow and the energy dissipation rate due to rupturing of capillary bridges in a plastic shear flow (energy-driven). This mechanism is fundamentally connected to the fact that wet granular materials have an inherent energy scale, the energy that is dissipated upon rupturing a capillary bridge Scheel et al. (2004); Herminghaus (2005). It will be interesting to explore the impact of this important distinction for other soft matter systems Lois et al. (2008); Pinaki et al. (2012); Irani et al. (2014) where small attractive interactions and a dissipation due to transfer of kinetic energy into internal degrees of freedom of the system should admit a corresponding analysis of the arrest of flow.
This is in contrast to dry granular materials where the arrest of flow is expected to be controlled by frictional forces between the particles.
Acknowledgements.
We would like to thank M. Akbari-Moghanjoughi for his comments. S.H.E.R. is financially supported by the Iran National Science Foundation (INSF) Grant No. 90004064.References
- GDR MiDi (2004) GDR MiDi, Eur. Phys. J. E 14, 341 (2004).
- Desmond et al. (2013) K. W. Desmond, U. Villa, M. Newey, and W. Losert, Phys. Rev. E 88, 32202 (2013).
- da Cruz et al. (2005) F. da Cruz, S. Emam, M. Prochnow, J.-N. Roux, and F. Chevoir, Phys. Rev. E 72, 21309 (2005).
- Jop et al. (2006) P. Jop, Y. Forterre, and O. Pouliquen, Nature 441, 727 (2006).
- Delannay et al. (2007) R. Delannay, M. Louge, P. Richard, N. Taberler, and A. Valance, Nature Mater. 16, 99 (2007).
- Forterre and Pouliquen (2008) Y. Forterre and O. Pouliquen, Annu. Rev. Fluid Mech. 40, 1 (2008).
- Scheel et al. (2004) M. Scheel, D. Geromichalos, and S. Herminghaus, J. Phys. Cond. Mat. 16, S4213 (2004).
- Fingerle et al. (2008) A. Fingerle, K. Roeller, K. Huang, and S. Herminghaus, New J. Phys. 10, 053020 (2008).
- Huang et al. (2009) K. Huang, M. Sohaili, M. Schröter, and S. Herminghaus, Phys. Rev. E 79, 010301(R) (2009).
- Reller et al. (2011) K. Reller, J. P. D. Clewett, R. M. Bowley, S. Herminghaus, and M. R. Swift, Phys. Rev. Lett. 107, 048002 (2011).
- Strauch and Herminghaus (2012) S. Strauch and S. Herminghaus, Soft Matter 8, 8271 (2012).
- Rahbari et al. (2010) S. H. E. Rahbari, J. Vollmer, S. Herminghaus, and M. Brinkmann, Phys. Rev. E 82, 061305 (2010).
- Huang et al. (2012) K. Huang, M. Brinkmann, and S. Herminghaus, Soft Matter 8, 11939 (2012).
- May et al. (2013) C. May, I. Rehberg, and K. Huang, Phys. Rev. E 88, 062201 (2013).
- Roeller et al. (2014) K. Roeller, J. Blaschke, S. Herminghaus, and J. Vollmer, J. Fluid Mech. 738, 407 (2014), eprint 1210.3247.
- Rahbari et al. (2013) S. H. E. Rahbari, M. Khadem-Maaref, and S. K. A. S. Yaghoubi, Phys. Rev. E 88, 042203 (2013).
- Irani et al. (2014) E. Irani, P. Chaudhuri, and C. Heussinger, Phys. Rev. Lett. 112, 188303 (2014).
- Lees and Edwards (1972) A. W. Lees and S. F. Edwards, J. Phys. C: Solid St. Phys. 5, 1921 (1972).
- Allen and Tildesley (1987) M. P. Allen and D. J. Tildesley, Computer simulation of liquids (Oxford UP, 1987).
- O’Hern et al. (2003) C. O’Hern, L. Silbert, A. Liu, and S. Nagel, Phys. Rev. E 68, 011306 (2003).
- Xu et al. (2005) N. Xu, C. S. O’Hern, and L. Kondic, Phys. Rev. Lett. 94, 016001 (2005).
- Press et al. (2002) W. H. Press, S. A. Teukolsky, W. T. Vetterling, and B. P. Flannery, Numerical Recipes in C++: The Art of Scientific Computing (Cambridge University Press, Cambridge UK, 2002).
- Poeschel and Schwager (2005) T. Poeschel and T. Schwager, Computational granular dynamics (Springer, 2005).
- Herminghaus (2005) S. Herminghaus, Adv. Phys. 54, 221 (2005).
- Fingerle and Herminghaus (2006) A. Fingerle and S. Herminghaus, Phys. Rev. Lett. 97, 078001 (pages 4) (2006).
- Lois et al. (2005) G. Lois, A. Lemaitre, and J. M. Carlson, Phys. Rev. E 72, 051303 (2005).
- Herschel and Bulkley (1926) W. Herschel and R. Bulkley, Kolloid Zeitschrift 39, 291 (1926).
- Bonn et al. (2015) D. Bonn, J. Paredes, M. M. Denn, L. Berthier, T. Divoux, and S. Manneville (2015), arXiv:1502.05281v1.
- Vøagberg et al. (2014) D. Vøagberg, P. Olsson, and S. Teitel, Phys. Rev. Lett. 113, 148002 (2014).
- Rahbari et al. (2009) S. H. E. Rahbari, J. Vollmer, S. Herminghaus, and M. Brinkmann, Europhys. Lett. 87, 14002 (2009).
- Lois et al. (2008) G. Lois, J. Blawzdziewicz, and C. S. O’Hern, Phys. Rev. Lett. 100, 028001 (2008).
- Pinaki et al. (2012) C. Pinaki, B. Ludovic, and B. Lydéric, Phys. Rev. E 85, 021503 (2012).