Photometry and dynamics of the minor mergers AM 1228-260 and AM 2058-381
Abstract
We investigate interaction effects on the dynamics and morphology of the galaxy pairs AM 2058-381 and AM 1228-260. This work is based on images and long-slit spectra obtained with the Gemini Multi-Object Spectrograph at the Gemini South Telescope. The luminosity ratio between the main (AM 2058A) and secondary (AM 2058B) components of the first pair is a factor of 5, while for the other pair, the main (AM 1228A) component is 20 times more luminous than the secondary (AM 1228B). The four galaxies have pseudo-bulges, with a Sérsic index . Their observed radial velocities profiles (RVPs) present several irregularities. The receding side of the RVP of AM 2058A is displaced with respect to the velocity field model, while there is a strong evidence that AM 2058B is a tumbling body, rotating along its major axis. The RVPs for AM 1228A indicate a misalignment between the kinematic and photometric major axes. The RVP for AM 1228B is quite perturbed, very likely due to the interaction with AM 1228A. NFW halo parameters for AM 2058A are similar to those of the Milky Way and M 31. The halo mass of AM 1228A is roughly 10% that of AM 2058A. The mass-to-light (M/L) of AM 2058 agrees with the mean value derived for late-type spirals, while the low M/L for AM 1228A may be due to the intense star formation ongoing in this galaxy.
keywords:
galaxies: general – galaxies: interactions – galaxies: kinematics and dynamics – galaxies: photometry1 Introduction
Within the CDM cosmology framework, mergers or interactions play a fundamental role in the formation, growth and subsequent galactic evolution (e.g., Somerville, Primack & Faber, 2001; Hopkins et al., 2010, and references therein). Indeed, as shown in merger trees of hierarchical models of galaxy formation, the galactic growth is driven by accretion of other galaxies, most often minor companions (e.g., Cole et al., 2000; Wechler et al., 2002; Bédorf & Portegies Zwart, 2012). Despite their importance, these minor mergers have been less studied than major merger interactions (Schwarzkopf & Dettmar, 2000). From the observational point of view, the statistical samples show a bias favouring major mergers, due to the large magnitude differences between galaxies and the magnitude limit set by redshift (Woods & Gueller, 2007). On the other hand, numerical simulations also show a trend to study major interactions, since the computational cost is larger for minor mergers, due to the higher resolution required to model the small companions (Hernquist & Mihos, 1995; Barnes & Hibbard, 2009).
Nevertheless, there have been significant advances in understanding minor mergers. For instance, numerical simulations indicate that they can trigger star formation and transform the morphologies of galaxies (e.g., Mihos & Herquist, 1994; Hernquist & Mihos, 1995; Naab & Burkert, 2003; Cox et al., 2008; Qu et al., 2011). These results have been confirmed by observational studies (e.g., Larson & Tinsley, 1978; Kennicutt et al., 1987; Donzelli & Pastoriza, 1997; Barton et al., 2000; Lambas et al., 2003; Woods & Gueller, 2007; Lambas et al., 2012).
On the other hand, minor mergers are also recognized as potential agents to drive the morphological evolution of galaxies. For example, as a result of a satellite accretion, the galactic discs can become warped and heated (e.g., Quinn, Herquist, & Fullagar, 1993; Walker, Mihos & Herquist, 1996) or inner structures can be created, such as discs, rings and spiral arms (e.g., Eliche-moral et al., 2011). Furthermore, the interaction with a small companion can generate all kinds of phenomenons seen in majors cases, such as tidal tails, bridges, rings, as well as form or destruct bars or spiral arms (e.g., Salo & Laurikainen 1993; Mihos & Bothun 1997; Rodrigues et al. 1999; Díaz et al. 2000; Thies & Kohle 2001; Krabbe et al. 2008, 2011). In addition, the velocity fields of the large galaxy often shows asymmetries and irregularities due to the interaction with the smaller companion (e.g., Rubin et al., 1991, 1999; Dale et al., 2001; Mendes de Oliveira et al., 2003; Fuentes-Carrera et al., 2004; Krabbe et al., 2008; Hernandez-Jimenez et al., 2013). Such distortions are seen in the rotation curves as significantly rising or falling profiles on the side pointing towards the companion galaxy, or pronounced velocity bumps, which are stronger at perigalacticum passages and decline 0.5 Gyr after that (Kronberger et al., 2006).
The kinematic and photometric effects caused by minor mergers strongly depend on structural parameters, such as morphological type (bulge, disc, bar, etc.), baryonic-to-dark mass ratios, and orbital parameters, such as retrograde, prograde, inclination and coplanar orbits (Hernquist & Mihos, 1995; Berentzen et al., 2003; Cox et al., 2008; Eliche-moral et al., 2011). Thus, obtaining photometric and kinematic informations on minor merger systems is useful for understanding the effects that interaction may have on each component. The decomposition of the surface brightness profile can be used to infer the stellar mass distribution. Rotation curves are used to constrain models of dark matter distribution (van Albada et al., 1985; Carignan, 1985; Kent, 1987; Blais-Ouellette et al., 2001).
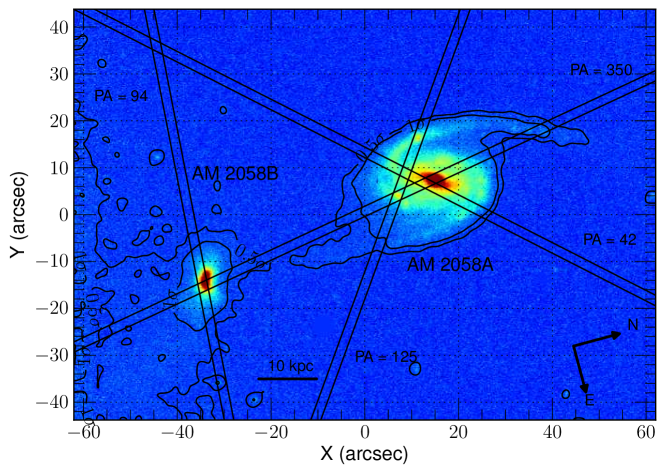
In order to investigate the interaction effects on kinematic and photometric properties of minor merger components, we have selected several systems from Donzelli & Pastoriza (1997) and Winge et al. (in preparation) samples of interacting galaxies taken from the Arp-Madore catalogue (Arp & Madore, 1987). These pairs consist of a main galaxy (component A) and a companion (component B) that has about half or less the diameter of component A. The pairs lack basic information, such as morphological types, magnitudes and redshifts. Optical spectroscopic properties (e.g, star formation rates, diagnostic diagrams, stellar population) of these samples have been already studied by Donzelli & Pastoriza (1997), Pastoriza, Donzelli & Bonatto (1999) and Winge et al. (in preparation). From their samples, we have selected systems in which the main component has a well-defined spiral structure, so that the effect of the interaction in the arms is easily seen, and the galactic disc has an inclination () with respect to the plane of the sky of 30°70°. In addition, these systems have different separations between the components, morphological distortions and likely interaction stages. Long-slit spectroscopy and images of these systems were obtained with the Gemini Multi-Object Spectrograph (GMOS) at Gemini South Telescope. Previous results from this project have been presented for the systems AM 2306-721 (Krabbe et al., 2008), AM 2322-821 (Krabbe et al., 2011) and AM 1219-430 (Hernandez-Jimenez et al., 2013). Along these works, we have developed a robust methodology to obtain the kinematic and photometric properties of the galaxies in minor mergers. Such properties are valuable constraints for numerical simulations in case studies in order to understand the specific mechanisms that drive the collision in an interaction of unequal mass galaxies. In this paper, we present the results for two other pairs, AM 2058-381 from Donzelli & Pastoriza (1997), and AM 1228-260 from Winge et al. (in preparation). Fig. 1 shows the images of both pairs. These systems show different projected separations between the pair members. For AM 2058-381, there is a projected distance between galaxy centres of 43.3 kpc ( 4.4 diameters of the main galaxy), while for AM 1228-260, the projected distance is 11.9 kpc ( 2 diameters of the main galaxy).
AM 2058-381 is composed by a large spiral galaxy (hereafter AM 2058A) with two arms, and a small peanut shape companion (hereafter AM 2058B) (Fig. 1). Ferreiro & Pastoriza (2004) found that AM 2058A presents bright \textH ii regions distributed along the spiral arms. The ages of these regions are in the range of yr (Ferreiro, Pastoriza & Rickes, 2008). The integrated colours of AM 2058A and AM 2058B are rather blue with (BV) = 0.6 and (BV) = 0.4, respectively, indicating an enhancement of star formation in both galaxies. Krabbe et al. (2014) studied the electron density for this system, and found a wide variation of the electron density across AM 2058A with cm-3. On the other hand, for AM 2058B the electron densities are relatively low, with a mean value of cm-3, which is compatible with that found for giant extragalactic \textH ii regions. The metallicity gradient in AM 2058A has a shallow slope when compared with those of typical isolated spiral galaxies (Rosa et al. 2014). Such flat metallicity gradient has been found in several interacting galaxies (e.g., Krabbe et al., 2008; Kewley et al., 2010; Krabbe et al., 2011; Rosa et al., 2014), and may result from the interaction that induces gas inflow from the external disc towards the central region of the galaxies (Dalcanton, 2007; Perez, Michel-Dansac & Tissera, 2011).
AM 1228-260 is composed by a large barred spiral (hereafter AM 1228A) and a dwarf galaxy (hereafter AM 1228B) (see Fig. 1). The main galaxy is classified as an extreme IRAS galaxy (van den Broek et al., 1991), with far-infrared luminosity , and a high luminosity ratio, , indicating intense star formation activity. In addition, images of this system show the main galaxy with luminous \textH ii regions along to the spiral arms, while the secondary galaxy looks like an irregular galaxy with two dominant \textH ii regions. Both galaxies are also rather blue with (BV) = 0.52 and (BV) = 0.66 for AM 1228A and AM 1228B, respectively.
This paper is organized as follows: in Sect. 2 we provide details on the observations and data reduction, photometric calibrations, and image restoration. Sect. 3 gives the integrated magnitudes of the galaxies, and describes the morphological analysis and the photometric decomposition of the surface brightness profiles. Sect. 4 describes the gas kinematics. In Sect. 5, we present the bulge, disc and halo components used to model the velocity field. In Sect. 6, we discuss the fit to the velocity field and its results, such as mass distribution in the galaxies, and the determination of the mass-to-light (M/L) ratio of each component and halo parameters. Finally, the conclusions are summarized in Sect. 7. Throughout this paper, we adopt the Hubble constant as =73 km s-1 Mpc-1 (Spergel et al., 2007).
2 Observations and data reduction
| Galaxy | Date (UT) | Exp. time (s) | Filter | (Å) |
|---|---|---|---|---|
| AM 2058-381 | 2007–05–11 | 340 | (G0326) | 4562–6980 |
| AM 1228-260 | 2011–03–20 | 230 | (G0326) | 4562–6980 |
| 2011–03–29 | 130 | (G0326) | 4562–6980 | |
| 2011–04–14 | 230 | (G0326) | 4562–6980 | |
| 2011–04–15 | 130 | (G0326) | 4562–6980 |
| Galaxy | Date (UT) | Exp. time (s) | PA (°) | (Å) |
|---|---|---|---|---|
| AM 2058-381 | 2007–05–20 | 4600 | 42 | 4280–7130 |
| 2007–05–24 | 4600 | 125 | 4280–7130 | |
| 2007–05–26 | 4600 | 94 | 4280–7130 | |
| 2007–05–30 | 4600 | 350 | 4280–7130 | |
| AM 1228-260 | 2011–03–20 | 2900 | 319 | 4449–7312 |
| 2011–03–20 | 2900 | 315 | 4449–7312 | |
| 2011–03–29 | 2900 | 20 | 4449–7312 | |
| 2011–04–14 | 2900 | 10 | 4449–7312 |
This paper is based on images and long-slit spectra obtained with the GMOS at Gemini South Telescope, as part of the poor weather programmes GS-2007A-Q-76 and GS-2011A-Q-90.
Imaging and spectroscopic data reductions were carried out using the gemini.gmos package as well as generic iraf111iraf is distributed by the National Optical Astronomy Observatories, which is operated by the Association of Universities for Research in Astronomy, Inc. (AURA) under cooperative agreement with the National Science Foundation. tasks.
As part of the standard target acquisition procedure, we obtained sets of short exposure time images. The journal of observations is presented in Table 1. The images were binned by 2 pixels, resulting in a spatial scale of 0.146 arcsec pixel-1. They were processed using standard procedures (bias subtraction and flat-fielding) and combined to obtain the final images. The seeing was calculated using gemseeing task of gemini.gmos package. This task derives the median value of the full width high maximum for the fields star in the observed images by fitting a Moffat profile. Delivered image quality of and arcsec were estimated for combined final images of AM 2058-381 and AM 1228-260, respectively.
Spectra were obtained with the B600 grating plus the 1 arcsec slit, which gives a spectral resolution of 5.5 Å. The frames were binned on-chip by 4 and 2 pixels in the spatial and wavelength directions, respectively, resulting in a spatial scale of 0.288 arcsec pixel-1, and dispersion of 0.9 Å pixel-1.
Spectra at four different position angles (PAs) were taken for each system. Fig. 1 shows the slit positions over-plotted on images for AM 2058-381 (top panel) and AM 1228-260 (bottom). Dates, exposure times, PAs and spectral ranges of spectroscopic observations are listed in Table 2. Exposures times were limited to minimize the effects of cosmic rays, and several frames were obtained for each slit position to achieve high signal-to-noise ratio.
We followed the standard procedure for spectroscopy reduction by applying bias correction, flat-fielding, cosmic ray cleaning, sky subtraction, wavelength and relative flux calibrations. In order to increase the signal-to-noise ratio, the spectra were extracted by summing over four rows. Thus, each spectrum represents an aperture of 1 1.17 arcsec2.
The distance to each galaxy pair was taken as the radial velocity measured at the nucleus of the main component (see Sect. 4). We obtained distances of 167 and 80 Mpc for AM 2058-381 and AM 1228-260, respectively; thus, the apertures samples regions of 809 946 pc2 and 388 454 pc2 for each pair, respectively.
2.1 Photometric calibration
Since the data were taken in non-photometric conditions, foreground stars from United States Naval Observatory-B1.0 Catalogue (USNO-B; Monet et al., 2003) present in the field-of-view of the images, were used to calibrate the data. Point spread function (PSF) photometry of these stars was performed using the psf task within iraf/daophot. We applied the bandpass transformation given by Monet et al. (2003) to convert the J and F photographic magnitudes to magnitude in the Sloan Digital Sky Survey (SDSS) photometry system. Then, the zero-points for the image were found to be and for AM 2058-381 and AM 1228-260, respectively.
2.2 Sky background
The sky background levels of the images were adopted as the mean value of several boxes of pixels, located far from stars and galaxies in the field-of-view. The statistical standard deviation () of the sky background around the mean value was also computed for these regions, to be used as an estimate of the sky noise, and we adopt the value of 1 to define the limiting detection level for each system. Table 3 shows the detection limits, in magnitudes per square arc-second, of the images measured at 1, 2, and 3 for pairs AM 2058-381 and AM 1228-260.
2.3 Image restoration
One way to enhance star-forming features and morphological structures in images is by means of image restoration. In this work, we use the Lucy–Richardson (L-R) algorithm (Richardson, 1972; Lucy, 1974) to deconvolve the images. Hernandez-Jimenez et al. (2013) applied this algorithm with success on images of the pair AM 1219-430 to resolve candidates star-formation knots in several \textH ii regions. With respect to the procedure, we obtained a PSF model for the images, and used the lucy task within iraf/stsdas. The restored data were properly normalized, and the integrated flux in the image was conserved. Like any restoration technique, the L-R algorithm can introduce spurious information. One of those well know artefacts is the appearance of a negative moat around very high contrast point sources (Pogge & Martini, 2002). This effect is a problem for images with strongly saturated nuclei, which is here the case of the nucleus of AM 1228A. Therefore, the image for this galaxy was not restored. The deconvolved images for AM 2058A, AM 2058B and AM 1228B are shown in the left-panels of Fig. 2. As described above, the star-forming regions and substructures were enhanced in the images of all galaxies, particularly, the bright bar shows up in the restored image of AM 2058A.
| Galaxy | 1 | 2 | 3 |
|---|---|---|---|
| AM 1228-260 | 23.32 | 22.57 | 22.13 |
| AM 2058-381 | 22.91 | 22.16 | 21.72 |
3 Photometric Analysis
Tidal structures found in pairs are important clues to trace galactic encounter, as well as of the internal structure of the galaxy. They also serve for these systems as constraint to a numerical simulation. In order to detect tidal structures, we plot isophotes with different levels over the images (see Fig. 1). We found for AM 1228-260, at 1 brighter than the sky background, a common isophote enclosing the members. This tidal structure is broken up at 5 in individual isophotes for each galaxy. On the other hand, the pair AM 2058-381 does not show any connecting structure between the members above the 1 level. However, by relaxing the above criteria of 1 as detection limit, we found that the main galaxy shows two symmetric long tidal tails at the 0.5 level, as shown in Fig. 1 (top panel).
Table 4 lists the integrated apparent () magnitudes for the individual galaxies. For the AM 1228-260 system, the magnitudes of the components A and B were obtained by integrating the flux inside the isophote at a 5 level above the sky background, thus excluding the common envelope contribution. For the AM 2058-381, the magnitudes of the components were estimating integrating all flux above the 1 level of the sky background. The surface brightness of those limiting isophotes (5 and 1 , respectively) is also given in Table 4 as . The absolute magnitudes () were corrected for the Galactic extinction using the infrared-based dust map from Schlafly & Finkbeiner (2011), and the luminosities () were estimated by adopting the solar absolute magnitude of 4.76 (Blanton et al., 2003). The total luminosities of these systems, obtained integrating all light above the sky background, correspond to and for AM 2058-381 and AM 1228-260, respectively.
| Galaxy | () | |||
|---|---|---|---|---|
| AM 2058A | 14.09 | 22.91 | ||
| AM 2058B | 15.88 | 22.91 | ||
| Tidal tails | 16.74 | 23.63 | ||
| AM 1228A | 13.24 | 21.58 | ||
| AM 1228B | 16.58 | 21.58 | ||
| Envelope | 14.27 | 23.32 | ||
| MW(a) | - | - | ||
| LMC(a) | - | - | ||
| SMC(a) | - | - |
Note: (a) values taken from Robotham et al. (2012).
We compared the photometric luminosities of our systems with those of a well known minor merger, the Milky Way (MW) and Large and Small Magellanic Clouds (LMC and SMC). Their absolute magnitudes and luminosities are also listed in Table 4. AM 2058A is twice more luminous than the MW, while AM 2058B is about five times more luminous than the LMC. Thus, this pair is a very luminous minor merger when compared to the MW system. In contrast, the main and secondary galaxies in the AM 1228-260 system present luminosities similar to the MW and LMC, respectively.
Comparing the luminosities of the components in both systems, we found that the secondary galaxy in AM 1228-260 has 5% of the luminosity of the main galaxy in this pair, making it similar in terms of luminosity and projected distance ( kpc, or about two diameters of the main galaxy), to the barred spiral NGC 1097 and its small companion (García-Barreto, Carrilo & Vera-Villamizar, 2003). For AM2058-381, the secondary is much brighter, reaching 20% the luminosity of the main component.
The magnitudes of the tidal structures in AM 1228-260 and AM 2058-260 have been obtained by integrating the flux between the 1 –5 and 0.5 –1 isophotes, respectively (Table 4). The contribution of the tidal structures to the total luminosity of the systems are 20 and 5% for AM 1228-260 and AM 2058-260, respectively. The contribution to the total luminosity of the tidal structure of the first pair is comparable with the tidal tails of the Antennas pair (NGC 4038/4039) (Hibbard et al., 2001).
3.1 Symmetrization method
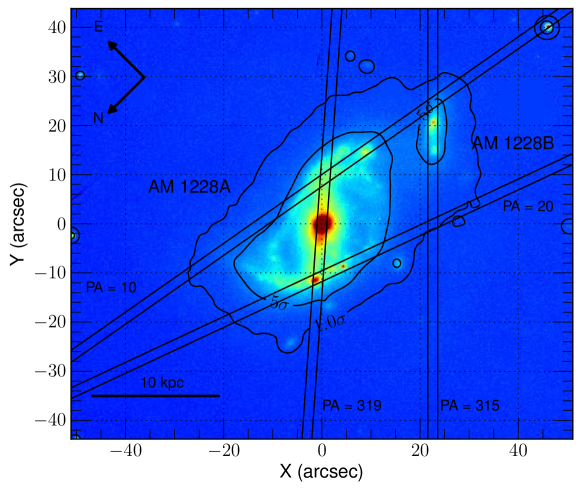
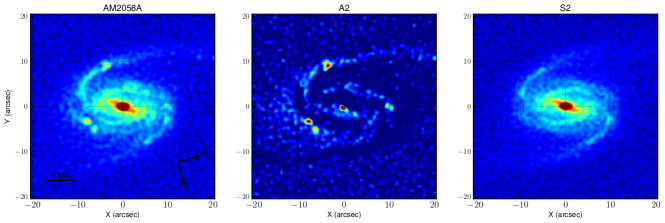
In order to subtract the morphological perturbations induced by the interaction, we used the symmetrization method of Elmegreen, Elmegreen & Montenegro (1992) and the procedure outlined by Hernandez-Jimenez et al. (2013). The method retrieves the two-fold symmetric and asymmetric aspects of the spiral galaxy pattern by making successive image rotations and subtractions. The asymmetric image (hereafter ) is obtained by subtracting from the observed image the same image rotated by . On the other hand, the symmetric image (hereafter ) is obtained by subtracting the asymmetric image from the observed one. The image would reveal the non-perturbed spiral pattern and disc. Figure 2 shows the deconvolved images of the galaxies, the and images.
The image of AM 2058A shows a tidal arm to the west and a pseudo-ring in the disc, as well as three large \textH ii region complexes. The brightest one is on the tidal arm, while the others are in the South-East part of the ring. On the other hand, the image presents two symmetric arms, starting in the outer part of the disc. The image reveals a faint ring around the bar. The analysis of the surface brightness profile confirms the existence of that structure (Sect. 3.2).
The image of AM 2058B reveals three high surface brightness knots. The one located at 1.42 kpc W of the galaxy nucleus is very luminous when compared to the other two. The image “digs up” the disc structure and a boxy pseudo bulge.
The image of AM 1228A shows a distorted ring around a bar, as well as an over-density in the North-West part of the bar. The over-density at North of the bulge might be a giant \textH ii region. The image allows us to correctly classify the morphological type as ovally distorted barred spiral SABc. On the other hand, the image of AM 1228B shows a very conspicuous North-West \textH ii region at 2.7 kpc from the nucleus. We also see at North in this image, part of the weak common structure of the members. The image reveals the underlying disc and bulge for this galaxy.


The correct determination of the inclination and orientation of a galactic disc is not a straightforward task (e.g., Grosbol, 1985; Barberà, Athanassoula & García-Gómez, 2004), and even more difficult for interacting systems due to the morphological perturbations. One advantage of the symmetrization method is that the images help to reveal the underlying galaxy disc. From those, we adopted as the position angle (PA) and inclination of the discs, the mean of the respective values of the most external isophotes. The calculated values are listed in Table 5. Another advantage of the images is that they allow for a more clear classification of the morphological type of the galaxies from the non-perturbed structures. The main components, AM 2058A and AM 1228A can both be classified as Sc galaxy types (AM 1228A is further identified as a SABc, as discussed above), while the secondary components, AM 2058B and AM 1228B, are S0 and Sd types, respectively.
| Galaxy | (°) | PA (°) |
|---|---|---|
| AM 2058A | ||
| AM 2058B | ||
| AM 1228A | ||
| AM 1228B |
3.2 Light profiles
In order to derive the surface brightness profiles of the images, we used the ellipse task of iraf/stsdas (Jedrzejewski, 1987) and followed the same procedure as Hernandez-Jimenez et al. (2013), which is based on the methodology of Cabrera-Lavers & Garzón (2004). ellipse fits the isophotal contours with a mean ellipse, parametrized with values of PA, ellipticity and coordinates of the centre. The best fits were achieved by fixing the centre positions. During the fitting process, we adopted a clipping factor of 20% for the brightest pixels in each annulus to avoid pixels of star formation regions. We also visually inspected the ellipse fits to each galaxy to insure that the position angle at a given semi-major radius was not artificially twisted by any star formation region, and we noted that 20% clipping was good enough to isophote fit.
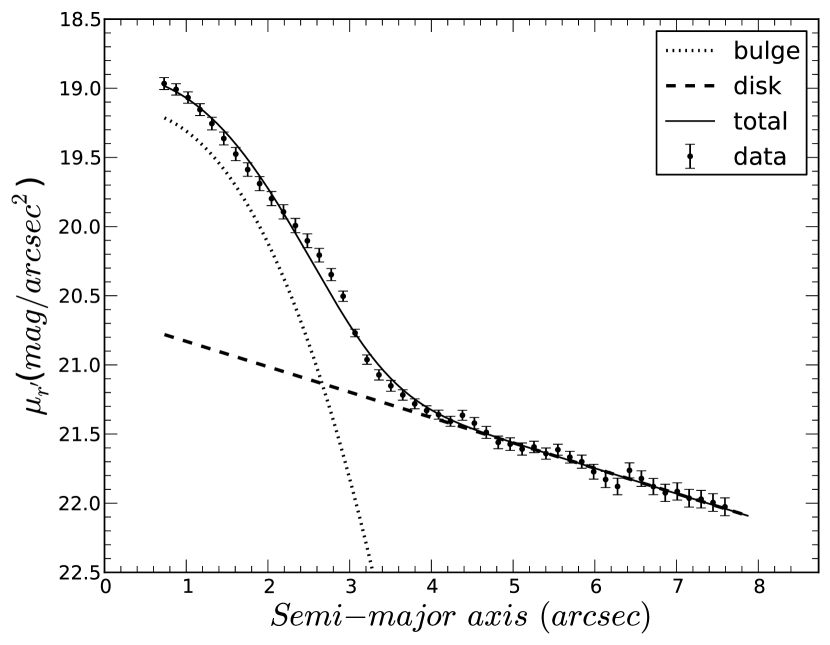
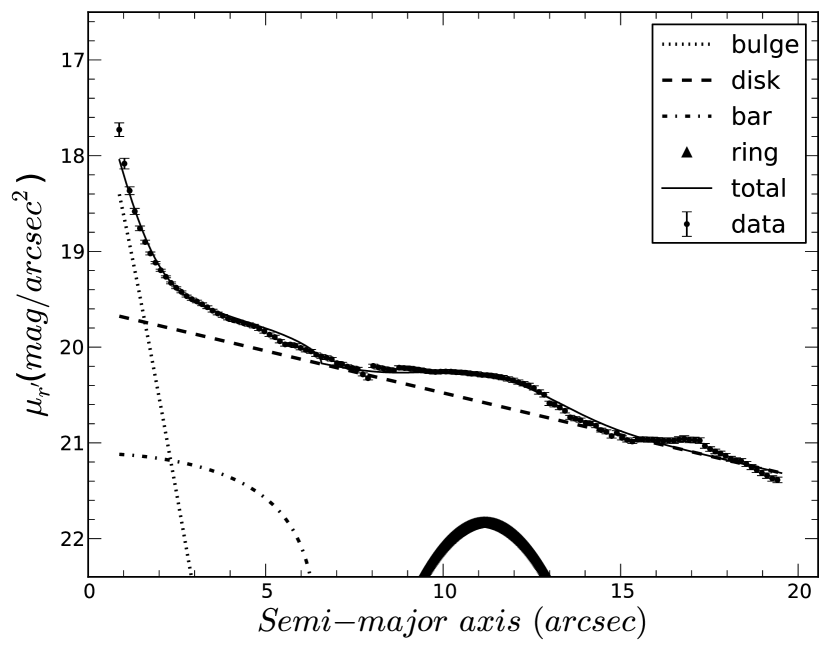
To represent the surface brightness profiles, we assume that the surface luminosity of a galaxy is the sum of the luminosities of each individual component. We have used different profiles for the different components: an exponential law for the disc (Freeman, 1970), the Sérsic profile for the bulge component (Sérsic, 1968), an elliptical profile for the bars (Freeman, 1966), and the Buta (1996) profile to represent a ring. The bulge and disc profile can be formally expressed as
| (1) |
and
| (2) |
where and are the bulge central intensity and effective radius, and and are the disc central intensity and the scale length. The bar and ring components profiles are given by
| (3) |
and
| (4) |
The procedure to decompose the surface brightness profiles is described below. First, the disc component was fitted and subtracted from the original profile. Then, the bulge component is fitted to the residuals, and subtracted from the observed profile. The process (fitting then subtracting disc and bulge components) is repeated, and after some iterations, a stable set of parameters for the two main components is obtained. Those two are then subtracted from the observed profile, and the secondary components (bar and ring) are obtained. Then, these components are subtracted from the observed profile, and the bulge and disc are fitted again. The process continues until convergence of the parameters is achieved (for more details, see Hernandez-Jimenez et al., 2013).
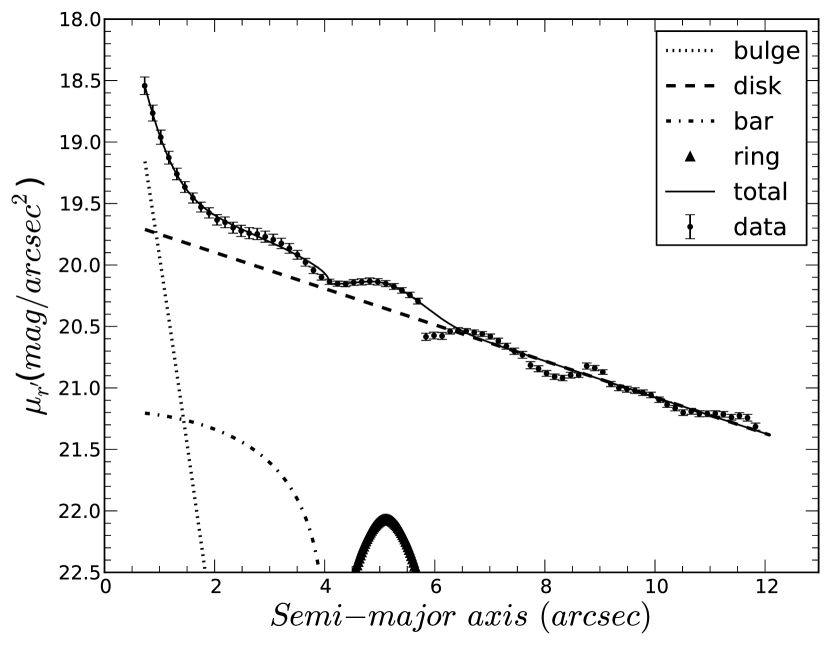
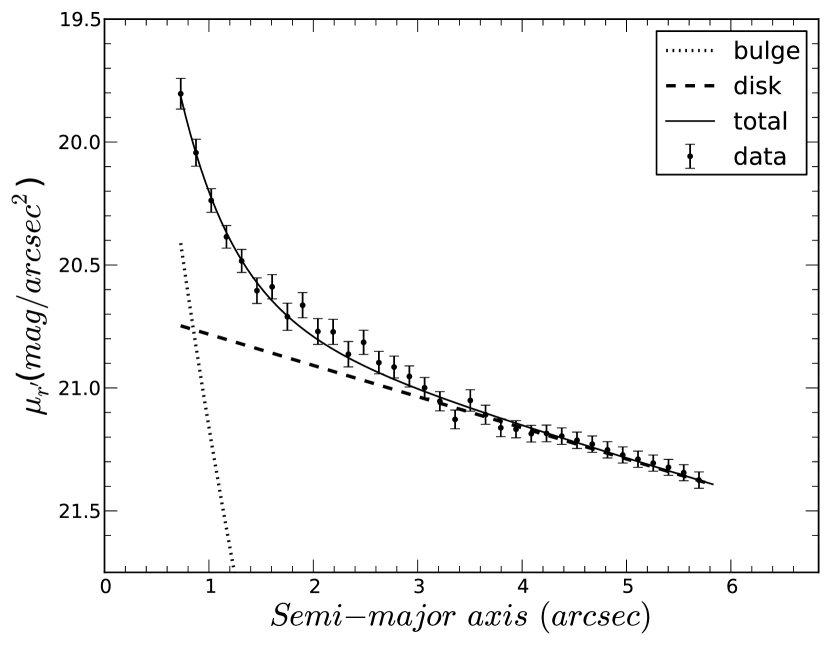
Figure 3 presents the decomposition of the surface brightness profiles of the pair members of AM 2058-381 and AM 1228-260. The bulge and disc structural parameters are listed in Table 6, while the structural parameters for secondary components (bars and rings) are given in Table 7.
| Bulge | Disc | |||||||
|---|---|---|---|---|---|---|---|---|
| Galaxy | (arcsec2) | (arcsec) | (kpc) | (arcsec2) | (arcsec) | (kpc) | ||
| AM 2058A | ||||||||
| AM 2058B | ||||||||
| AM 1228A | ||||||||
| AM 1228B | ||||||||
| Bar | Ring | |||||
|---|---|---|---|---|---|---|
| Galaxy | (arcsec2) | (arcsec) | (arcsec2) | (arcsec) | ||
| AM 2058A | ||||||
| AM 1228A | ||||||
| Bulge | Disc | Bar | Ring | B/T | B/D | |||||||||
|---|---|---|---|---|---|---|---|---|---|---|---|---|---|---|
| Galaxy | % | % | % | % | ||||||||||
| AM 2058A | 2.8 | 90.8 | 4.3 | 2.1 | 0.03 | 0.03 | ||||||||
| AM 2058B | 34.6 | 65.4 | - | - | - | - | 0.34 | 0.52 | ||||||
| AM 1228A | 3.0 | 85.2 | 4.2 | 6.2 | 0.03 | 0.04 | ||||||||
| AM 1228B | 6.6 | 92.4 | - | - | - | - | 0.06 | 0.07 | ||||||
The observed surface brightness profiles of AM 2058A and AM 1228A cannot be properly represented by a simple decomposition in bulge and disc components. Visual inspection of the images (see Fig. 2), as well as the variation of the geometrical parameters and the surface profiles, indicate that these galaxies host bar and ring structures. The sum of the four adopted components fits well the observed profiles over almost all radii (Fig. 3), although the reduced of 4.73 for AM 1228A and 5.63 for AM 2058A. These high values are due to the irregularities of the observed surface brightness profiles. On the other hand, the surface brightness profiles of the secondary galaxies, AM 2058B and AM 1228B, are well fitted by two components, bulge and disc, with a reduced of and , respectively.
The disc scale lengths and central magnitudes obtained for all galaxies (Table 6) agree well with the average values ( kpc and ) derived by Fathi et al. (2010) and Fathi (2010) for a large sample of galaxies with no evidence of ongoing interaction or disturbed morphology. This indicates that the symmetrization method is adequate to recover the unperturbed disc of the interacting galaxies. Regarding the bulge component, the resulting profiles have Sérsic indexes typical of pseudo bulge () (Kormendy & Kennicutt, 2004). Pseudo-bulges, when compared to classical ones, tend to show younger stellar populations, kinematics supported by rotation, and less concentrated surface brightness profiles, similar to those of discs (Gadotti, 2009). Pseudo-bulges can be formed on longer time-scales, via disc instabilities and secular evolution processes caused by non-asymmetric structures (see Kormendy & Kennicutt 2004, for review), or tidal interaction between galaxies. Both perturbations cause gas to flow towards the galaxy centre and subsequent star formation, resulting in a compact stellar component with high v/, which leads to features typical of a pseudo-bulge (Weinzirl et al., 2009). Therefore, we infer that the pseudo-bulges may be caused by the on-going interaction. In order to test these scenarios, it would be necessary to perform a numerical simulation for these pairs, which will be done in a forthcoming paper.
The derived photometric parameters are used to calculate the integrated luminosity for each component:
| (5) |
where can be any of the profiles above defined. The integral limits, and , are the minimum and maximum radii of the surface brightness profile. The luminosities () found for each component in the fit, their contribution (in %) to the total luminosity, the bulge-to-total (B/T) and bulge-to-disc (B/D) luminosity ratios are listed in Table 8. The B/T ratios obtained for AM 2058A, AM 1228A and AM 1228B are very small, with values , but consistent with their morphological classification as late-type spirals (e.g., Fisher & Drory, 2008; Weinzirl et al., 2009). For AM 2058B, the B/T ratio is 0.34, which is similar to those found for early-type galaxies. The B/D ratios found for the main galaxies, AM 2058A and AM 1228A, are also in good agreement with the reported average value of (B/D) for Sc galaxies (Graham & Worley, 2008). Similarly, the B/D ratios determined for the secondary galaxies, AM 2058B and AM 1228B, are within the ranges of values reported for their respective morphological types, (B/D) for S0 galaxies and (B/D) for Sd (Graham & Worley, 2008).
The bar lengths in AM 2058A and AM 1228A are 3.3 and 2.5 kpc, respectively. These values are typically seen in late-type spirals (Elmegreen & Elmegreen, 1985; Gadotti, 2008). Even so, their contribution to the total luminosity is quite low: 4% for both galaxies. The ring structure in AM 1228A contributes with 6% to the total luminosity, while in AM 2058A, it contributes with only 2%.
4 Ionized gas kinematics
Individual spectra were extracted along the slit positions in apertures of 1 1.17 arcsec2. The radial velocity at each position was derived by averaging the resulting centroid of Gaussian curves fitted to the profiles of the strongest emission lines ([\textN ii] , , [\textN ii] and [\textS ii] ). We adopted the radial velocity of the central aperture of each galaxy as systemic velocity. These values are listed in Table 9. The systemic velocities for the members of AM 2058-381 are in agreement with the previous values found by Donzelli & Pastoriza (1997).
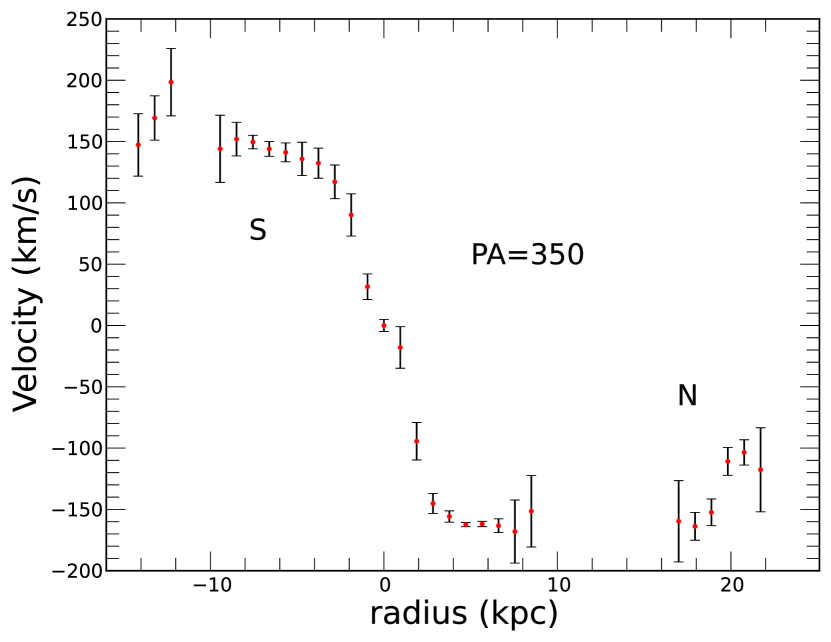
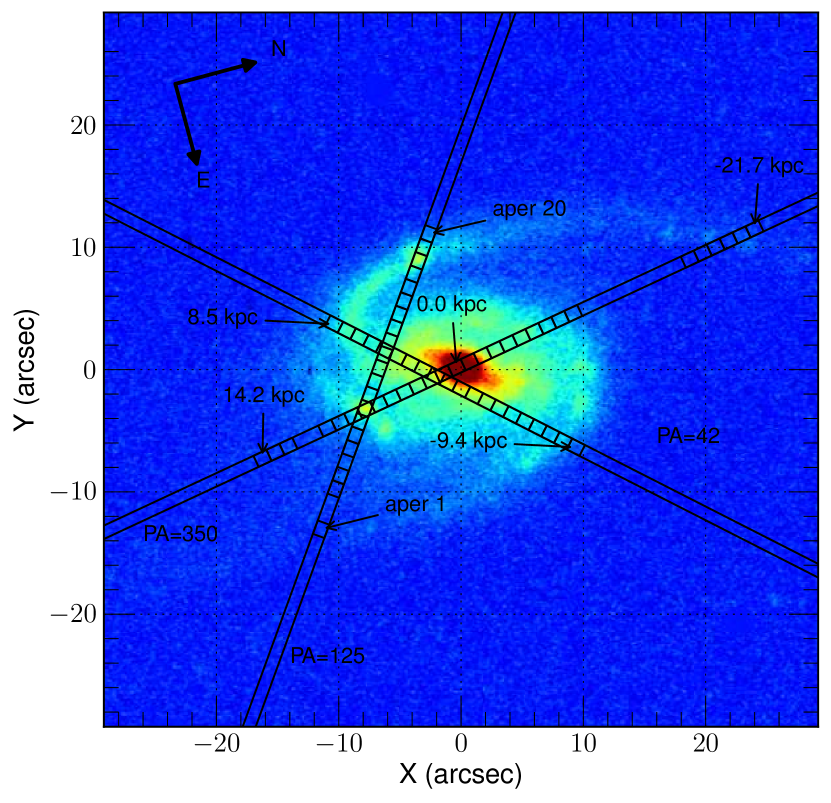
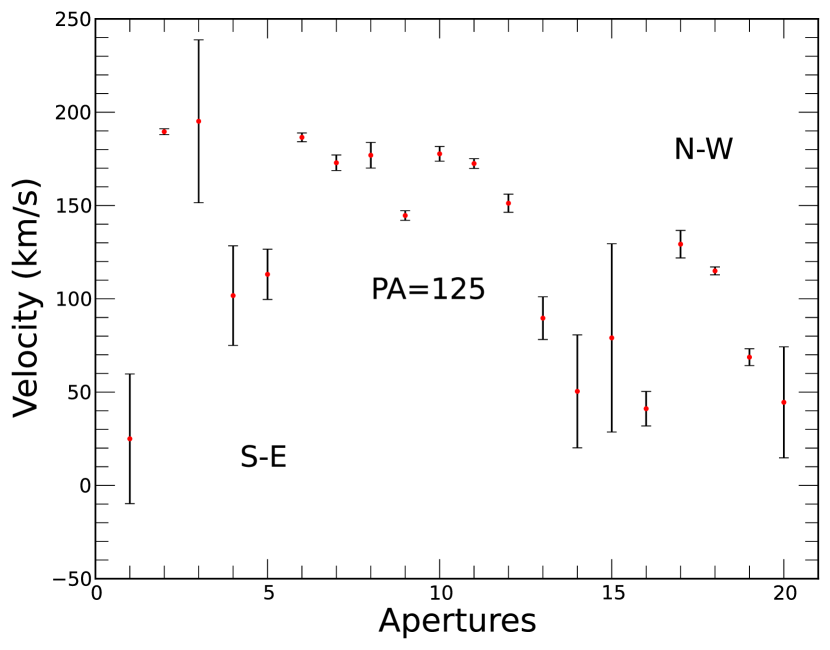
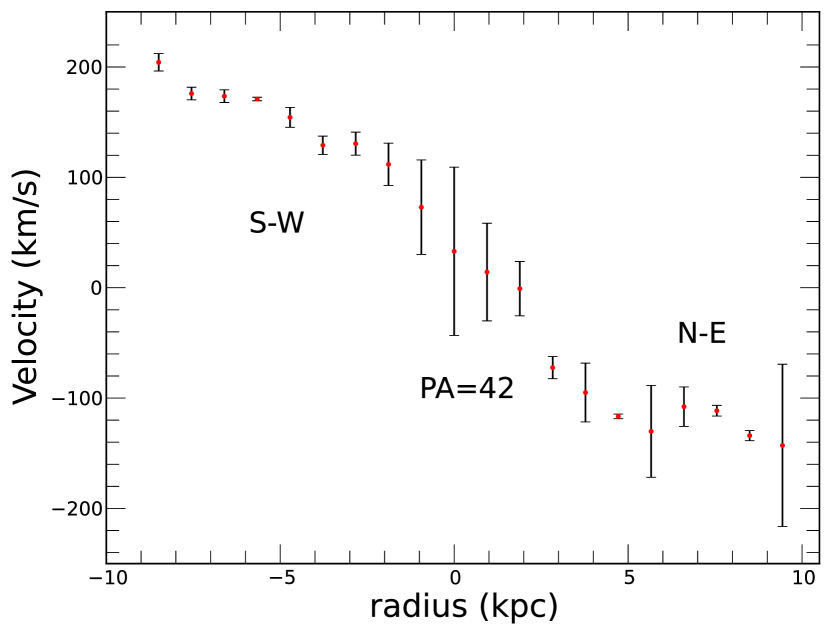
Figure 4 shows the AM 2058A image with the three slit positions overlaid, and the radial velocity profiles (RVP) measured along the corresponding slits. The RVP observed at PA=350° passed through the centre of the galaxy. The Northern and Southern sides of the curve (approaching and receding sides, respectively) are rather symmetric, with a steep rise in the inner radii and a flattening trend in the outer regions, and a maximum velocity of 150 km s-1 at 10 kpc. The RVP along the direction North-East to South-West (PA=42°) is quite smooth, but asymmetric in velocity, reaching -120 and 200 km s-1 respectively. The velocity field obtained along the slit with PA=125° shows wavelike form with different minimum and maximum. This slit position is located across the Western part of the disc and the North-Western spiral arm. Similar effects were observed on the velocity field in the vicinity of the spiral arms in the interacting spiral galaxy NGC 5427 (Alfaro et al., 2001).
Two slit positions (PA=350° and PA=94°) were observed in AM 2058B and their RVPs are shown in Fig. 5. These RVPs have few points because of the small angular size of this galaxy, and none of them through the galactic centre. The RVP along PA=350° is quite symmetric and has a linear behaviour with small slope. Both sides, approaching (South part) and receding (North), reach a maximum velocity of 40 km s-1. In contrast, the RVP along PA=94° appear to be located along the zero-velocity line of this galaxy. This result is surprising, because the velocity line-of-nodes should be aligned with the photometric major axis (PA=79°) and not with the photometric minor axis, which is the case for this galaxy. Could AM 2058B be a tumbling body, rotating along its major axis? To answer this question, a more detailed analysis of the velocity field would be required (e.g., using integral field spectroscopy). However, if AM 2058B is rotating like a solid body, with constant angular momentum, it would explain the RVP linear behaviour along PA=350°. Another question, could the misalignment of angular momenta of AM 2058B be caused by the main companion? In a recent work, Cen (2014) studied the evolution of angular momenta in galaxies in cosmological simulations, and found that the spin changes direction frequently due to tidal interaction with nearby companions.
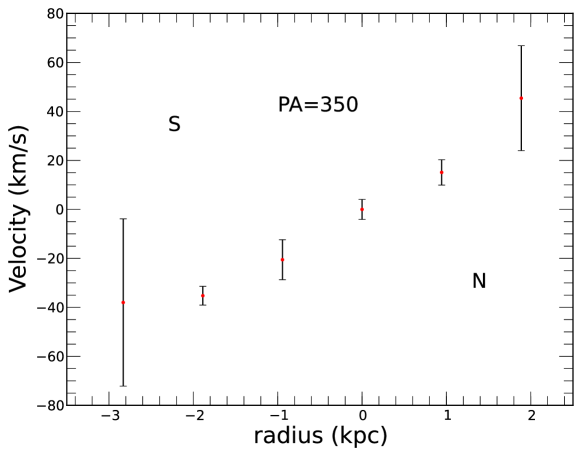
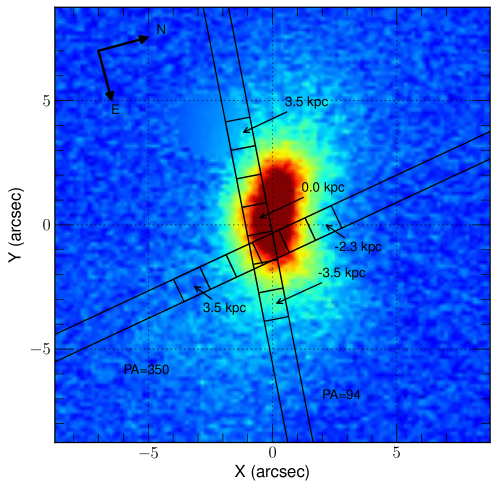
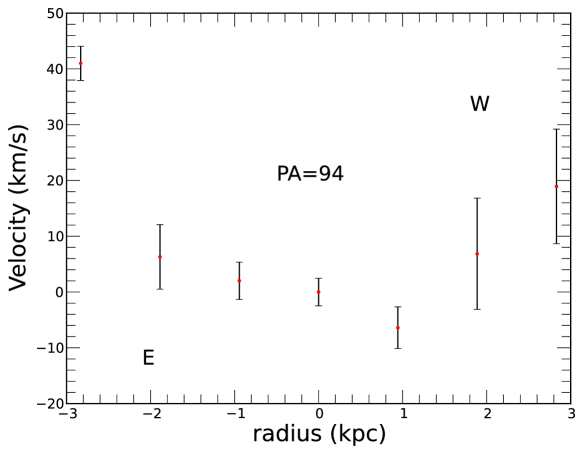
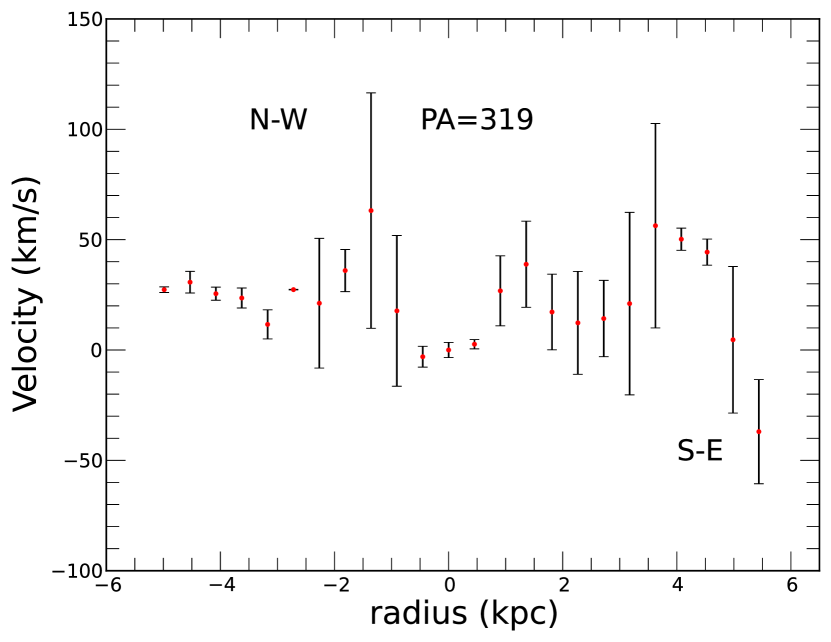
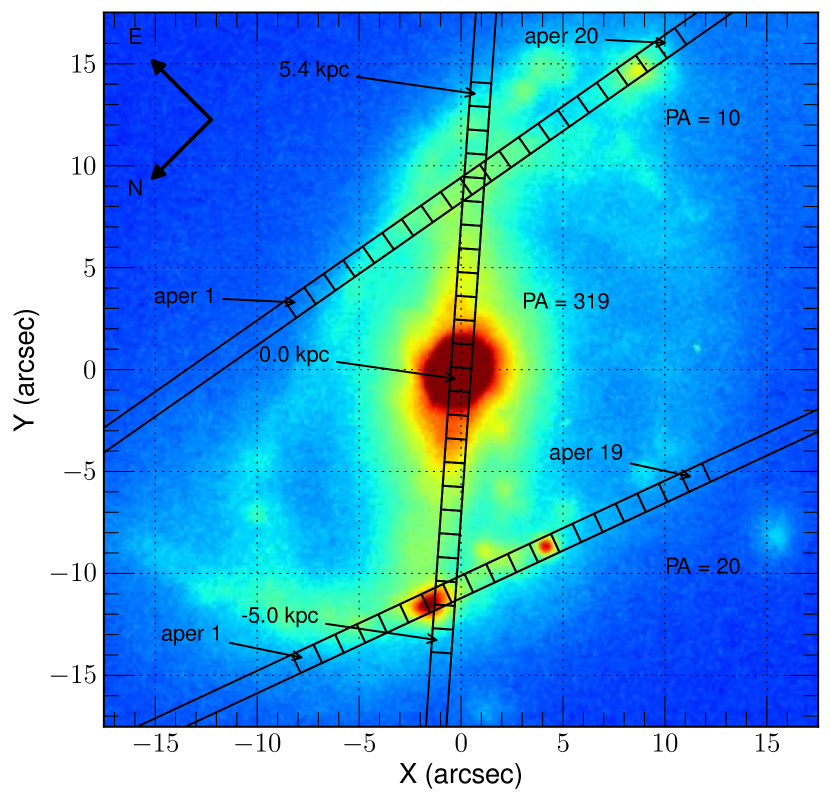
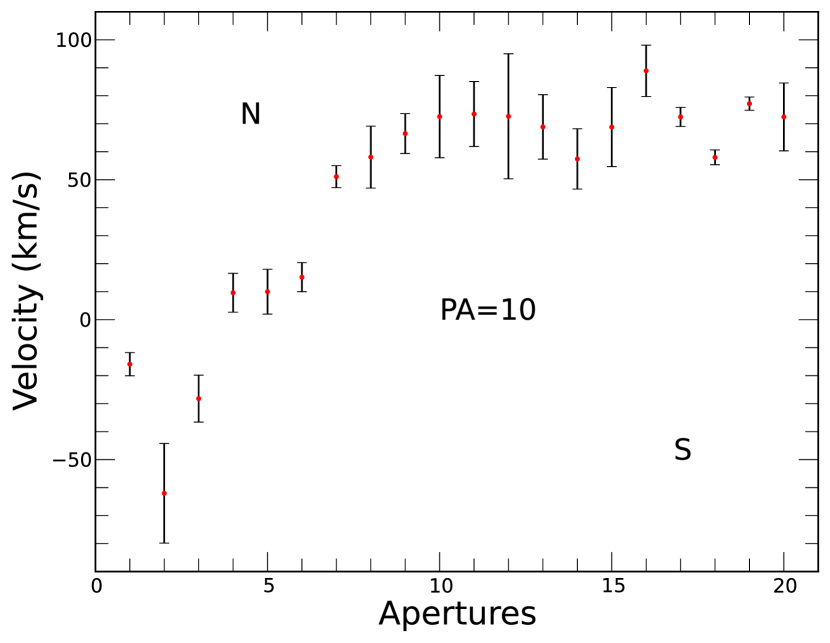
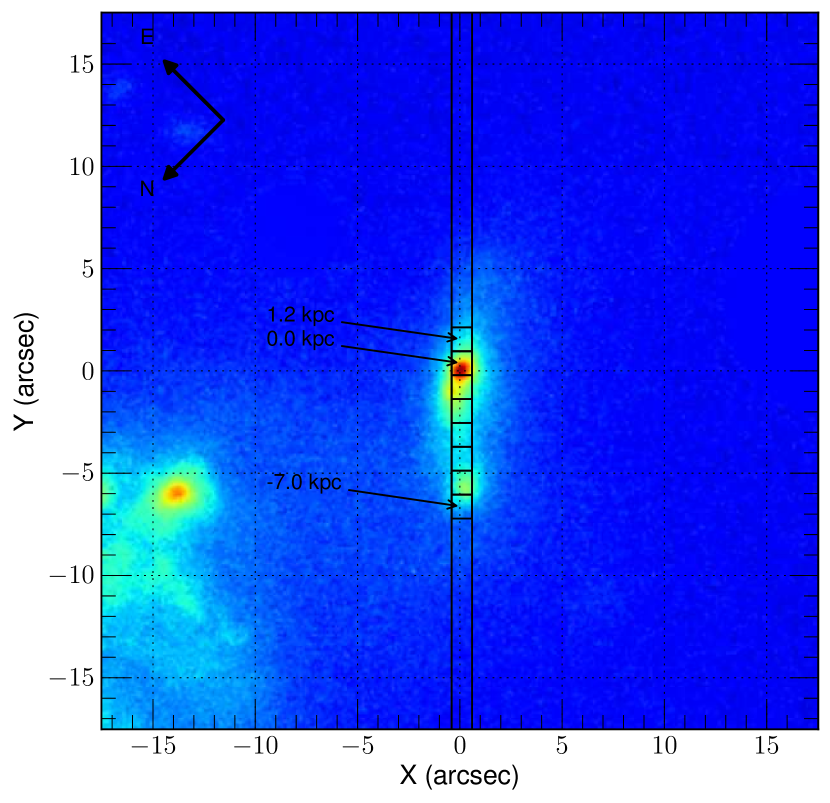
Figure 6 shows the RVPs for the slit positions at PA=319°, PA=10°and PA=20° , and location of the spectral extractions for AM 1228A image. The RVP at PA=319° seems to be close to the zero-velocity line, with velocities between 0 km s-1 and 50 km s-1. In fact, as we discuss in Sect. 5, there is a misalignment between the kinematic and photometric axes, like in AM 2058B. On the other hand, the RVP at PA=10° in the Northern part shows increasing velocity, from -60 up to 80 km s-1, while in the South, it becomes flat. Conversely, the RVP at PA=20° is rather flat in the Northern part (with small oscillations smaller than 10 km s-1) at 20 km s-1, rising linearly up to 130 km s-1 in the Southern part.

The RVP for AM 1228B are show in Fig. 7. Similarly to AM 2058B, the RVP for AM 1228B has few points due to its small angular size. This RVP shows a very peculiar form: it starts at North-West with a velocity of 60 km s-1, immediately drops to 15 km s-1, then a linear increase up to 15 km s-1 at 1 kpc from the centre. Finally, at South-East direction, the measured velocities drop again, falling to km s-1.

| Galaxy | Systemic Velocity (km s-1) | PA Slit (°) |
|---|---|---|
| AM 2058A | 121735 | 350 |
| AM 2058B | 123094 | 94 |
| AM 1228A | 58443 | 319 |
| AM 1228B | 59373 | 4 |
5 Rotation curve models
The mass distributions of the main galaxies in the studied pairs are modelled as the sum of the bulge, disc and dark halo components. We assume that the mass distribution follows the deprojected luminosity distribution with constant M/L ratio for the bulge and disc.
For the bulge mass distribution, we use the rotation curve derived for a Sérsic profile density. This profile is obtained by an Abel integral equation (Binney & Tremaine, 1987; Simonneau & Prada, 2004), which relates bulge surface brightness (equation 1) to density:
| (6) |
where , , and are those in equation 1, and . is the M/L for the bulge component. The circular velocity () associated for the bulge is:
| (7) |
where
| (8) |
For the disc, the circular velocity () curve derived for an exponential disc is given by the following equation (Freeman, 1970; Binney & Tremaine, 1987)
| (9) |
where and are those in equation 2 and is the M/L for disc component. , and are modified Bessel functions of the first and second kinds, respectively.
For the halo mass model, we use the density profile proposed by Navarro, Frenk & White (1995; 1996; 1997, hereafter NFW). In this case the dark matter density is given by
| (10) |
where is a characteristic radius, is the present critical density and is the characteristic overdensity. The latter is defined as , where is the halo concentration (Navarro, Frenk & White, 1996). is the distance from the centre of the halo at which the mean density is 200 times the . The mass interior inside this radius is . The circular velocity () in the NFW profile parametrized with and is:
| (11) |
The final rotation curve model is computed from the squared sum of the circular velocities of the bulge, disc and halo components:
| (12) |
This equation has 9 parameters, 5 photometric and 4 dynamic. The photometric parameters were already determined for the bulge (, and ) and disc ( and ) in Sect. 3.2, and are fixed. On the other hand, the dynamic parameters, the bulge and disc M/L ratios ( and , respectively) and the halo parameters ( and ), are free. Since we have multiple observations with different long-slit orientations on the main galaxies (see Figs. 4 and 6 for AM 2058A and AM 1228A, respectively), we have fitted the projected in the plane of the sky for all positions simultaneously. Therefore, the observed radial velocity at position () on the sky plane is related to the circular velocity [] by the following equation (Elmegreen, 1998; Palunas & Williams, 2000).
| (13) |
and
| (14) |
where is the inclination of the galactic disc, is the PA of the projected major axis, and is the systemic velocity. The disc centre is an implicit pair of parameters in the model. It is important to note that the term in brackets is equal to one when is measured along the major axis, in which case, . The latter equation introduces five additional parameters, namely: , , , and . The first two are determined by the fit of the outer isophote of the disc (Sect. 3.1), and thus, are fixed parameters, while the remaining three are free parameters in the rotation curve model.
| Galaxy | A (km s-1) | c (kpc) | p | (km s-1) | (kpc) | (kpc) | PA (kine) | PA (phot) | |
|---|---|---|---|---|---|---|---|---|---|
| AM 2058A | 823.2 | 45.5 | 1.2 | 12164.3 | -0.02 | 0.07 | 194.5° | 198.9° | 4.4° |
| AM 1228A | 105.6 | 14.8 | 0.9 | 5887.2 | 0.42 | -0.15 | 221.1° | 162.1° | 58.9° |
Note that the photometric major axis is not necessarily aligned with the kinematic one. In fact, in a recent paper, Barrera-Ballesteros et al. (2014) studied the velocity maps for a sample of 80 non-interacting spiral galaxies, and found that 10% of those galaxies present kinematic misalignments larger than 22°. In order to indirectly determine the PA kinematics major axis, we fitted our data with a phenomenological potential given by Bertola et al. (1991), with an on-the-sky projection
| (15) |
with
| (16) |
where and and are parameters that define the amplitude and shape of the curve. The remaining parameters, , , and , are the same as in equation 13. The inclination remains constant due to the well known limitation to derive this parameter from kinematics. The parameter obtained by fitting the above equation to the AM 2058A and AM 1228A data are listed in Table 10. Instead of and , we give the difference between kinematic and photometric centres, in the sky plane, and . In addition to these parameters, Table 10 also gives the angular difference found between the PA of the kinematic and photometric major axis. The parameter for both galaxies is close to 1, which is the expected value for flat rotation curves (Bertola et al., 1991). values agree with the observation, while both galaxies show an offset between the photometric and kinematic centres of 0.2 and 0.4 kpc, for AM 2058A and AM 1228A, respectively. However, these offsets are smaller than the seeing for each galaxy (0.94 and 0.45 kpc, respectively). For AM 2058A, there is a good agreement between the photometric and kinematic axes orientation, while for AM 1228A, there is a misalignment of 58° between the axes. One possible explanation is that the photometric PA, derived from the outermost isophotes of AM 1228A’s disc are twisted due to the common external tidal structure present in this system. Another possibility would be the well-known characteristic “S”-shape in the zero-velocity curve, like that observed in the velocity field of the barred spirals (e.g., Peterson & Huntley, 1980; García-Barreto & Rosado, 2001; Emsellem et al., 2006; Barrera-Ballesteros et al., 2014). However, this effect introduces asymmetries rather than misalignments between the photometric and kinematic axes orientation.
6 Mass models
In order to determine the mass distribution of the main galaxies of the studied pairs, we use the force method outlined in Hernandez-Jimenez et al. (2013). This method consists basically in exploring the phase space generated by M/L ratios of the bulge () and disc (), the halo parameters (, ) and geometrical parameters (, , ). Each point in this phase space represents a model of the rotation curve given by equation 13, and associated with this model the resulting of the fit of the data. The explored ranges for the , , , , and parameters are given in Table 11, again the kinematics centre is given in terms of the offset with respect to the geometrical centre, and . The choice of halo parameters is based on the values found in cosmological simulations with NFW’s profile (Navarro, Frenk & White, 1996; Bullock et al., 2001). With respect to the explored ranges of M/L for the bulge and disc, we chose values corresponding to the minimum and maximum disc (e.g., van Albada et al., 1985; Carignan, 1985; Kent, 1987). On the other hand, the kinematic centres were chosen to be inside the respective seeing boxes. Finally, we explored 5 values of for each galaxy: the radial velocity measured at the central and two adjacent apertures, plus the mean values between them.
| Parameter | Min. value | Max. value | value |
|---|---|---|---|
| 0.00 | 2.00 | 0.10 | |
| 0.00 | 2.00 | 0.10 | |
| ) | -1.30 | 1.00 | 0.03 |
| 5.0 | 60.0 | 1.00 | |
| (kpc) for AM 1228A | -0.94 | 0.94 | 0.470 |
| (kpc) for AM 2058A | -0.45 | 0.45 | 0.225 |
The RVPs used to fit the mass model for AM 2058A are those observed at PA=350°and PA=42°. The RVP at PA=125°was excluded because it crosses along the N-W arm and present kinematic irregularities (Sect. 4). On the other hand, all observed RVPs for AM 1228A were used to fit the mass distribution model.
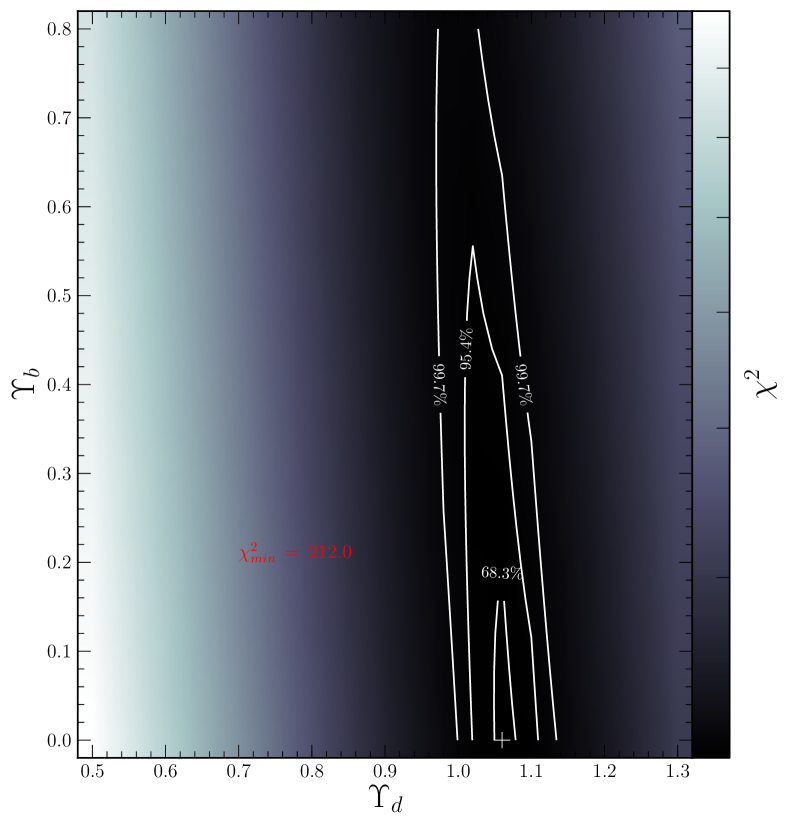
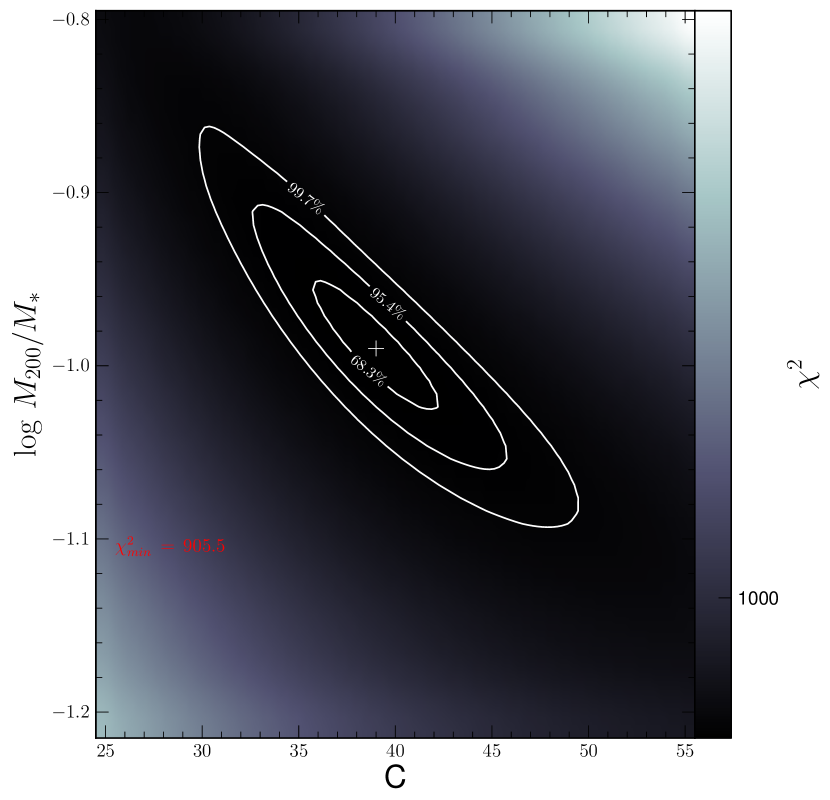
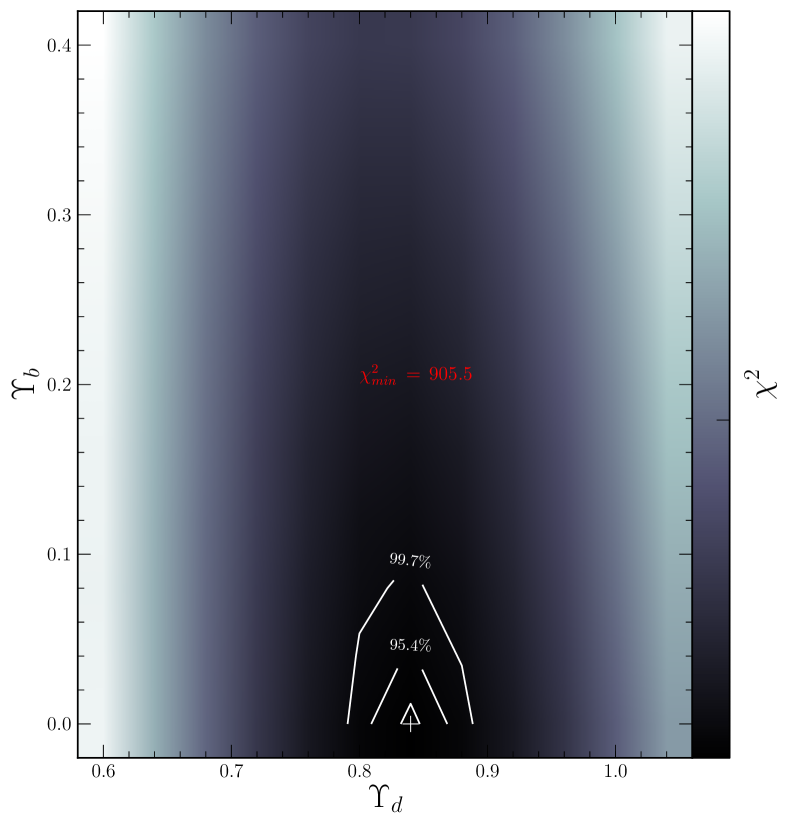
The geometrical and dynamic parameters for the best-fitting models for AM 2058A and AM 1228A, corresponding to the global minimum of , are listed in Tables 12 and 13, respectively. Uncertainties at 1 confidence (68%) are also given. Fig. 8 shows the space projections of AM 2058A and AM 1228B on the planes – and –. These plots are useful to find the global minimum and its convergence pattern. The convergence pattern in the plane – has a “banana” shape due to the degeneracy between and ; a decrease in is balanced with an increase in , and vice versa. The “banana” shape is more evident in the space projection of AM 2058A (Fig. 8). Anyway, both convergence patterns are tight and deep, with a marked absolute minimum. On the other hand, the shape of the converge pattern in the – planes is similar, in terms of the narrowness with respect to axis, in both galaxies. Regarding the axis, the absolute minimum for both galaxies is 0.0, but the confidence curves of the AM 1228A are tighter than in AM 2058A. These results are not surprising, because both galaxies are late-type spirals having B/T ratios rather low, 3% (see Table 8). In general, the mass distribution for this type of galaxy is modelled without bulge (e.g., van Albada et al., 1985; Carignan, 1985; Begeman, 1989; Kuzio de Naray, McGaugh & de Blok, 2008).

| Galaxy | (km s-1) | (kpc) | (kpc) |
|---|---|---|---|
| AM 2058A | 12157.3 | 0.47 | 0.94 |
| AM 1228A | 5894.4 | 0.45 | -0.22 |
| Galaxy | ||||||||
|---|---|---|---|---|---|---|---|---|
| AM 2058A | - | |||||||
| AM 1228A | - |
The halo parameters found for AM 2058A and AM 1228A are compared with those reported for the MW, M 31, and a late-type spiral galaxy model. Table 14 lists the parameters , and for all those galaxies. We see that halo parameters for AM 2058A are similar to those of the MW and M 31, while those for AM 1228A are quite different. The halo mass of AM 2058A is roughly nine times larger than that of AM 1228A. This difference may be related to galaxy size, since the equivalent radius of the outermost isophote for AM 2058A is 11.6 kpc, while for AM 1228A is 5.7 kpc.
Figure 9 shows the velocity field modelled for AM 2058A, together with its projections on observed RVPs obtained at PA=350°, PA=42° and PA=125°. In general, there is a good match to the observations, in particular, for the RVP along PA=42°. On the other hand, the model for RVP along PA=350° shows a good agreement with the data in the approaching side, while in the receding side there is a departure between model and observations. This shift in velocity is of the order of km s-1. We can interpret this departure in velocity as if this part of the galaxy is speeding up, and/or as if it is being deviated from the galactic plane due to interaction with AM 2058B. This type of irregularity has been reported in two interacting systems, NGC 5427 (Fuentes-Carrera et al., 2004) and AM 1219-430 (Hernandez-Jimenez et al., 2013). It is also observed in galaxies in high density environments, such as galaxy clusters (Dale et al., 2001). Finally, the model for RVP along PA=42° follows the trend of the observed curve. However, some points have 50 km s-1. Nevertheless, as commented in Sect. 4, this behaviour is expected because the slit crosses the North-West arm (Fig. 6).
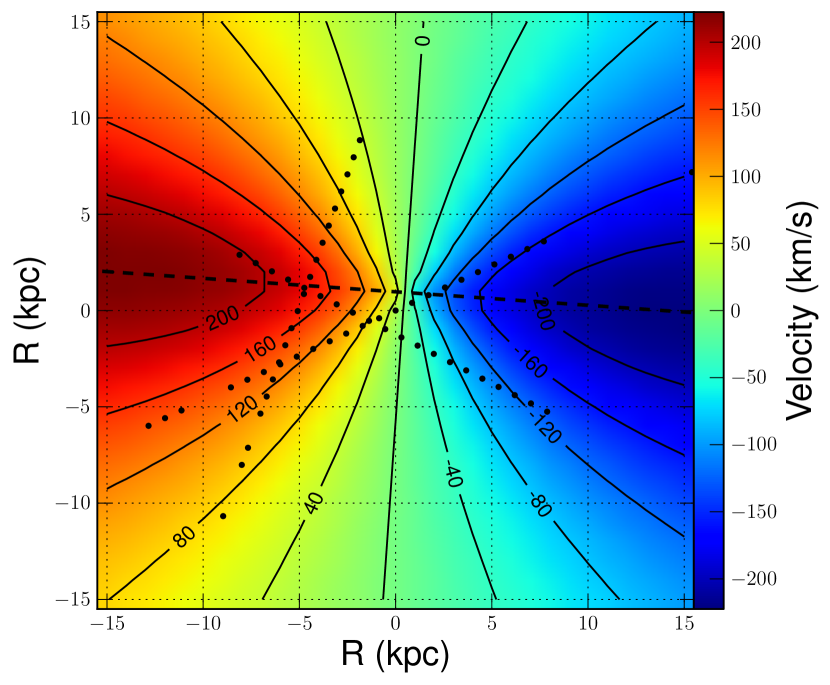
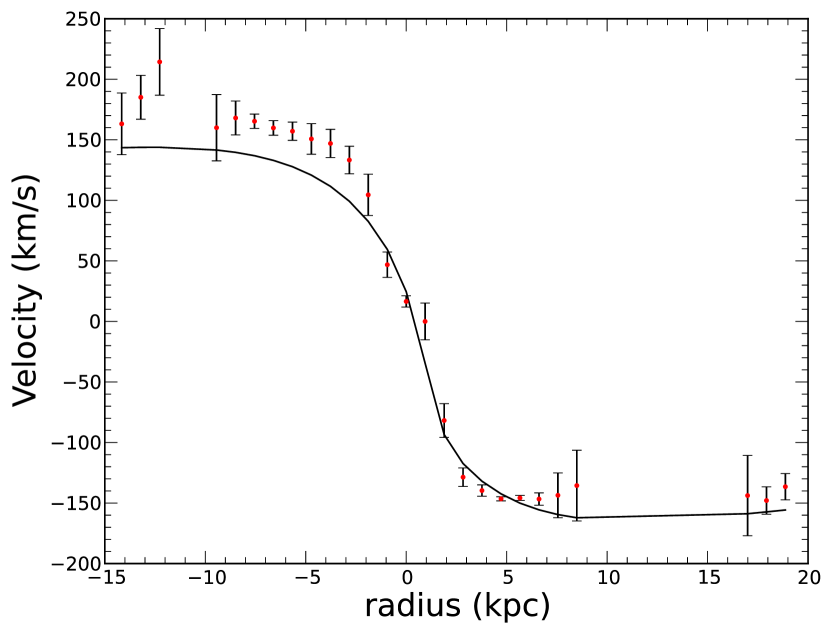
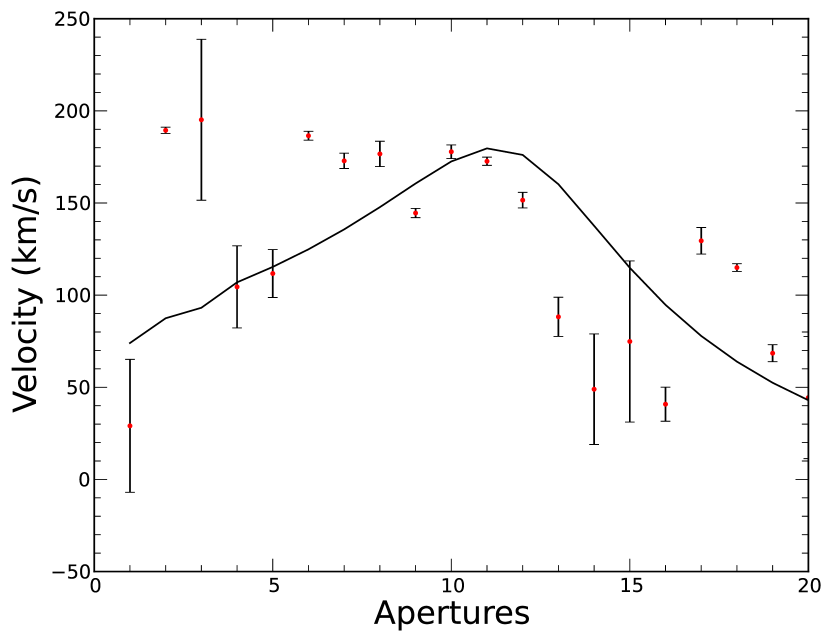
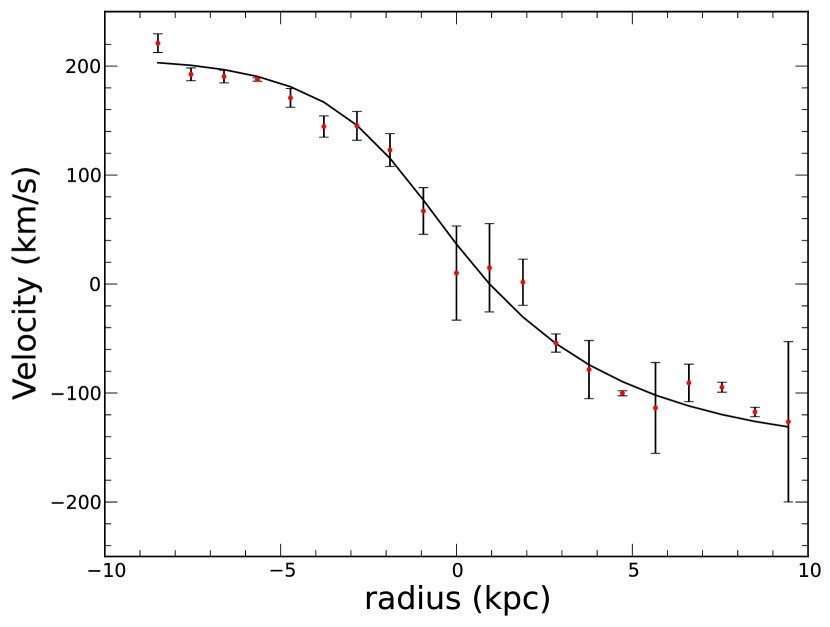
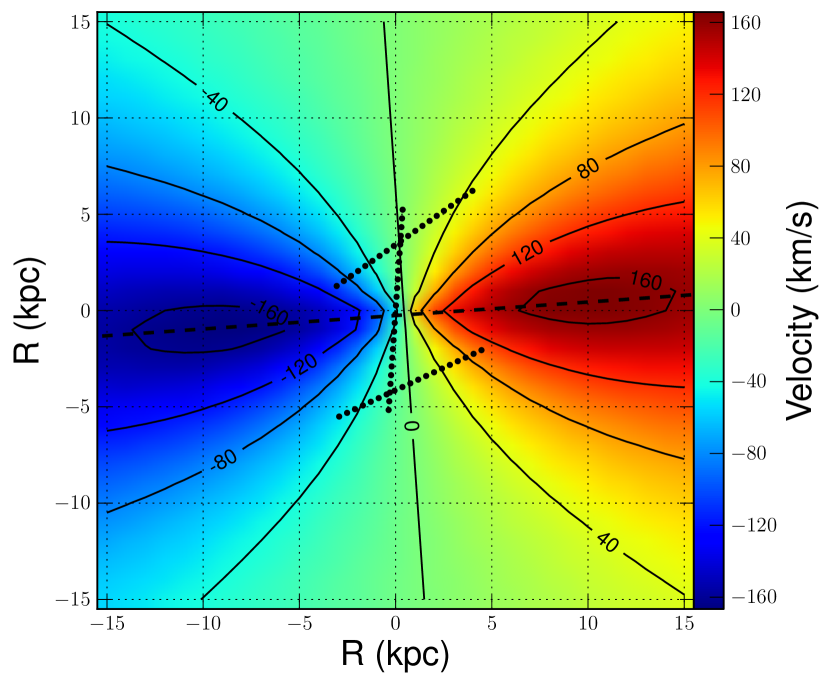

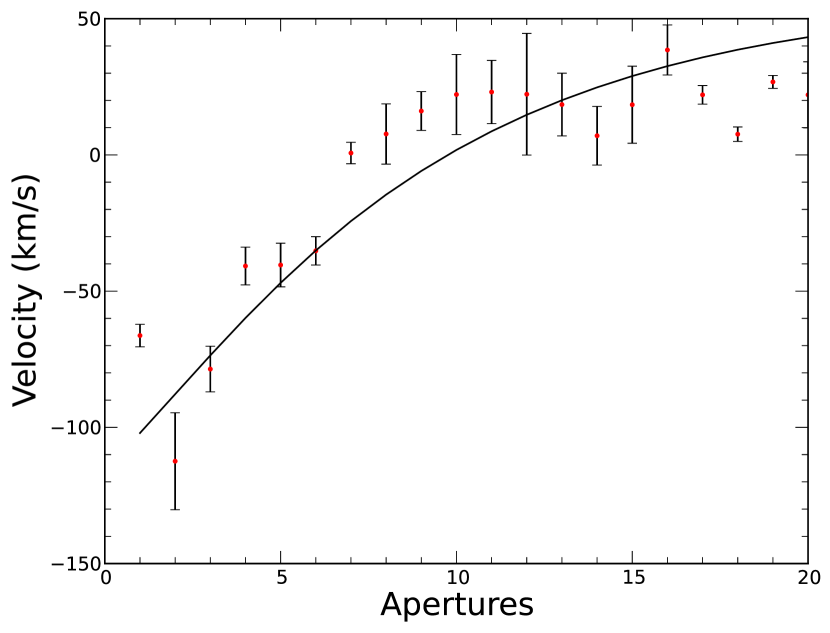

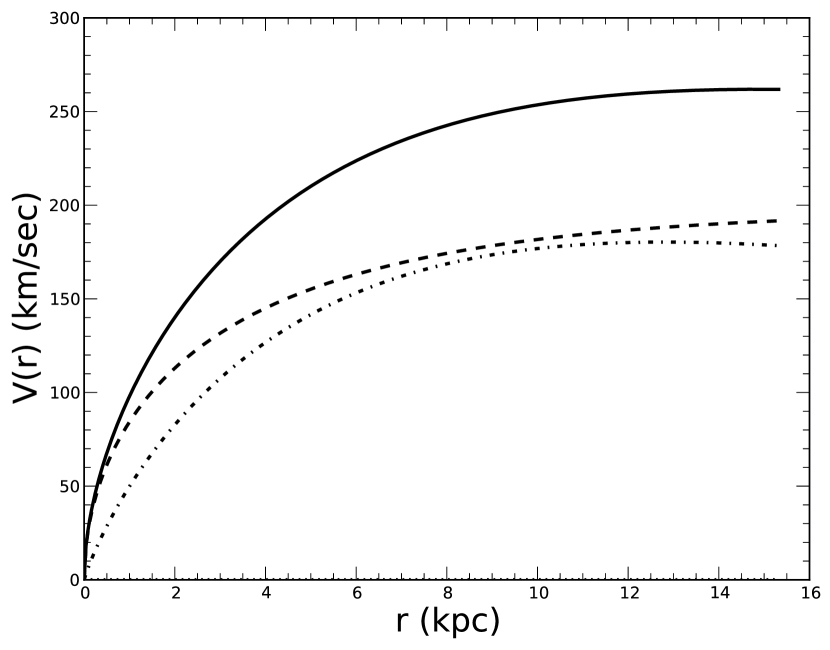
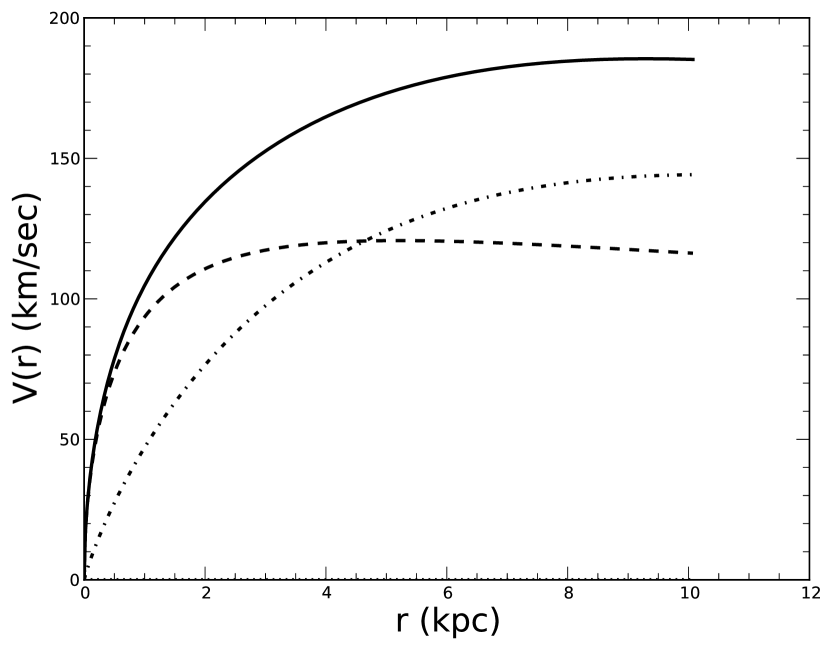
Figure 10 shows the resulting model for the velocity field of AM 1228A, along with the projected RVPs and data points for different slit positions. The observed data are well represented by the model. However, the global minimum for AM 1228A is much greater than that of AM 2058A. This discrepancy may be due to two factors: first, as the model of AM 1228A has more points to fit, it is expected that the be higher for this galaxy than that for AM 2058A. Secondly, the RVPs observed along AM 1228A have more irregularities than those on AM 2058A (Fig. 6). Regarding the quality of the modelled velocity field in specific RVPs, the RVP model along PA=319° follows the trend of the observed curve. This RVP is close to the zero-velocity line of the modelled velocity field (Fig. 10). On the other hand, the models for RVPs along PA=10° and PA=20° also follow the trend of the observed curves, but do not reproduce completely the flat parts of these curves, the South and North parts, respectively.
The final rotation curve models are shown in Fig. 11, along with the disc and halo components. For AM 2058A, the disc and halo have similar weights along the overall radii of the rotation curve, being the halo component somewhat more important than the disc component. On the order hand, the middle part of the rotation curve of AM 1228A ( kpc) is dominated by the halo component, while the disc becomes dominant in the outer parts ( kpc). It is worth mentioning that the disc component will dominate up to their peak at 10.5 kpc, after that, the curve will be dominated completely by the halo component.
The cumulative masses for the disc () and halo () components of the main galaxies, along with the total masses (), are listed in Table 13. These values are estimated inside the equivalent radii of the outermost isophotes. The total masses of AM 2058A and AM 1228A are and , respectively. Thus, the ratio between the integrated masses of both galaxies is proportional to their physical sizes. We found for AM 2058A and AM 1228A, the mass-to-light ratios, , 3.05 and 1.37, respectively. The value found for AM 2058A is in agreement with the mean value, , derived for a sample of 290 late-type spiral galaxies studied by Broeils & Courteau (1997). The low value found for AM 1228A may be accounted for by intense star formation.
7 Conclusions
A detailed study of the morphology, kinematics and dynamics of the minor mergers AM 2058-381 and AM 1228-260 was performed. The work is based in images and long-slit spectra in the wavelength range from 4 280 to 7 130Å , obtained with the GMOS at Gemini South. The main results are the following:
-
1.
AM 2058A is 5 times more luminous than AM 2058B, while AM1228A is 20 times more luminous than AM 1228B. In addition, AM 2058-381 is a very luminous minor merger when compared to the MW system. In contrast, the main and secondary galaxies of the pair AM 1228-260 have similar luminosities similar to MW and LMC, respectively.
-
2.
For AM 1228-260 we detected a common isophote enclosing the members, which contributes with 20% of the total luminosity of the pair. For the main galaxy of AM 2058-381, we detected two symmetric, long tidal tails, having only 5% of the system total luminosity.
-
3.
The main galaxies, AM 2058A and AM 1228A, were decomposed in bulge, bar, ring and disc, while the secondary galaxies, AM 2058B and AM 1228B, in bulge and disc. The disc parameters derived for these galaxies agree with the average values found for galaxies with no sign of ongoing interaction or disturbed morphology (Fathi et al., 2010; Fathi, 2010). This indicates that the symmetrization method is adequate to recover the unperturbed disc of the interacting galaxies.
-
4.
The studied galaxies have pseudo-bulges, with a Sérsic index . On the other hand, the B/T for AM 2058A, AM 1228A and AM 1228B are very small (B/T ), which is typical of late-type spirals. For AM 2058B, B/T is 0.34, which is similar to the early-type galaxies.
-
5.
The receding side of the RVP along PA=350° of AM 2058A departs from the velocity field model. This departure can be interpreted as if this part of the galaxy is speeding up, and/or as if it is being deviated from the galactic plane due to interaction with AM 2058B. There is a strong evidence that AM 2058B be a tumbling body, rotating along its major axis.
-
6.
The observed RVPs of AM 1228A indicate that there is a misalignment between kinematic and photometric major axes. Only a small fraction of non-interactions galaxies present this feature (Barrera-Ballesteros et al., 2014). The observed RVP at PA=319° for AM 1228B is quite perturbed, very likely due to the interaction with AM 1228A.
-
7.
The NFW halo parameters ( and found for AM 2058A are similar to those reported for the MW and M 31, while the halo mass of AM 1228A is nine times smaller than that of AM 2058A. It was found a M/L of 3.05 and 1.37 for AM 2058A and AM 1228A, respectively. The M/L of AM 2058A is in agreement with the mean value derived for late-type spiral galaxies (Broeils & Courteau, 1997), while the low M/L obtained for AM 1228A may be due to the intense star formation ongoing in this galaxy.
The parameters obtained in this paper will serve as a starting point in future numerical simulations to reproduce the dynamical histories and predict the evolution of the encounter of these pairs.
Acknowledgements
We thank anonymous referee for important comments and suggestions that helped to improve the contents of this manuscript. This work is based on observations obtained at the Gemini Observatory, which is operated by the Association of Universities for Research in Astronomy, Inc. (AURA), under a cooperative agreement with the NSF on behalf of the Gemini partnership: the National Science Foundation (United States), the National Research Council (Canada), CONICYT (Chile), the Australian Research Council (Australia), Ministério da Ciencia e Tecnologia (Brazil) and SECYT (Argentina). This work has been partially supported by the Brazilian institutions Conselho Nacional de Desenvolvimento Científico e Tecnológico (CNPq) and Coordenação de Aperfeiçoamento de Pessoal de Nível Superior (CAPES). A.C.K. thanks to support FAPESP, process 2010/1490-3. I.R. thanks to support FAPESP, process 2013/17247-9.
References
- Alfaro et al. (2001) Alfaro, E. J., Pérez, E., González-Delgado, R. M., Martos, M. A., Franco, J., 2001, ApJ, 550, 253
- Arp & Madore (1987) Arp, H. & Madore, B. 1987, .A Catalogue of Southern Peculiar Galaxies and Associations. Cambridge University Press, Cambridge
- Barberà, Athanassoula & García-Gómez (2004) Barberà, C., Athanassoula, E., García-Gómez, C., 2004, A&A, 415, 849
- Barnes & Hibbard (2009) Barnes, J. E. & Hibbard, J. E. 2009, AJ, 137, 3071
- Barton et al. (2000) Barton, E. J., Geller, M. J., & Kenyon, S. J., 2000, ApJ, 530, 660
- Barrera-Ballesteros et al. (2014) Barrera-Ballesteros, J. K. et al., 2014, A&A, 568, 70
- Battaglia et al. (2005) Battaglia, G., et al., 2005, MNRAS, 364, 433
- Bédorf & Portegies Zwart (2012) Bédorf, J. & Portegies Zwart, S. 2013, MNRAS, 431, 767
- Begeman (1989) Begeman, K. G., 1989, A&A, 223, 47
- Berentzen et al. (2003) Berentzen, I., Athanassoula, E., Heller, C. H., Fricke, K. J., 2003, MNRAS, 341, 343
- Bertola et al. (1991) Bertola, F., Bettoni, D., Danziger, J., Sadler, E., Sparke, L., & de Zeeuw, T. 1991, ApJ, 373, 369
- Binney & Tremaine (1987) Binney, J., & Tremaine, S. 1987, Galactic Dynamics. Princeton University Press, Princeton, NJ
- Blais-Ouellette et al. (2001) Blais-Ouellette, S., Amram, P., & Carignan, C. 2001, AJ, 121, 1952
- Blanton et al. (2003) Blanton, M. R et al. 2003, ApJ, 592, 819
- Broeils & Courteau (1997) Broeils, A. H., Courteau, S., 1997, in Persic M. & Salucci P., eds, ASP Conf. Ser. Vol. 117, Dark and Visible Matter in Galaxies and Cosmological Implications. Astron. Soc. Pac., San Fransisco, p. 74
- Bullock et al. (2001) Bullock, J. S., Kolatt, T. S., Sigad, Y., Somerville, R. S., Kravtsov, A. V., Klypin, A. A., Primack, J. R., & Dekel, A. 2001, MNRAS, 321, 559
- Buta (1996) Buta, R. 1996, in Buta R., Crocker, D. A., Elmegreen, B. G., eds, ASP Conf. Ser. Vol. 91, IAU Colloq. 157: Barred Galaxies, Astron.Soc.Pac., San Francisco, p. 11
- Cabrera-Lavers & Garzón (2004) Cabrera-Lavers, A.; Garzón, F. 2004, AJ, 127, 1386
- Carignan (1985) Carignan, C. 1985, AJ, 299, 59
- Cen (2014) Cen, R. 2014, ApJ, 785L, 15
- Cole et al. (2000) Cole, S., Lacey, C. G., Baugh, C. M., Frenk, C. S., 2000, MNRAS, 319, 168
- Cox et al. (2008) Cox, T. J., Jonsson, P., Somerville, R. S., Primack, J. R.; Dekel, A., 2008, MNRAS, 384, 386
- Dale et al. (2001) Dale, D. A., Giovanelli, R., Haynes, M. P., Hardy E., Campusano L. E., 2001, AJ, 121, 1886
- Dalcanton (2007) Dalcanton, J. J. 2007, ApJ, 658, 941.
- Díaz et al. (2000) Díaz, R., Rodrigues, I., Dottori, H., & Carranza, G. 2000, AJ, 119, 111
- Donzelli & Pastoriza (1997) Donzelli, C. J., & Pastoriza, M. G. 1997, ApJS, 111, 181
- Elmegreen & Elmegreen (1985) Elmegreen, B. G., Elmegreen, D. M., 1985, ApJ, 288
- Elmegreen, Elmegreen & Montenegro (1992) Elmegreen, B. G., Elmegreen, D. M., & Montenegro, L. 1992, ApJS, 79, 37
- Elmegreen (1998) Elmegreen, D. M. 1998, Galaxies and Galactic Structure. Prentice Hall, Englewood Cliffs, NJ
- Eliche-moral et al. (2011) Eliche-Moral, M. C., González-García, A. C., Balcells, M., Aguerri, J. A. L., Gallego, J., Zamorano, J., Prieto, M., 2011, A&A, 533, 104
- Emsellem et al. (2006) Emsellem, E., Fathi, K., Wozniak, H., Ferruit P., Mundell C. G., Schinnerer E., 2006, MNRAS, 365, 367
- Fathi et al. (2010) Fathi, K., Allen M., Boch T., Hatziminaoglou E., Peletier R. F., 2010, MNRAS, 406, 1595
- Fathi (2010) Fathi, K., 2010, ApJ, 722, L120
- Ferreiro & Pastoriza (2004) Ferreiro, D. L., & Pastoriza, M. G. 2004, A & A, 428, 837
- Ferreiro, Pastoriza & Rickes (2008) Ferreiro, D. L., Pastoriza, M. G. 2008, & Rieks, M., A & A, 481, 645
- Fisher & Drory (2008) Fisher, D. B., & Drory, N. 2008, AJ, 136, 773
- Freeman (1970) Freeman, K. C. 1970, ApJ, 160, 811
- Freeman (1966) Freeman, K. C. 1966, MNRAS, 133, 47
- Fuentes-Carrera et al. (2004) Fuentes-Carrera, I., et al. 2004, A&A, 415, 451
- Gadotti (2008) Gadotti, D. A. 2008, MNRAS, 384, 420
- Gadotti (2009) Gadotti, D. A. 2009, MNRAS, 393, 1531
- García-Barreto & Rosado (2001) García-Barreto, J. A., Rosado, M., 2001, AJ, 121, 2540
- García-Barreto, Carrilo & Vera-Villamizar (2003) García-Barreto, J A., Carrillo, R., Vera-Villamizar, N. 2003, AJ, 126, 1707
- Guedes et al. (2011) Guedes, J., Callegari, S., Madau, P., & Mayer, L. 2011, ApJ, 742, 76
- Grosbol (1985) Grosbol, P. J., 1985, A&AS, 60, 261
- Graham & Worley (2008) Graham, A. W., & Worley, C. C. 2008, MNRAS, 388, 1708
- Hernquist & Mihos (1995) Hernquist, L., & Mihos, J. C. 1995, ApJ, 448, 41
- Hernandez-Jimenez et al. (2013) Hernandez-Jimenez, J. A., Pastoriza, M. G., Rodrigues, I. Krabbe, A. C., Winge Cláudia., Bonatto, C. 2013, MNRAS, 435, 3342
- Hibbard et al. (2001) Hibbard, J. E., van der Hulst, J. M., Barnes, J. E., Rich, R. M. 2001, AJ, 122, 2969
- Hopkins et al. (2010) Hopkins P. F. et al., 2010, ApJ, 715, 202
- Jedrzejewski (1987) Jedrzejewski, R. I. 1987, MNRAS, 226, 747
- Kennicutt et al. (1987) Kennicutt, R. C., Jr., Roettiger, K. A., Keel, W. C., van der Hulst, J. M., & Hummel, E. 1987, AJ, 93, 1011
- Kent (1987) Kent, S. M. 1987, AJ, 93, 816
- Kewley et al. (2010) Kewley L. J., Rupke D., Jabran Hahid H., Geller M. J., Barton E. J., 2010, ApJ, 721, L48.
- Kormendy & Kennicutt (2004) Kormendy, John; Kennicutt, Robert C., Jr. 2004, ARA&A, 42, 603
- Krabbe et al. (2008) Krabbe, A. C., Pastoriza, M. G., Winge, C., Rodrigues, I., & Ferreiro, D. L. 2008, MNRAS, 389, 1593
- Krabbe et al. (2011) Krabbe, A. C., Pastoriza, M. G., Winge, C., Rodrigues, I., Dors, O. L.,& Ferreiro, D. L. 2011, MNRAS, 416, 38
- Krabbe et al. (2014) Krabbe, A. C., Rosa, D. A., Dors, O. L., Pastoriza M. G., Winge C., Hägele G. F., Cardaci M. V., Rodrigues I., 2014, MNRAS 437, 1155
- Kronberger et al. (2006) Kronberger, T., Kapferer, W., Schindler, S., Böhm, A., Kutdemir, E., & Ziegler, B. L. 2006, A & A, 458, 69
- Kuzio de Naray, McGaugh & de Blok (2008) Kuzio de Naray, R., McGaugh, S. S., de Blok, W. J. G., 2008, ApJ, 676, 920
- Lambas et al. (2003) Lambas, D. G., Tissera, P. B., Alonso, M. S., Coldwell, G., 2003, MNRAS, 346, 1189
- Lambas et al. (2012) Lambas D. G., Alonso S., Mesa V., O’Mill A. L., 2012, A&A, 539, A45
- Larson & Tinsley (1978) Larson, R. B., Tinsley, B. M., 1978, ApJ, 219, 46
- Lucy (1974) Lucy, L. B. 1974, AJ, 79, 745
- Mendes de Oliveira et al. (2003) Mendes de Oliveira, C., Amram, P., Plana, H., & Balkowski, C. 2003, AJ, 126,2635
- Mihos & Bothun (1997) Mihos, J. C., & Bothun, G. D. 1997, ApJ, 481, 741
- Mihos & Herquist (1994) Mihos, J. C., Hernquist, L. 1994, ApJ, 425, L13
- Monet et al. (2003) Monet, D. G. et al. 2003, AJ, 125, 984
- Naab & Burkert (2003) Naab, T., Burkert, A., 2003, ApJ, 597, 893
- Navarro, Frenk & White (1995) Navarro, J. F., Frenk, C. S., & White, S. D. M. 1995, MNRAS, 275, 56
- Navarro, Frenk & White (1996) Navarro, J. F., Frenk, C. S., & White, S. D. M. 1996, ApJ, 462, 563
- Navarro, Frenk & White (1997) Navarro, J. F., Frenk, C. S., & White, S. D. M. 1997, ApJ, 490, 493
- Pastoriza, Donzelli & Bonatto (1999) Pastoriza, M. G., Donzelli, C. J., & Bonatto, C., 1999, A&A, 347, 55
- Palunas & Williams (2000) Palunas, P., Williams, T. B., 2000, AJ, 120, 2884
- Perez, Michel-Dansac & Tissera (2011) Perez, J., Michel-Dansac, L., Tissera, P. B., 2011, MNRAS, 417, 580
- Peterson & Huntley (1980) Peterson, C. J. & Huntley, J. M. 1980, ApJ, 242, 913
- Pogge & Martini (2002) Pogge, R. W. & Martini, P. 2002, ApJ, 569, 624
- Qu et al. (2011) Qu Y., Di Matteo P., Lehnert M. D., van Driel W., Jog C. J., 2011, A&A, 535, A5
- Quinn, Herquist, & Fullagar (1993) Quinn, P. J., Hernquist, L., Fullagar, D. P., 1993 ApJ, 403, 74
- Richardson (1972) Richardson, W. H. 1972, J. Opt. Soc. Am., 62, 55
- Robotham et al. (2012) Robotham, A. S. G. et al. 2012, MNRAS, 424, 1448
- Rodrigues et al. (1999) Rodrigues, I., Dottori, H., Brinks, E., & Mirabel, I. F. 1999, AJ, 117, 2695
- Rosa et al. (2014) Rosa, D. A., Dors, O. L., Krabbe, A. C., Hägele, G. F., Cardaci, M. V., Pastoriza, M. G., Rodrigues, I., Winge, C., 2014, MNRAS, 444, 2005
- Rubin et al. (1991) Rubin, V. C., Hunter, D. A., & Ford, W. K. 1991, ApJS, 76, 153
- Rubin et al. (1999) Rubin, V. C., Waterman, A. H., & Kenney, J. D. P. 1999, AJ, 118, 236
- Salo & Laurikainen (1993) Salo, H., & Laurikainen, E. 1993, ApJ, 410, 586
- Schlafly & Finkbeiner (2011) Schlafly, E. F. & Finkbeiner, D. P. 2011, ApJ, 737, 103
- Schwarzkopf & Dettmar (2000) Schwarzkopf, U., & Dettmar, R. J. 2000, A&A, 361, 451
- Sérsic (1968) Sérsic J. L. 1968, Atlas de Galaxias Australes. Observatorio Astronómico, Córdoba
- Simonneau & Prada (2004) Simonneau, E., Prada, F. 2004, Rev. Mex. Astron. Astrofis., 40, 69
- Somerville, Primack & Faber (2001) Somerville, R. S., Primack, J. R., Faber, S. M. 2001, MNRAS, 320, 504
- Spergel et al. (2007) Spergel, D., et al. 2007, ApJS, 170, 377
- Tamm et al. (2012) Tamm, A., Tempel, E., Tenjes, P., Tihhonova, O. & Tuvikene, T. 2012, A&A, 546, 4
- Thies & Kohle (2001) Thies, C., & Kohle, S. 2001, A&A, 370, 365
- van Albada et al. (1985) van Albada, T. S., Bahcall, J. N., Begeman, K., Sancisi, R. 1985, AJ, 295, 305
- van den Broek et al. (1991) van den Broek, A. C., van Driel, W., de Jong, T., Goudfrooij, P., Lub, J., de Grijp, M. H. K. 1991, A&AS, 91, 61
- Walker, Mihos & Herquist (1996) Walker, I. R., Mihos, J. C., Hernquist, L., 1996, ApJ, 460, 121
- Wechler et al. (2002) Wechsler, R. H., Bullock, J. S., Primack, J. R., Kravtsov, A. V., & Dekel, A. 2002, ApJ, 568, 52
- Weinzirl et al. (2009) Weinzirl, T., Jogee, S., Khochfar, S., Burkert, A., Kormendy, J. 2009, ApJ, 696, 411
- Winge et al. (in preparation) Winge, Cládia, et al. in preparation
- Woods & Gueller (2007) Woods D. F., Geller M. J. 2007, ApJ, 134, 527