The polarization observables , , and and their impact on multipoles
Abstract
Data on the polarization observables , , and for the reaction are reported. Compared to earlier data from other experiments, our data are more precise and extend the covered range in energy and angle substantially. The results were extracted from azimuthal asymmetries measured using a transversely polarized target and linearly polarized photons. The data were taken at the Bonn electron stretcher accelerator ELSA with the CBELSA/TAPS detector. Within the Bonn-Gatchina partial wave analysis, the new polarization data lead to a significant narrowing of the error band for the multipoles for neutral-pion photoproduction.
keywords:
baryon spectroscopy , meson photoproduction , polarization observables , multipoles1 Introduction
The measurement of the two double polarization observables [1] and [2] in photoproduction of neutral pions revealed significant differences between the data and the predictions from analyses such as MAID [3], SAID [4], and BnGa [5]. Partly, large discrepancies were observed even at rather low photon energies. This was surprising since the reaction is certainly the best studied photoproduction process. These discrepancies underline the importance of polarization observables for an interpretation of photoproduction data.
In this letter, we report a measurement of further polarization observables, called , , and , for the reaction
| (1) |
All three observables were determined simultaneously from the same measurement and provide the next important step toward a better understanding of photoproduction. The target asymmetry is a measure of the azimuthal asymmetry when the target nucleon carries polarization in a direction perpendicular to the beam axis. , often termed the recoil polarization observable, is a measure of the induced polarization of the recoiling nucleon. Here, is determined from a double polarization measurement rather than from an experimentally more challenging direct measurement of the recoil polarization. This has the advantage that can be determined in the very same measurement for almost the full solid angle, rather than by measuring for specific points in angle and energy, as it has been done in the past. The observables and can be determined from azimuthal asymmetries using measurements with linearly polarized photons and transversely polarized target nucleons having polarization . Part of the data presented here were used as a basis for an energy independent partial wave analysis (PWA) [6]. They are now included in the BnGa PWA and multipoles for reaction (1) were determined. The multipoles were compared to those from MAID, SAID, Juelich2015 [7] and earlier BnGa PWA-solutions.
2 The experiment
The experiment was performed at the Bonn Electron Stretcher Accelerator ELSA [8]. Linearly polarized photons were produced by scattering a 3.2 GeV electron beam off a diamond crystal [9]. The crystal was oriented to position the coherent edge at 950 MeV, leading to a polarization maximum of % at 850 MeV which declined to 40% at 700 MeV. Two perpendicular settings of the beam polarization plane were used (named and ). Photon energies were measured in a tagging system described in Ref. [9].
The photon beam hits a butanol () target with transversely polarized protons [10] with a mean proton polarization of %. Data were taken with two opposite settings of the target polarization direction (named and ).
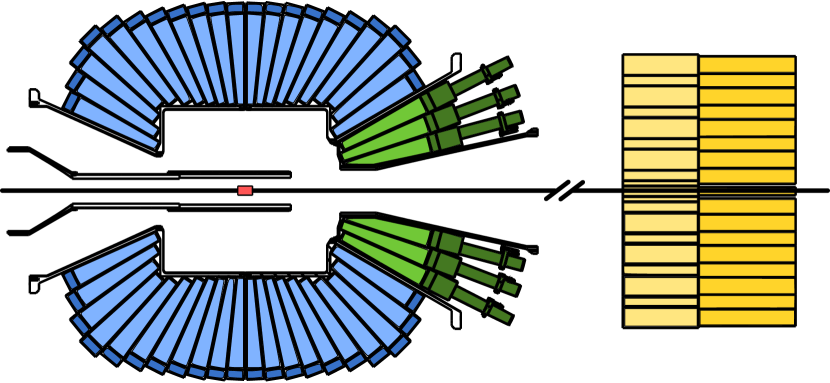
The incoming photons may produce a in the reaction (1). The neutral pions were reconstructed from their decays in the Crystal Barrel (1320 CsI(Tl)-crystals) [11] and TAPS (216 BaF2 crystals) [12, 13] electromagnetic calorimeters (see Fig. 1) which cover almost the full angular range down to in the forward direction. Protons from reaction (1) were detected in a three-layer cylindrical scintillation detector with 513 fibers [14] surrounding the target, in 180 small organic scintillators in front of 90 forward CsI(Tl) crystals covering the angular range from 27.5∘ to 11.2∘, and in organic scintillators mounted in front of each of the BaF2 crystals. A CO2 Cherenkov detector was installed in front of the BaF2 crystals to identify background from electromagnetic reactions. The first-level trigger was derived from the tagger, the fiber detector, the forward calorimeters, and from the CO2 Cherenkov detector as a veto; a second-level trigger used a FAst Cluster Encoder (FACE) [15] and selected events with at least two distinct calorimeter hits in the full detector assembly.
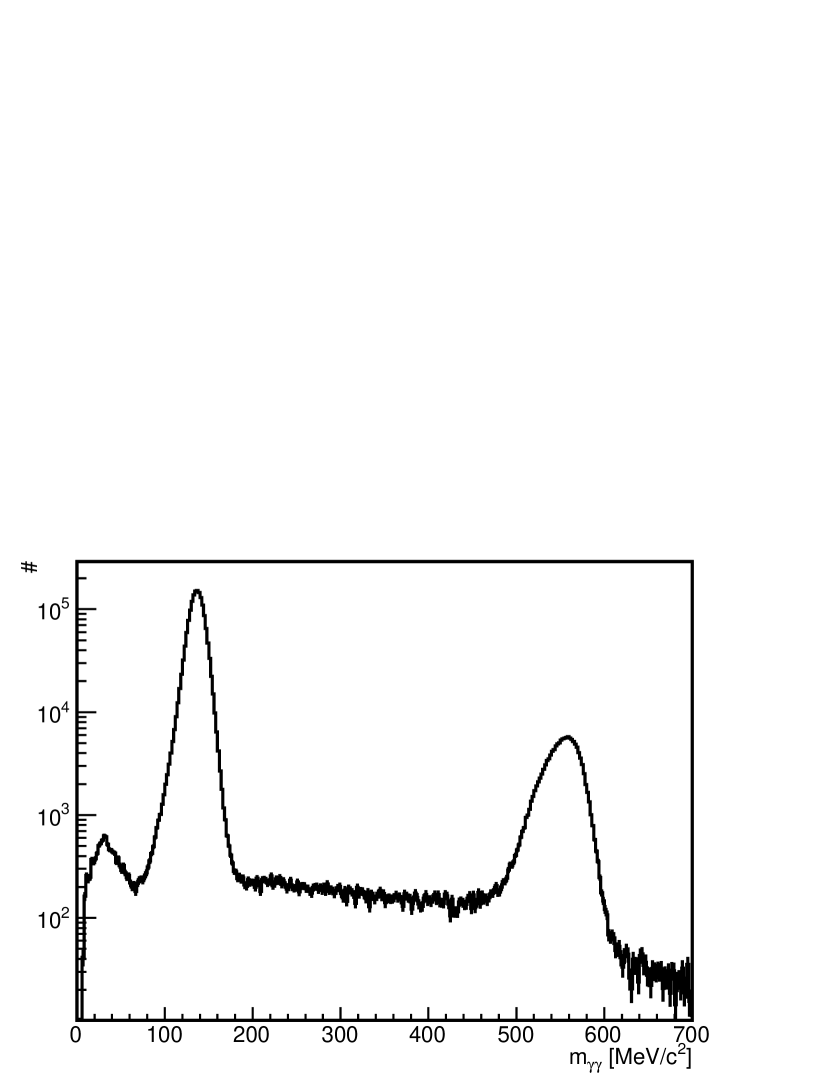
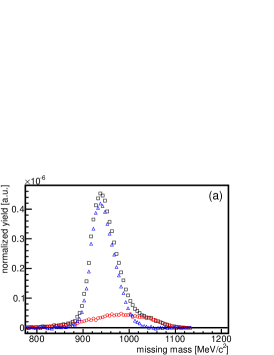
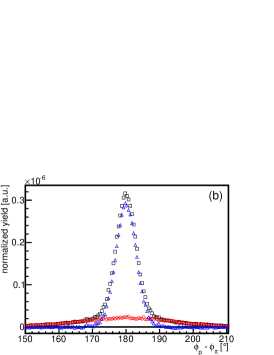
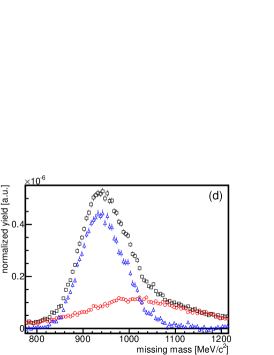
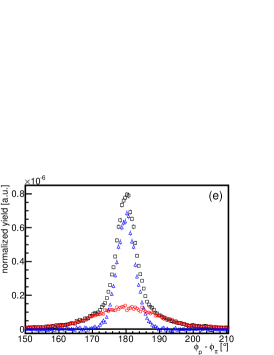
For further analysis only events with three distinct calorimeter hits were used. Adding events where only the two photons were measured would lead to an increased background contribution from other channels since several of the cuts discussed below can no longer be applied. For the events with three calorimeter hits, all three possible combinations were treated as candidates, with the proton being treated as a missing particle. Kinematic cuts were applied to ensure momentum conservation. Examples for the missing mass and azimuthal angle difference distributions are shown in Fig. 3. Energy- and angle-dependent cuts were applied based on the corresponding distributions. In addition, a -cut on the polar-angle difference between the directions of the missing proton and the measured proton candidate was performed, and events were selected by a cut on the invariant mass. Finally, a time coincidence was required between the tagger hit and the reaction products and a random-time background subtraction was performed. This resulted in a final data sample containing a total of million events. The background contamination was estimated from the invariant mass spectrum (see Fig. 2), assuming a linear behaviour of the background under the peak. It is less than 1% for all energies and angles. The selected events for each of the four combinations of beam and target polarization directions were normalized to the corresponding photon flux and polarization degree for further analysis.
 |
 |
 |
 |
 |
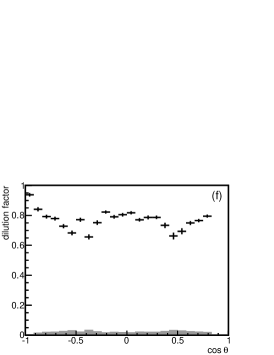 |
Since a butanol target was used, not only polarized and unpolarized free protons contributed to the count rates but also reactions occurring on the bound unpolarized nucleons of the carbon and oxygen nuclei. Additional measurements using a carbon foam target were performed to determine the so-called dilution factor
| (2) |
which assumes that the nucleons bound in carbon and oxygen show the same response to the impinging photons. The carbon foam target had the same size as the butanol target and approximately the same target area density as the carbon and oxygen part in the butanol. The carbon target replaced the butanol target in the frozen spin cryostat to match the experimental conditions of the butanol measurement as closely as possible. The flux-normalized carbon yield was compared to the flux-normalized butanol data using the distribution of the angle between the and proton in the azimuthal plane outside the region where contributions from free protons can be expected (see Fig. 3). Counting the yields for , a global scaling factor was determined based on which the dilution factor (Eq. 2) was calculated using
| (3) |
Taking the slightly different densities of the butanol and carbon targets into account, one would expect a scaling factor of , which is in agreement with the value obtained from the data. Energy- and angle-dependent deviations from the global scaling factor were investigated by determining indepently for each bin and comparing it to the global value. The observed deviations are of the same magnitude as their statistical uncertainty. The global value is used, with the deviation contributing to the systematic uncertainty.
Figure 3 shows, for two energy bins, the azimuthal angle difference and the missing mass distributions of the butanol and scaled carbon data as well as their resulting difference. From these distributions the dilution factor as function of for each energy bin was determined. The dilution factor is quite large, around 0.9 at low energies and decreasing to around 0.6 at higher energies. Note that a dilution factor corresponds to non-existent carbon background and therefore to no dilution. The observed structures (Fig. 3) are due to a combined effect of reduced efficiencies for clusters impinging onto detector boundaries and Fermi smearing. They are reproduced in Monte Carlo simulations. At higher energies, the reduced missing mass resolution required a wider cut. Therefore the carbon contribution remaining after all cuts increased significantly, resulting in a smaller dilution factor.
3 The polarization observables
In the coordinate frame of the detector system, with being the azimuthal angle of the photon beam polarization plane in the setting, the azimuthal angle of the target polarization vector in the setting, and the azimuthal angle of the produced , the differential cross section can be written as
| (4) |
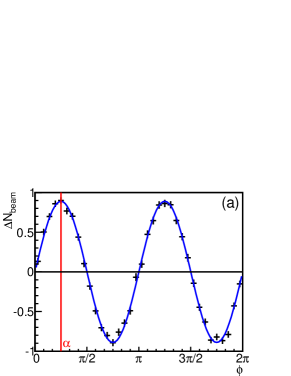
In a first step, the ordinary beam asymmetry for each bin in energy and angle was determined:
| (5) |
A typical distribution is shown in Fig. 4a. The resulting beam asymmetries agree very well with previously reported measurements [9, 16, 17] although the data sample contains in part reactions off nucleons of the C/O-nuclei. Results for are not shown here.
 |
 |
 |
 |
 |
 |
To determine , the asymmetry of the data sets with respect to the target polarization directions and was used, resulting in
| (6) |
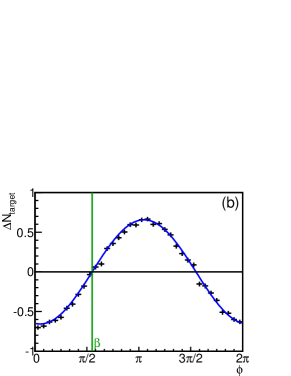
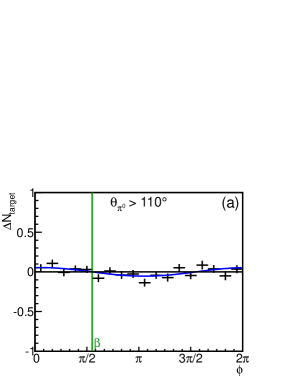
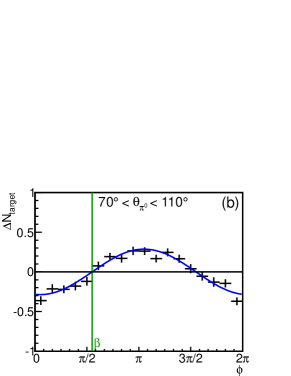
with given by Eq. 2. The target asymmetry was determined by a fit to the distributions as shown by the example in Fig. 4b. Figure 5 shows for three different angular bins (=1.82 –1.94 GeV). These distributions underline the strong dependence of on the scattering angle .
and can be extracted from the data by considering the linear beam-polarization plane ( and ) in addition to the target polarization, leading to
| (7) |
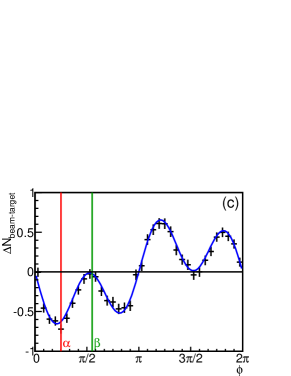
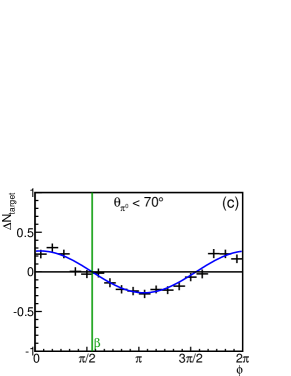
with average beam polarization and , the direction of the polarization plane in the setting. Again, the observables could easily be determined by a fit to the distributions, see Fig. 4c.
 |
 |
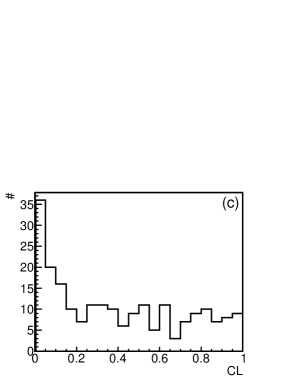 |
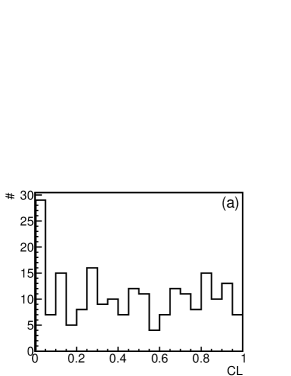
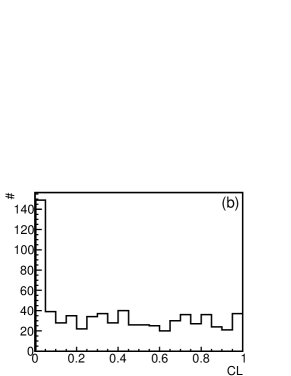
The distributions were fitted for each bin in energy and angle . The resulting confidence level (CL) distribution for the fits is flat with a distinct increase well below 0.1%, as can be seen in Fig. 6. This increase was traced to fits of distributions with very low statistics (due to a low cross section or low acceptance). These fits were very sensitive to background fluctuations. These data were excluded from further analysis by performing a CL-cut at 0.1%.
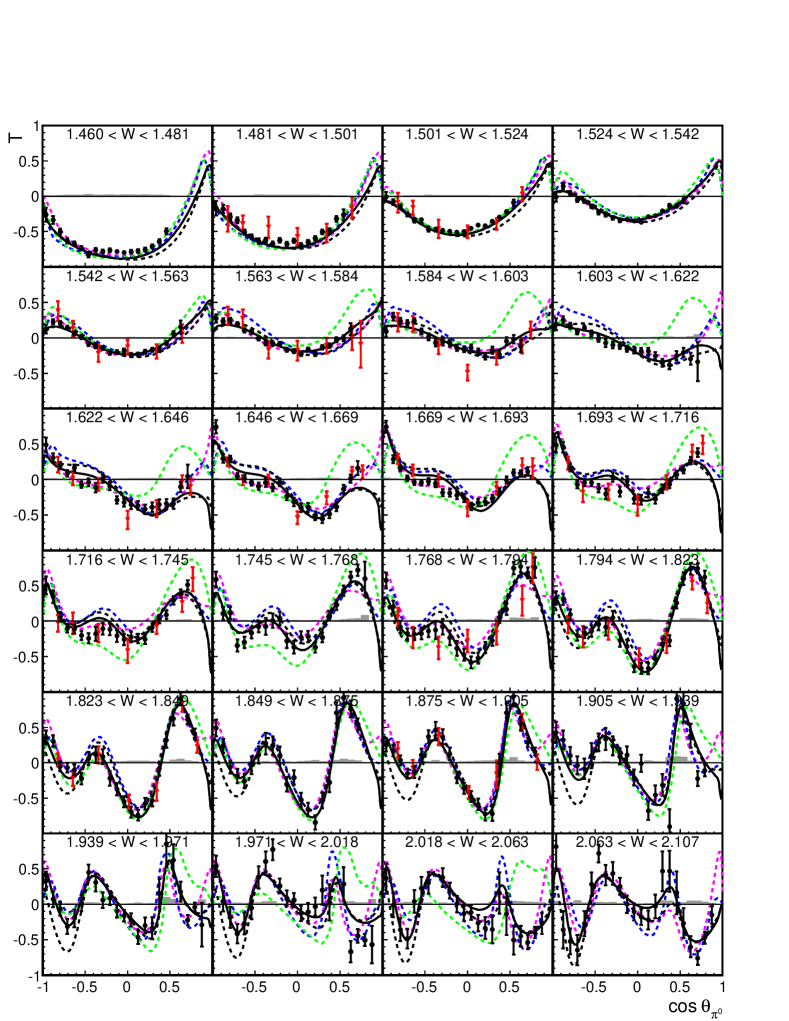
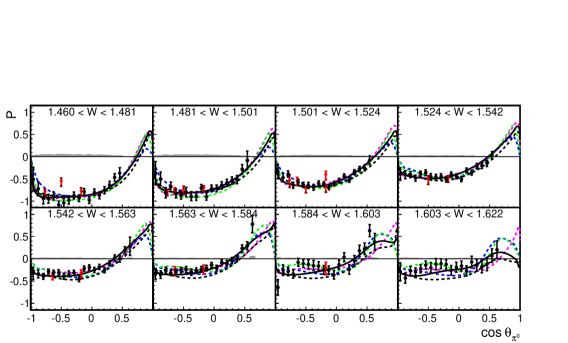
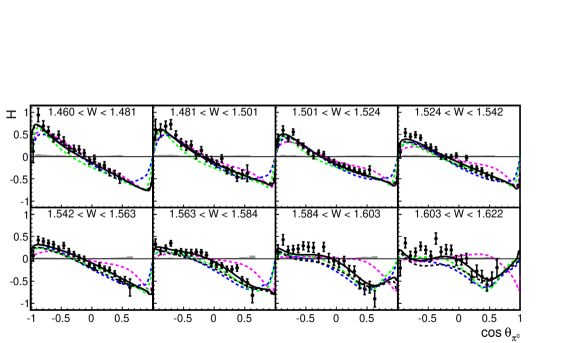
The data on , , and as functions of center-of-mass energy and angle are shown in Figs. 7–9. All observables exhibit a strong angular dependence which also changes significantly with . The systematic uncertainty shown includes the uncertainty in the degree of photon (4%) and proton (2%) polarizations, in the dilution factor (1%–4%), and an additional absolute uncertainty (0.01) due to the remaining background contribution. For further details on the estimation of the systematic uncertainties see Refs. [9, 10, 18].
The polarization observable describes the polarization of the outgoing proton in the direction perpendicular to the scattering plane. Here, it was determined indirectly from the correlation of beam and target polarization. Thus, both observables, and , were measured only in the energy region in which the photon beam carried a significant linear polarization; the results are hence restricted to the 665 to 930 MeV photon energy range. The target asymmetry , shown in Fig. 7, does not require polarized photons, and the data allowed us to determine up to MeV. Above this energy, the count rates were small, and we do not present those results here.
The new data agree well with previously reported measurements of [19] and [20] but exceed the old data in precision and coverage in angles and energy. For no earlier data exist in this energy range, the older data [21] are limited to 1300 MeV. Our data up to 930 MeV were used as a basis for an energy independent PWA [6]. The high energy -data are presented here for the first time. The new data sets have been included in the BnGa-PWA as discussed in the following.
4 Partial wave analysis
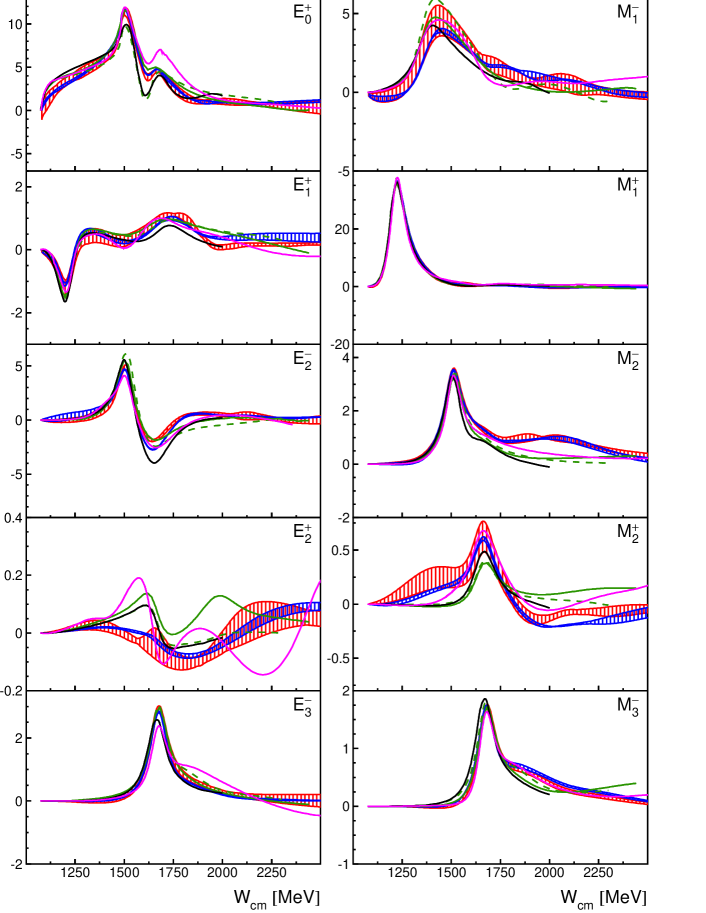
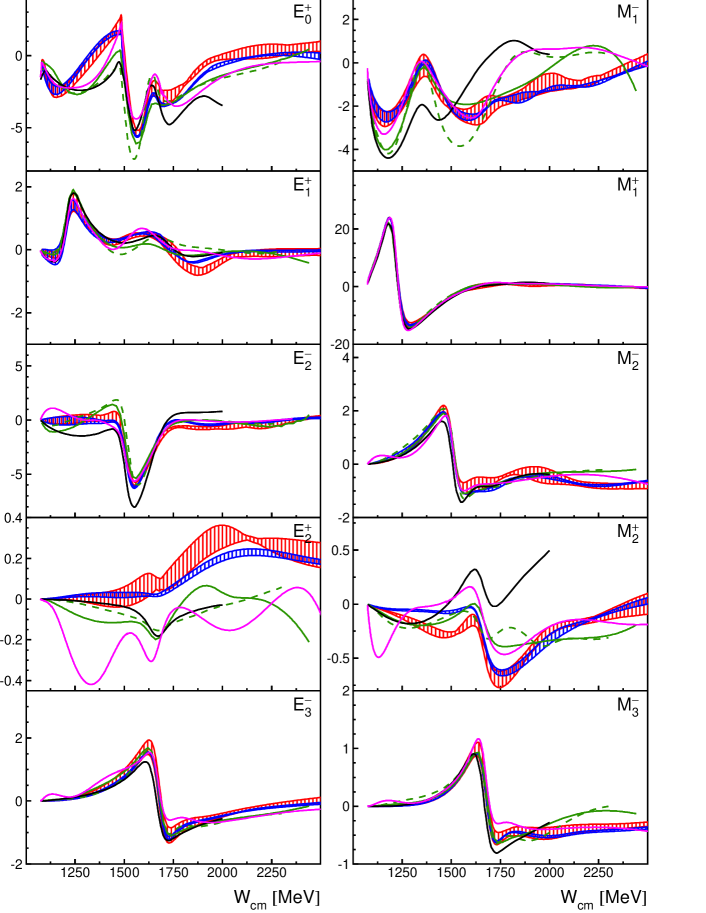
The data were fitted within the BnGa multi-channel partial wave analysis. Compared to our solutions BnGa2011-01 and BnGa2011-02, further data were included [1, 2, 25]. Relevant for the multipoles are the new data on , , and as well as our recently published data on [1] and on [2]. Figures 10 and 11 compare the newly determined multipoles with those of BnGa2011-01 and BnGa2011-02. The error bands for the BnGa2011 solutions were derived from the () spread of 12 different solutions with different assumptions on the ingredients: the number of poles in the wave was 3 or 4, in the wave 2 or 3, the width of the pole converged to a wide (600 MeV) or a narrow (250 MeV) value, a K-matrix formalism was used or, alternatively, an -parametrization [23]. The ranged from its minimum to . (Note that the absolute value is meaningless since part of the data are multiparticle final states and fitted in an event-based likelihood fit. The log likelihood value is then converted into a pseudo- [5].)
In the new fits, we started from the same solutions and re-optimized all parameters. All fits converged, but 6 fits resulted in a larger than the new -minimum () by 1000 units or more. These fits, mostly those with only 3 poles in the wave, were then removed from the error analysis. The resulting error bands for all remaining solutions within are also shown in Figs. 10 and 11. The -range for the new solutions was chosen consistently with the BnGa2011 solutions for which the multipoles have first been shown in [24].
The new error bands are significantly smaller than the previous ones. Averaged over all multipoles and energies, the errors are reduced by a factor of 2.25. Examples for multipoles which are substantially better defined are the multipole to which the Roper resonance and contribute and the multipole to which the -resonances contribute. In most cases, the old error bars cover the range of new solutions, the solutions are at least compatible with each other at the level over the full mass range.
There are few changes to the multipoles only: The multipole leading to the excitation of and resonances with has kept its structure but its imaginary part has increased in strength in the fourth resonance region. Similar changes are also visible in the real part. The real part of the multipole () has become smaller in absolute value in the region, while in the imaginary part changes are observed in the high mass region around . In all cases, where discrepancies with the MAID and SAID solutions were observed, these discrepancies remain while the consistency between BnGa2011 and BnGa2014 is rather good. The multipoles from Juelich2015 [7] show also significant differences compared to BnGa2014.
Summarizing, we have reported a simultaneous measurement of the polarization observables , , and . With the data presented here an additional step toward a complete experiment in -photoproduction off the proton has been made. The data provide a more precise determination of the photoproduction multipoles governing the photoproduction of single neutral pions off protons.
Acknowledgement
We thank the technical staff of ELSA, the polarized target group, and the participating institutions for their invaluable contributions to the success of the experiment. We acknowledge support from the Deutsche Forschungsgemeinschaft (SFB/TR16) and Schweizerischer Nationalfonds.
References
-
[1]
A. Thiel et al.,
Phys. Rev. Lett. 109, 102001 (2012).
R.L. Workman, M.W. Paris, W.J. Briscoe, and I.I. Strakovsky, Phys. Rev. Lett. 110, 169101 (2013);
A. Thiel et al., Phys. Rev. Lett. 110, 169102 (2013). - [2] M. Gottschall et al., Phys. Rev. Lett. 112, 012003 (2014).
- [3] D. Drechsel, S. S. Kamalov and L. Tiator, Eur. Phys. J. A 34, 69 (2007).
- [4] R. L. Workman et al., Phys. Rev. C 85, 025201 (2012).
- [5] A. V. Anisovich, R. Beck, E. Klempt, V. A. Nikonov, A. V. Sarantsev and U. Thoma, Eur. Phys. J. A 48, 15 (2012).
- [6] J. Hartmann, H. Dutz et al., Phys. Rev. Lett. 113, 062001 (2014).
- [7] D. Rönchen et al., arXiv:1504.01643 [nucl-th].
- [8] W. Hillert, Eur. Phys. J. A 28S1, 139 (2006).
- [9] D. Elsner et al., Eur. Phys. J. A 39, 373 (2009).
- [10] Ch. Bradtke, H. Dutz, H. Peschel et al., Nucl. Instrum. Meth. M A 436, 430 (1999).
- [11] E. Aker et al., Nucl. Instrum. Meth. A 321, 69 (1992).
- [12] R. Novotny et al., IEEE Trans. Nucl. Sci. 38, 379 (1991).
- [13] A.R. Gabler et al., Nucl. Instrum. Meth. A 346, 168 (1994).
- [14] G. Suft et al., Nucl. Instrum. Meth. A 538, 416 (2005).
- [15] H. Flemming, doctoral thesis, University of Bochum (2001).
- [16] O. Bartalini et al., Eur. Phys. J. A 26, 399 (2005).
- [17] N. Sparks et al., Phys. Rev. C 81, 065210 (2010).
- [18] J. Hartmann, doctoral thesis in preparation, University of Bonn (2015).
-
[19]
V.G. Gorbenko et al., Pisma Zh. Eksp. Teor. Fiz. 19, 659 (1974).
V.G. Gorbenko et al., Yad. Fiz. 27, 1204 (1978).
A.A. Belyaev et al., Nucl. Phys. B 213, 201 (1983).
J.O. Maloy, Ph.D. Thesis, 1961. 141pp.
V.G. Gorbenko et al., Pisma Zh. Eksp. Teor. Fiz. 22, 393 (1975).
P.J. Bussey et al., Nucl. Phys. B 154, 492 (1979).
S. Kato et al., Nucl. Phys. B 168, 1 (1980).
A.S. Bratashevsky et al., Nucl. Phys. B 166, 525 (1980).
A.S. Bratashevsky et al., Ukr. Fiz. Zh. (Russ.Ed.) 31, 1306 (1986). -
[20]
V.G. Gorbenko et al., Pisma Zh. Eksp. Teor. Fiz. 19, 659 (1974).
V.G. Gorbenko et al., Yad. Fiz. 27, 1204 (1978).
P.S.L. Booth et al., Nucl. Phys. B 121, 45 (1977).
P. Feller et al., Nucl. Phys. B 110, 397 (1976).
V.G. Gorbenko et al., Yad. Fiz. 26, 320 (1977).
H. Herr et al., Nucl. Phys. B 125, 157 (1977).
M. Fukushima et al., Nucl. Phys. B 136, 189 (1978).
P.J. Bussey et al., Nucl. Phys. B 154, 492 (1979).
K.S. Agababian et al., Yad. Fiz. 50, 1341 (1989).
M.M. Asaturian et al., JETP Lett. 44, 341 (1986).
A. Bock et al., Phys. Rev. Lett. 81, 534 (1998).
J.O. Maloy, Ph.D. Thesis, 1961. 141pp. - [21] P.J. Bussey et al., Nucl. Phys. B 159, 383 (1979).
- [22] R. L. Workman et al., M. W. Paris, W. J. Briscoe and I. I. Strakovsky, Phys. Rev. C 86, 015202 (2012).
- [23] A. Sarantsev, ”N/D-based method for the analysis of meson production data” (in preparation).
- [24] A. V. Anisovich, R. Beck, E. Klempt, V. A. Nikonov, A. V. Sarantsev and U. Thoma, Eur. Phys. J. A 48, 88 (2012).
-
[25]
E. Gutz et al.,
Eur. Phys. J. A 50, 74 (2014)
V. Sokhoyan et al., “High statistics study of the reaction ” in preparation.
V. Sokhoyan et al., Phys. Lett. B746 (2015) 127.
V. L. Kashevarov et al., Phys. Rev. C 85, 064610 (2012).
M. L. Good and R. R. Kofler, Phys. Rev. 183, 1142 (1969).
J. C. Doyle, F. S. Crawford and J. A. Anderson, Phys. Rev. 165, 1483 (1968).
O. I. Dahl et al.,Phys. Rev. 163, 1430 (1967) [Erratum-ibid. 183, 1520 (1969)].
O. Goussu et al.,Nuovo Cim. A 42, 606 (1966).
T. C. Jude et al.,Phys. Lett. B 735, 112 (2014).
R. D. Baker et al., Nucl. Phys. B 145, 402 (1978).
T. O. Binford et al., Phys. Rev. 183, 1134 (1969).
O. I. Dahl et al.,Phys. Rev. 163, 1430 (1967) [Erratum-ibid. 183, 1520 (1969)].
L. L. Yoder et al., Phys. Rev. 132, 1778 (1963).
P. Aguar-Bartolome et al.,Phys. Rev. C 88, no. 4, 044601 (2013).