Short Gamma-Ray Bursts with Extended Emission Observed with Swift/BAT and Fermi/GBM
Abstract
Some short GRBs are followed by longer extended emission, lasting anywhere from 10 to 100 s. These short GRBs with extended emission (EE) can possess observational characteristics of both short and long GRBs (as represented by GRB 060614), and the traditional classification based on the observed duration places some of them in the long GRB class. While GRBs with EE pose a challenge to the compact binary merger scenario, they may therefore provide an important link between short and long duration events. To identify the population of GRBs with EE regardless of their initial classifications, we performed a systematic search of short GRBs with EE using all available data (up to February 2013) of both Swift/BAT and Fermi/GBM. The search identified 16 BAT and 14 GBM detected GRBs with EE, several of which are common events observed with both detectors. We investigated their spectral and temporal properties for both the spikes and the EE, and examined correlations among these parameters. Here we present the results of the systematic search as well as the properties of the identified events. Finally, their properties are also compared with short GRBs with EE observed with BATSE, identified through our previous search effort. We found several strong correlations among parameters, especially when all of the samples were combined. Based on our results, a possible progenitor scenario of two-component jet is discussed.
keywords:
gamma-ray bursts: general - method:search for extended emission1 Introduction
The progenitors of extremely energetic gamma-ray bursts (GRBs) are most likely either the core collapse of a massive star (collapsar; woosley1993; mac01) or the coalescence of two compact objects (neutron stars or black holes) in a binary system (see e.g., eichler89). An increasing number of observational facts point toward association of long GRBs (longer than a few seconds) with massive stars collapsing into black holes (wb06) or possibly fast-rotating magnetars (tho04). In particular, observational predictions of the collapsar scenario include association with core-collapse supernovae (SNe), and also with late-type host galaxies having active star formation.
On the other hand, for short GRBs (lasting less than a few seconds), observations so far have yielded no support, even contradictions with the collapsar scenario. There has been no SN association with any short GRBs albeit some extensive search efforts were in place (ber14). Short GRBs seem to occur relatively nearby (with cosmological redshift, 1), and their host galaxies can be both early-type and late-type. Moreover, the short emission timescales and the energetics involved pose challenges for the collapsar model. Therefore, the compact-binary merger scenario remains to be the most plausible picture to account for their observational properties.
For intermediate-duration GRBs (5 s), however, the classification may not be clear-cut: over the last decade, a growing population of short GRBs with extended emission (EE) has emerged. These events are characterized with an initial short burst phase, followed by a much longer ( few tens of seconds) emission episode. EE components are usually (but not always) relatively dimmer and spectrally softer compared to the initial short spike. GRBs with EE exhibit several spectral and temporal properties of both short and long GRBs, therefore, could play a pivotal role in understanding the nature of both canonical burst types.
Since the first clear identification of such “hybrid” GRBs in 2006 (GRB 060614; gehrels06), there has been a few extensive investigations to search for more of these type of events and uncover their observational characteristics. Norris & Bonnell (2006) have identified 15 GRBs with EE via visual inspection of 2700 bursts observed with Burst and Transient Source Experiment (BATSE) on board Compton Gamma-Ray Observatory, among which 8 GRBs were investigated. They found that the spectral lags for the initial spikes of these events were negligible. Bright long GRBs, on the contrary, usually display noticeable lags, with an average of 50100 ms (norris00). All of these events were classified as long GRBs with the durations, 2 s in the BATSE catalog. In addition, extended emission was also identified in a dozen short-duration GRBs observed with Swift/Burst Alert Telescope (BAT), in the Bayesian block representation of their lightcurves (norris10; norris11; sak11). The initial spikes of these events are also spectrally harder and displayed no spectral lags. Most of them were associated with X-ray afterglow observed with Swift/X-Ray Telescope (XRT), that are brighter and longer lasting than the afterglow of non-EE GRBs.
We previously searched systematically the entire BATSE GRB dataset to identify GRBs with EE that are similar to GRB 060614 (bos13). We found 18 such GRBs with clear EE components within the BATSE data, and investigated their properties. Here, we extend our search to include all GRBs observed with Fermi/Gamma-ray Bust Monitor (GBM) and Swift/BAT before February 2013 (regardless of their duration). A few notable advantages of extending the search to GBM and BAT events are:
-
1.
It increases the total sample size of GRBs with EE, providing better statistics for examining their overall properties,
-
2.
About 80% of all BAT GRBs have afterglow observation with XRT, and 30% have measured redshift values; if found, the afterglow and the source-frame properties of GRBs with EE can be investigated, and
-
3.
There are many GRBs observed simultaneously with GBM and BAT; if such common GRBs are associated with EE, more in-depth information about the EE could be obtained, as well as shed light on systematic differences between the instruments.
In this paper, we present the results of our systematic search for short GRBs with EE using the data of Swift/BAT and Fermi/GBM, and subsequent analysis of the events identified with the search. Below, the event selection and the search methodology are described in §2, and the search results and investigation of the detection sensitivity are presented in §3. Then in §4, we present the properties of the candidate events based on our analysis. Finally, we discuss the implication of our results in §LABEL:sec:discussion.
2 Event Selection and Search Methodology
We first selected all events that consist of initial short spikes, and the selected events were then subjected to the EE search described in detail below. We used all available data up to January 31, 2013 for both BAT and GBM. We applied essentially identical search methodology to both BAT data and GBM data, which was also used for our previous systematic search with BATSE data (bos13). However, the data coverage, reduction procedures, and the data types are different for the two instruments, and therefore, slight adjustments were made according to the detector characteristics, which we describe in this section.
2.1 Data and Event Selection
For both BAT and GBM events, the first sample selection was made
based on the burst duration () published in their catalogs
(pac12; sak11). We note that is calculated in slightly
different energy bands for the two detectors; 15350 keV for BAT
and 50300 keV for GBM, due to the difference in the
sensitivities and energy coverage of the detectors. All short GRBs
with 5 s were included in the systematic search for EE.
Additionally, to identify and include in the search all GRBs with
correct morphology (i.e., containing initial short spikes regardless
of their ), we first subjected all of the long GRBs to a
morphological test as described next.
BAT: There are 685 GRBs detected with BAT between 20 November 2004 and 31 January 2013, among which 95 are short ( 5 s) and 590 are long GRBs ( 5 s).
For all of the long events, we extracted background-subtracted (i.e., mask-weighted) lightcurves in 15350 keV with 64-ms time resolution, using batbinevt included in HEASOFT version 6.12. The count rates were then multiplied by the number of enabled detectors for each event to obtain the total count rates.
GBM: There are 1040 GRBs detected with GBM between 1 August 2008 and 31 January 2013, among which 246 are short ( 5 s) 794 are long GRBs ( 5 s).
For each of the long GRBs, we used Time-Tagged Event (TTE) burst
data binned to 64-ms time resolution, and subtracted the background
rate, which is an average count rate of a pre-burst interval (30 s to 2 s, where is the burst trigger time).
For both BAT and GBM, we then subjected the lightcurves of the long GRBs to the following morphological criteria:
-
1.
The burst peak occurs before +5 s, and
-
2.
The count rates remain below 30% (or 40% for some BAT events with low peak rate of 11k count/s) of the peak count rate for at least 50% of the rest of the duration after the peak time until +5 s.
We found 33 BAT (103 GBM) events out of 590 (808) long GRBs that matched the morphological criteria. We then searched for EE in these events together with the 95 (184) short GRBs. The total numbers of events subjected to the search was 128 for BAT and 287 for GBM.
2.2 Background Determination
Correct background modeling is crucial in detecting the EE components, as EE can be weak and only slightly above the background. For BAT, the background is not an issue since the lightcurve produced is mask-weighted, meaning that the lightcurve is essentially background free if there is no other bright source (usually known) in the field of view.
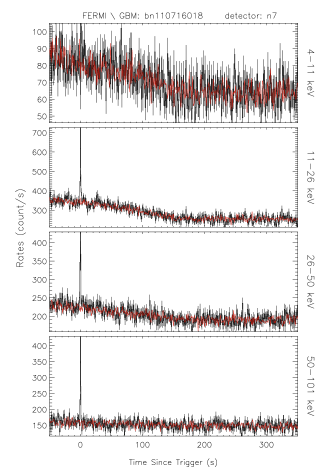
For GBM, on the other hand, the background rates at the time of a transient event have to be estimated by modeling, based on its long-term behavior in all energy band. The GBM background can be quite variable over a relatively-long period of time, which could hinder a simple polynomial interpolation. Therefore, as suggested by fit11 and as used also for our previous EE search with the BATSE data, we determined background rates for GBM events from the data of adjacent days. The Fermi satellite was at the same coordinates every 15 orbits (corresponding to 24 hours), and the spacecraft rocking angle was the same every 2 orbits. Thus, we used either the average of orbits or the average of and orbits (see also fit11). When both types of orbital data were available, we compared the average rms of the count rates over a pre-burst interval of 50 to 10 s of the triggered and the orbital data, and the orbital background that better matched the data rms was used for the search. An example of such orbital background lightcurve is shown in Figure 1.
Using the orbital background, we generated the background-subtracted lightcurves for 257 GRBs out of the 287 GBM GRBs. There were 30 GRBs for which the data of the previous orbits were either not available or incomplete, and the orbital background could not be used. Visual inspection of these events revealed two bursts that clearly showed extended emission, so we used low-order polynomial interpolation to model the background rates for the two events, which are indicated accordingly in Table 1. The other 28 bursts were excluded from the sample. Additionally, for one event also showing EE (GRB 121029), the orbital background was available but clearly not matching; therefore, the background was modeled with a polynomial function around the burst time also for this event.
2.3 EE Search Criteria and Method
Our EE search is based on Signal-to-Noise Ratio (SNR) of binned lightcurve. The EE search criteria we employed here were identical to those used in our previous search with BATSE data. The criteria were defined based on previously-observed short GRBs with EE, such as GRB 060614 (gehrels06) and those found by norris06, all of which seem to constitute the hybrid class of short and long GRBs. We first extracted energy-resolved lightcurves for all of the GRBs in our sample, as follows:
BAT: We extracted 1-s resolution lightcurves both background-subtracted and with background (i.e., unweighted), for each of the 128 GRBs in four energy bands; 1525, 2550, 50100, and 100150 keV. We used the unweighted lightcurves for determining the background fluctuation ( values).
GBM: For each of the 260 GRBs, we
subtracted background for two detectors in which the event appeared brightest, using daily CTIME
data rebinned to 1-s resolution. The CTIME data provide 8
energy channels in 52000 keV.
For both BAT and GBM, we subsequently binned the lightcurves with 4-s resolution between and s and calculated the SNR of each bin. We used the lightcurves of two energy bands: 50 keV and 50100 keV. The lowest energy thresholds were 15 for BAT, and 10 keV for GBM. The search algorithm positively identified EE when SNR above background for at least consecutive 12 s (3 bins) in any of these energy bands. In case of GBM, the criteria had to be met in both detectors for the positive identification of the EE, as GBM data did not provide specific directional information. We further checked the lightcurves of all 12 NaI detectors of GBM candidates so as to exclude the possibility that the detected EE was due to another soft transient source.
3 Search Results and Detection Sensitivities
Using these criteria, we found 37 BAT GRBs and 72 GBM GRBs as candidates for short GRBs with EE. We subsequently inspected each one of these candidates, and manually eliminated ones with obvious background issues (e.g., Earth occultation of another source or data mismatch over longer period), as well as those that are clearly multi-episodic long GRBs based on the morphology and the spectral hardness. We additionally excluded the events whose EE was not visible at all in any other energy range, to reduce the possibility of chance detection.
After the manual filtering, we were left with 16 BAT GRBs and 14 GBM
GRBs as the true EE candidates. We list all of the identified events
in Table 1 with their , durations of the spikes
and the EE (see §3.1), and afterglow observation
information where available. The lightcurves of all of these
candidate events are available online,111Available at
http://people.sabanciuniv.edu/yuki/GRBEE_BAT_GBM_all.pdf one of which
is shown as an example in Figure 2. As seen in
Table 1, most of the BAT events with EE have associated
afterglow observations in x-ray and optical bands, and 8 events have
their redshift values available. There are 3 events for which X-ray
flares are seen in their X-ray lightcurves observed with Swift
X-Ray Telescope (XRT). One event’s flare actually coincides with
the EE detected here (GRB 100212A; see §4.2 for the
discussion). The redshift values are mostly 1, which is
consistent with short GRBs’ redshift distribution (ber14). One
exception to this is GRB070506 with . This is an
exceptionally high value for a short GRB.
Among these, 5 GRBs were common events observed both with BAT and with GBM, which we also indicate in Table 1 with C1 or C2. For two of the five common events, EE was only detected in BAT in our search. The common events were additionally subjected to joint spectral analysis and discussed separately in §4.3. Our search also detected EE components in the GBM data of two additional common events, GRB 090518 and GRB 091127, extending up to 300 s and 15 s after the trigger, respectively. However, we found out that GRB 090518 EE was an activity from Vela X-1 coinciding with the GRB direction (C. Wilson-Hodge, private communication), which was flagged by the fact that the BAT lightcurve showed no indication of the EE. GRB 091127 was a long GRB associated with SN 2009nz (cob10). Thus these events were excluded from the list of candidates.
We note that although these 30 candidate GRBs presented in Table 1 all cleared the search criteria, some of them may be of different nature based solely on their lightcurves. They all contain initial short spikes of 5 s indeed; however, there are cases where, for example, there is a preceding weaker peak that makes the actual duration of the spike longer (GRB 090131), or the entire burst is pretty spiky that the subsequent “extended emission” appears to be rather a continued episode of a long GRB (GRB 091120). Nonetheless, as it is difficult to classify events only from their lightcurves, we did not exclude these events from the list. In addition, for one of the BAT events (GRB 051016B), Vela X-1 with varying flux was in the BAT field-of-view at the time of the burst trigger. Therefore, we caution that the possibility of contribution of this X-ray source to the EE detected in GRB 051016B cannot be ruled out. All of these candidate events were subjected to the subsequent analysis.
Finally, the candidates also include 7 of the 12 BAT GRBs with EE previously identified by norris10 and sak11. The other 5 were not found in our search because the extended emission components of 4 of them were too short and too weak for our search criteria, and one of them had a spike 5 s so did not meet our morphological criteria. We note that albeit short and weak, there are visible indications of extended emission in the lightcurves of these 5 events.
| GRB name | Time | Afterglow | X-ray flare | |||||||
|---|---|---|---|---|---|---|---|---|---|---|
| UT | (s) | (s) | (s) | (s) | (s) | |||||
| BAT | ||||||||||
| 050724 | 12:34:09 | 96 | 2.76 | 107 | 0.02 | 3.04 | XOR | 0.258 | +10 | |
| 051016B | 18:28:09 | 4 | 4.03 | 33 | 0.07 | 4.23 | XO | 0.9364 | +409s | |
| 060614 | 12:43:49 | 108.7 | 5.89 | 169 | -1.55 | 7.24 | XO | 0.125 | – | |
| 061006 | 16:45:51 | 129.9 | 2.05 | 113 | -23.2 | 2 | XO | 0.4377 | – | |
| 061210 | 12:20:39 | 85.3 | 0.13 | 77 | 0.21 | 1.04 | X | 0.4095 | – | |
| 070506 | 5:35:58 | 4.3 | 5.25 | 15 | 3.75 | 38 | XO | 2.31 | – | |
| 070714B | 4:59:29 | 64 | 2.88 | 39 | 0.8 | 32.29 | XO | 0.92 | – | |
| 080503 | 12:26:13 | 170 | 0.38 | 147 | 0.11 | 6 | XO | – | – | |
| C1 | 090531B | 18:35:56 | 80 | 1.02 | 54 | 0.29 | 2.04 | X? | – | – |
| 090927 | 10:07:16 | 2.2 | 2.18 | 28 | 0.06 | 2.95 | XO | 1.37 | – | |
| C1 | 100212A | 14:07:22 | 136 | 2.18 | 135 | 0.32 | 1.86 | XO | – | +100s |
| C2 | 100522A | 3:45:52 | 35.3 | 3.97 | 15 | 0.68 | 23.86 | X | – | – |
| C2 | 110207A | 11:17:20 | 80.3 | 3.07 | 137 | 0.184 | 10.6 | – | – | – |
| C2 | 110402A | 0:12:57 | 60.9 | 2.52 | 82 | 3.56 | 6.08 | XO | – | – |
| 111121A | 16:26:24 | 119 | 2.37 | 61 | 0.04 | 4 | X | – | – | |
| 121014A | 20:11:56 | 80 | 0.96 | 81 | 0.10 | 14.8 | – | – | – | |
| GBM | ||||||||||
| 080807 | 23:50:33 | 19.07 | 1.28 | 27 | 0.12 | 1.15 | – | – | – | |
| 090131 | 2:09:21 | 35.07 | 7.81 | 23 | 1.98 | 22.27 | – | – | – | |
| 090820 | 12:13:17 | 15.3 | 0.77 | 7 | -0.19 | 8.32 | – | – | – | |
| 090831 | 07:36:37 | 39.42 | 0.45 | 86 | 0.12 | 0.32 | – | – | – | |
| 091120 | 4:34:40 | 50.18 | 2.82 | 52 | 0.00 | 2.81 | – | – | – | |
| 100517 | 3:42:08 | 30.46 | 1.41 | 11 | 0.12 | 22.02 | – | – | – | |
| C2 | 100522 | 3:45:52 | 35.33 | 3.97 | 13 | 0.64 | 26.49 | X | – | – |
| C2 | 110207 | 11:17:20 | 37.89 | 3.07 | 38 | 0.32 | 2.68 | – | – | – |
| C2 | 110402 | 0:12:58 | 35.65 | 1.41 | 39 | 0.32 | 1.08 | XO | – | – |
| 110824 | 0:13:10 | 76.61 | 1.54 | 93 | 0.00 | 1.54 | – | – | – | |
| 111228 | 10:52:50 | 2.94 | 6.53 | 30 | 0.51 | 25.7 | – | – | – | |
| 120402 | 16:04:01 | 20.22 | 5.63 | 19 | 2.30 | 4.16 | – | – | – | |
| 120605 | 10:52:16 | 18.11 | 2.82 | 8 | 0.57 | 12.41 | – | – | – | |
| 121029 | 8:24:20 | 15.81 | 0.38 | 6 | 0.12 | 10.75 | – | – | – |
Taken from sak11 and pac12
The begining of the spike and the EE since trigger time
X = X-ray, O = optical, R = radio
The afterglow and redshift information was obtained from J. Greiner’s web page at http://www.mpe.mpg.de/j̃cg/grbgen.html as well as from the XRT lightcurve repository at http://www.swift.ac.uk/xrt_curves
Also identified as GRBs with EE in norris10 using Bayesian block method
Double-episodic event; see §4.2 for more information
Background rates were modelled with low-order polynomial interpolation
Calculated using 1.024 resolution
3.1 Durations of Spikes and EE
It is noteworthy that none of our 30 candidate events can be classified as “short GRBs” by the conventional definition of s. However, they all consist of short spikes, so we systematically determined the durations of the spike and the EE separately for each event with Bayesian block (BB) method (sca13). The BB representation simplifies the lightcurve with a series of step function that could easily reveal local structures in the time series. The duration, then, was the beginning and the end of the spike or EE blocks. We adopted the algorithm of sca13 to generate a BB lightcurve for each event in the energy range in which the EE was detected (usually keV). We used the mask-tagged data for BAT and background-subtracted CTIME data for GBM, with 64-ms and 1-s resolutions for this purpose.
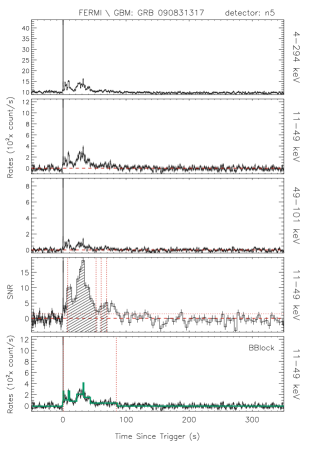
We first applied the BB method using the 1-s resolution data on the interval, 50 s before and 400 s after the burst trigger time for each burst to determine . For the peak duration, we utilized the 64-ms data for both BAT and GBM, for the interval 40 s prior and 20 s after the burst trigger time. We could not measure peak duration of two GBM events (GRBs 110207 and 110402) due to insufficient statistic. Therefore, we listed peak durations of these two in 1-s domain in Table 1. In cases where the end of the spike and the beginning of the EE were not clear-cut, we took the beginning of the block with the lowest intensity around +5 s as the beginning of . In the lightcurves available from the links given above, the BB lightcurve of each event is also shown with the intervals of spike and EE indicated. An example is shown in Figure 2.
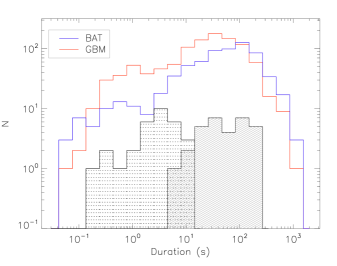
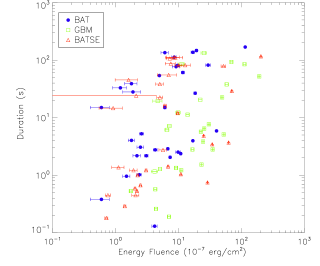
The resulting BB duration of the spikes and EE are presented in Table 1 as and respectively, along with the start time of the spike and the EE ( and ). In Figure 3, we compare the durations of the spikes and the EE components of our candidate events to the distributions of all BAT and GBM GRBs observed up to January 31, 2013. The majority of our candidate events have spikes that are longer than the 2-s division line, up to 10 s. We caution, however, that the population comparison in Figure 3 is associated with a caveat: the GBM and BAT durations are values (i.e., time during which 90% of photons are emitted) determined in the most sensitive energy range of each instrument, in photon space for GBM (pac12) and mostly with the BB method for BAT (sak11). Here, our duration is the total emission time in the energy range in which the EE was detected. We further note that, the duration values of the 3 common GRBs with EE identified in both BAT and GBM data (GRBs 100522A, 110207A, and 110402A), are not necessarily consistent between the BAT data and GBM data. This is because the EE components may have been identified in different energy ranges, in addition to the difference between the sensitivities of the two instruments. So in the histogram, they are included with their BAT duration and GBM duration independently.
3.2 Detection Rates and Sensitivities
To probe the sensitivity limits of both BAT and GBM and the rate of the false-positive EE detection, we have simulated large sets of EE lightcurves (LCs) and subjected them to our EE search algorithm, which we describe in details below.
For each event and for each instrument, we first simulated the EE using the actual Bayesian block representation of the EE LC (in the energy band where the EE was identified), and added random noise to the simulated EE. The noise distribution used here is Gaussian for BAT data and Poisson for GBM data, decided based on the real error distributions. We then added the simulated, noise-added EE to the “burst-free” background LC of the same energy range, which are:
BAT: mask-weighted LC of the time interval from +150 to 900 s, displaced by 150 s (so the background LC starts at ) for most of the bursts. In the cases of bursts with long EE or data with shorter time coverage, the time interval was from ) to MAX(data time).
GBM: real data for pre-/post- time
intervals which is the start time of the data to –10 s and
+10 s to the end time of the data. In between, we
use the background model fitted to the pre-/post-burst time
intervals using a 2nd order polynomial function.
We show an example of simulated EE LCs and their background in Figure 4 for GRB 100522A (a common event observed with both GBM and BAT). As seen in the figure, the simulated EE was placed at the actual start time of the EE determined by the Bayesian method (= ) for each instrument.


3.2.1 EE detection sensitivity
For each event and instrument, we varied the amplitude of the simulated EE component nominally with 2, 1, 0.90.1 (in 0.1 steps), and 0 the actual Bayesian block amplitudes. This was done for 3 energy bands: 1525, 2550, and 1550 keV, one of which was used for the original Bayesian block LC for each event. We simulated 10,000 LCs for each amplitude and energy band, and subjected them to our EE search algorithm. For each set of LCs, our aim was to determine the amplitude level at which at least 90% of the simulated LCs could be detected. To better constrain the 90 percentile amplitude level, we repeated the same procedure in narrower amplitude interval, with finer amplitude steps as necessary. We find that the 90 percentile amplitudes of both BAT and GBM samples are anti-correlated with their corresponding flux, as expected.
Finally, in order to determine the detection sensitivities while minimizing the effect of various LC morphology on the detection rates, we also simulated all EE with single step functions of the actual EE durations and 10- amplitudes. Again, we simulated 10,000 LCs for the same set of amplitude values and energy bands as above, and subjected them to our EE search algorithm. Based on our simulation results, we determined the 90 percentile EE detection flux level (i.e., 90 percentile amplitude times the average EE flux) for each event. We then determined the average 90 percentile flux for each instrument. We find that the average energy flux level above which more than 90% of the simulated EE are detected is ergs cm s (for GBM) and ergs cm s (for BAT) in 1550 keV (see Figure 5).


3.2.2 False detection rates of our search method
As stated at the beginning of this section, the search actually yielded more potential EE candidates than what we present in this paper. We went through the 5-panel lightcurves (e.g., Figure 2) one by one for these potential candidates, and excluded the ones with obvious background issues, obvious long GRBs, or the ones with EE seen only in single energy band. Then, our final list of candidates included 16 BAT GRBs and 14 GBM GRBs. From these numbers, we could say that the inferred false detection rates of our search, with the specific set of criteria for the specific types of EE, are 57% and 79%. Although these numbers may seem high, we believe that the fact that we went through all the potential candidate lightcurves and filtered out the actual falsely-detected events, makes this not an issue for a concern.
Lastly, as an alternative way to probe the false detection rate due to the data fluctuations and/or the choice of our background models, we also searched for 12-s 1.5 deficit in the SNR LCs for all events that were subjected to the original EE search. The search identified such deficits in 6 BAT and 4 GBM events. Among the 6 BAT deficits 4 of them are only seen in 50-100 keV band and well isolated from the bursts by 150 s. The other 2 deficits were detected only in 25-50 keV band. One of them starts at 230 s after the burst; however, the other one (for GRB 121017A) was detected at 20 s after the burst, which may have been identified as an EE candidate if this had been an excess, and the indication of the deficit is also seen in 15–25 keV. Thus, the false detection rate based on the deficit search is 1/128 (1%) for the BAT sample. The deficit found for the 4 GBM events were all clearly due to mismatched orbital background data. Therefore, for our GBM sample, the false detection rate based on the deficit search is even lower than that of the BAT sample.
4 Properties of the EE Events
4.1 Spectral Lags
One of the main characteristics that makes some GRBs with EE “short” GRBs is that the initial spikes usually show no (or close to nil) spectral lags. Thus, we calculated the spectral lags for the initial spikes of all of these events, as well as for the EE components where possible. We used lightcurves with various time resolutions of 8 to 512 ms (for both BAT and GBM) in the energy bands of 50–100 keV and 15–25 keV for BAT, and 100–300 keV and 25–50 keV for GBM, unless otherwise noted. The time interval used for each event was the spike or EE duration presented in Table 1. For each event, we determined a cross-correlation function between the lightcurves of the two energy bands, which was subsequently fitted with a cubic function. The peak of the fitted cubic function was taken as the lag. The uncertainties in the lags were estimated with the same simulation method that we used previously for the BATSE sample, which is described in bos13.
| Spike | EE | |||
| GRB name | Lags | Err | Lags | Err |
| (ms) | (ms) | (ms) | (ms) | |
| BAT | ||||
| 050724 | 6.29 | 5.28 | ||
| 051016B | 4.58 | 3.32 | ||
| 060614 | 5.83 | 5.61 | 5.46 | 5.39 |
| 061006 | 17.92 | 16.32 | 96.93 | 96.70 |
| 061210 | 6.05 | 4.80 | ||
| 070506 | 39.23 | 29.30 | 494.43 | 296.48 |
| 070714B | 8.03 | 7.78 | ||
| 080503 | –7.56 | 4.82 | 40.51 | 8.95 |
| 090531B | 5.21 | 4.07 | ||
| 090927 | 4.77 | 2.38 | ||
| 100212A | 2.53 | 2.42 | 255.14 | 204.83 |
| 100522A | 26.36 | 25.77 | 78.48 | 64.86 |
| 110207A | 3.15 | 2.78 | 38.33 | 37.34 |
| 110402A | 32.93 | 28.64 | 40.39 | 37.43 |
| 111121A | 1.00 | 0.93 | ||
| 121014A | –17.30 | 13.59 | 596.32 | 560.79 |
| GBM | ||||
| 080807 | –3.38 | 3.54 | 46.18 | 44.18 |
| 090131 | 101.84 | 95.49 | 89.10 | 79.18 |
| 090820 | –0.01 | 0.49 | 196.86 | 131.38 |
| 090831 | 28.97 | 19.88 | 23.72 | 28.57 |
| 091120 | 57.50 | 51.34 | 41.98 | 42.35 |
| 100517 | 76.22 | 62.79 | -82.24 | 76.50 |
| 100522 | 35.14 | 32.29 | ||
| 110207 | 22.29 | 18.27 | 62.39 | 66.86 |
| 110402 | 5.80 | 5.50 | 89.05 | 48.67 |
| 110824 | 29.54 | 24.06 | 59.04 | 55.70 |
| 111228 | 27.40 | 24.13 | ||
| 120402 | 2.52 | 0.64 | ||
| 120605 | 43.27 | 38.69 | 203.24 | 127.11 |
| 121029 | 12.00 | 8.52 | 70.89 | 63.26 |
lag calculated in 25–50 keV/15–25 keV
lag calculated in 50–100 keV/25–50 keV
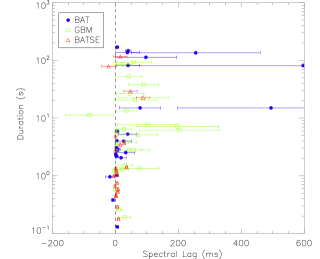
The spectral lag values that we found are presented in Table 2. For 20 events (9 BAT and 11 GBM), in which the EE was bright enough to allow lag calculations, the lag values for the EE are also shown in the table. Although some of the errors are large, the average lags are 19 ms for the spikes and 122 ms for the extended emission. In Figure 6, we show spectral lags as a function of their duration ( or ). For a comparison, we also over-plot the values found from our previous analysis of BATSE EE GRBs. There is an indication of a positive correlation between the spectral lags and the duration ( or ) within the BAT sample as well as when all samples are combined (BAT + GBM + BATSE; see §4.4, albeit large uncertainties associated with some values. We also looked at the correlations with -corrected (source frame) durations for the 8 events with known redshift values but found null results.
4.2 Spectral Analysis
In order to examine spectral properties of these short GRBs with EE as well as to obtain their energetics, we performed spectral analysis of these events using RMFIT222R. S. Mallozzi, R. D. Preece, & M. S. Briggs, ”RMFIT, A Lightcurve and Spectral Analysis Tool,” © Robert D. Preece, University of Alabama in Huntsville. version 4.0rc1. For each event, we analyzed the spectra of the spike and the EE separately. The time intervals of the spike and EE spectra were matched to those given in Table 1.
For the BAT events, we extracted spectra with an energy range of 15150 keV (80 energy channels) and generated corresponding detector response matrices using batdrmgen, which utilizes the online calibration database. For the GBM events, we used TTE data providing 128 energy channels in 5–2000 keV binned to 64-ms time resolution. The actual fitted energy range was 8–1000 keV after excluding several low-energy channels and the high-energy overflow channel (gru14). For each event, we selected a set of NaI detectors with detector-to-source angles less than (pac12), and fit the data of these detectors simultaneously. Since some of the EE components were rather dim, the accurate background modeling was essential for the spectral analysis also. We modeled the background spectrum of each of the GBM event with a polynomial function, and subsequently compared it to match the orbital background we used in the search procedure. To account for a possible systematic normalization offset between the multiple detectors, we also included multiplicative “effective area correction” factor (EAC) in the initial fits using spike spectra of the bursts. We did find, however, in each case, the normalization factors were very close to 1 in most cases and were fixed in the final fits.
We fitted each spectrum (spike and EE separately) with three models: a power law (PWRL), cut-off power law (or “Comptonized”; COMP), and the Band function (BAND; band93), by minimizing . The best-fit model for each spectrum was subsequently determined based on the improvements in their values for additional degrees of freedom. In Table 3, we present the best-fit model parameters along with the energy fluence, peak flux, and hardness ratios. The hardness ratio here was calculated in photon space using the best-fit spectral parameters.
| GRB | Component | Model | /dof | Energy | Hardness | |||
|---|---|---|---|---|---|---|---|---|
| Name | (keV) | Fluence | Ratio | |||||
| BAT | ||||||||
| 050724 | Spike | PWRL | –1.67 0.12 | 62.5 / 56 | 4.3 0.2 | 6.8 0.7 | 1.25 0.14 | |
| EE | PWRL | –2.04 0.18 | 71.7 / 56 | 7.3 0.9 | 0.3 0.3 | 0.98 0.17 | ||
| 051016B | Spike | PWRL | –2.42 0.17 | 72.8 / 56 | 1.8 0.2 | 1.1 0.3 | 0.75 0.14 | |
| EE | PWRL | –2.87 0.57 | 47.1 / 56 | 1.2 0.3 | 0.3 0.2 | 0.55 0.38 | ||
| 060614 | Spike | PWRL | –1.67 0.04 | 46.6 / 56 | 40.4 1.1 | 15.5 1.7 | 1.26 0.05 | |
| EE | PWRL | –2.10 0.02 | 55.0 / 56 | 115.3 1.2 | 4.0 1.0 | 0.93 0.02 | ||
| 061006 | Spike | PWRL | –1.07 0.06 | 38.0 / 56 | 7.4 0.3 | 12.3 0.8 | 1.89 0.09 | |
| EE | PWRL | –2.23 0.16 | 54.5 / 56 | 8.6 0.8 | 0.5 0.3 | 0.85 0.14 | ||
| 061210 | Spike | PWRL | –0.75 0.14 | 34.9 / 56 | 4.2 0.4 | 24.9 1.7 | 2.39 0.31 | |
| EE | PWRL | –1.73 0.20 | 85.0 / 56 | 9.2 1.2 | — | 1.21 0.23 | ||
| 070506 | Spike | PWRL | –1.79 0.12 | 52.4 / 56 | 2.6 0.2 | 0.5 0.2 | 1.14 0.15 | |
| EE | PWRL | –2.88 0.71 | 40.4 / 56 | 0.6 0.2 | 0.4 0.3 | 0.53 0.45 | ||
| 070714B | Spike | PWRL | –1.10 0.07 | 51.7 / 56 | 6.8 0.3 | 5.7 0.6 | 1.87 0.11 | |
| EE | PWRL | –2.33 0.34 | 40.5 / 56 | 1.8 0.4 | 0.3 0.2 | 0.80 0.30 | ||
| 080503 | Spike | PWRL | –1.85 0.39 | 61.9 / 56 | 0.6 0.2 | 1.8 0.4 | 1.07 0.40 | |
| EE | PWRL | –1.93 0.08 | 44.2 / 56 | 19.4 0.9 | 0.1 0.1 | 1.06 0.08 | ||
| 090531B | Spike | PWRL | –1.25 0.12 | 58.4 / 56 | 2.4 0.2 | 2.1 0.4 | 1.68 0.17 | |
| EE | PWRL | –1.79 0.17 | 54.1 / 56 | 5.0 0.1 | 0.5 0.3 | 1.16 0.19 | ||
| 090927 | Spike | PWRL | –1.88 0.16 | 54.9 / 56 | 2.2 0.3 | 2.1 0.5 | 1.09 0.18 | |
| EE | PWRL | –1.98 0.45 | 67.5 / 56 | 1.9 0.6 | 0.8 0.4 | 1.00 0.46 | ||
| 100212A | Spike | PWRL | –1.42 0.10 | 53.3 / 56 | 3.1 0.2 | 2.0 0.4 | 1.50 0.13 | |
| EE | PWRL | –2.47 0.21 | 64.3 / 56 | 6.1 0.8 | 0.6 0.3 | 0.73 0.24 | ||
| 100522A | Spike | PWRL | –1.67 0.04 | 45.5 / 56 | 17.0 0.5 | 6.9 0.7 | 1.26 0.05 | |
| EE | PWRL | –2.56 0.10 | 45.3 / 56 | 6.1 0.3 | 0.6 0.3 | 0.68 0.07 | ||
| 110207A | Spike | PWRL | –1.29 0.14 | 46.6 / 56 | 2.5 0.3 | 6.6 0.8 | 1.63 0.21 | |
| EE | PWRL | –1.46 0.09 | 48.2 / 56 | 17.0 1.1 | 1.3 0.4 | 1.45 0.12 | ||
| 110402A | Spike | PWRL | –1.04 0.15 | 55.7 / 56 | 9.9 0.9 | 10.5 2.1 | 1.94 0.27 | |
| EE | PWRL | –1.93 0.14 | 52.7 / 56 | 29.7 2.7 | 2.7 1.1 | 1.05 0.14 | ||
| 111121A | Spike | PWRL | –1.22 0.06 | 67.2 / 56 | 10.9 0.4 | 16.0 1.3 | 1.72 0.09 | |
| EE | PWRL | –2.02 0.10 | 58.6 / 56 | 11.8 0.7 | 0.6 0.3 | 1.02 0.10 | ||
| 121014A | Spike | PWRL | –2.27 0.16 | 60.8 / 56 | 1.5 0.2 | 2.1 0.4 | 0.83 0.15 | |
| EE | PWRL | –2.00 0.14 | 51.4 / 56 | 9.7 0.8 | 1.2 0.3 | 1.00 0.13 | ||
| GBM | ||||||||
| 080807 | Spike | PWRL | –1.08 0.02 | 487.7 / 480 | 11.1 0.3 | 23.0 2.3 | 3.72 0.16 | |
| EE | PWRL | –1.33 0.04 | 523.9 / 480 | 18.5 0.9 | 9.5 1.8 | 2.91 0.18 | ||
| 090131 | Spike | COMP | –1.16 0.04 | 56.7 1.2 | 743.9 / 476 | 30.5 0.4 | 40.6 3.0 | 0.77 0.04 |
| EE | COMP | –1.49 0.03 | 154.5 14.0 | 642.7 / 476 | 49.6 0.7 | 48.8 3.8 | 1.74 0.05 | |
| 090820 | Spike | PWRL | –1.68 0.04 | 377.4 / 356 | 4.3 0.2 | 9.0 1.7 | 2.11 0.16 | |
| EE | PWRL | –2.22 0.06 | 409.5 / 356 | 7.2 0.5 | 9.7 1.8 | 1.30 0.20 | ||
| 090831 | Spike | PWRL | –1.34 0.03 | 258.1 / 235 | 7.1 0.3 | 51.6 3.3 | 2.91 0.16 | |
| EE | COMP | –1.65 0.06 | 532 422 | 218.5 / 234 | 112.2 3.4 | 24.0 3.6 | 2.03 0.12 | |
| 091120 | Spike | COMP | –0.76 0.05 | 277.7 18.7 | 515.3 / 470 | 35.1 0.5 | 28.5 3.7 | 2.93 0.08 |
| EE | COMP | –1.10 0.03 | 114.4 3.9 | 631.8 / 470 | 192.3 2.5 | 37.9 4.2 | 1.52 0.04 | |
| 100517 | Spike | COMP | –0.69 0.14 | 92.7 6.8 | 328.2 / 354 | 9.2 0.4 | 22.7 3.2 | 0.05 0.02 |
| EE | COMP | –1.39 0.19 | 26.8 3.2 | 367.2 / 354 | 14.0 0.8 | 6.5 1.5 | 0.36 0.12 | |
| 100522 | Spike | COMP | –0.91 0.07 | 143.810.2 | 445.7 / 470 | 24.7 0.6 | 18.9 2.7 | 1.83 0.09 |
| EE | PWRL | –2.21 0.07 | 466.3 / 471 | 9.9 0.8 | 4.7 1.5 | 1.32 0.23 | ||
| 110207 | Spike | PWRL | –1.25 0.05 | 363.1 / 351 | 5.1 0.3 | 14.2 2.0 | 3.54 0.38 | |
| EE | PWRL | –1.23 0.06 | 353.1 / 351 | 22.3 1.5 | 10.3 1.9 | 3.24 0.33 | ||
| 110402 | Spike | PWRL | –1.18 0.09 | 232.5 / 235 | 4.2 0.5 | 34.3 3.5 | 3.38 0.59 | |
| EE | PWRL | –1.43 0.05 | 265.6 / 235 | 58.5 3.1 | 9.3 2.4 | 2.68 0.22 | ||
| 110824 | Spike | PWRL | –1.02 0.02 | 493.4 / 475 | 23.3 0.4 | 41.2 2.8 | 3.92 0.12 | |
| EE | PWRL | –1.59 0.03 | 541.2 / 475 | 69.4 2.2 | 25.7 2.4 | 2.30 0.12 | ||
| 111228 | Spike | COMP | –0.99 0.08 | 33.9 0.9 | 476.8 / 475 | 25.7 0.5 | 18.9 2.4 | 0.30 0.04 |
| EE | - | — | — | — | — | —- | ||
| 120402 | Spike | COMP | –1.16 0.08 | 50.2 2.2 | 236.8 / 235 | 22.8 0.7 | 15.2 2.3 | 0.66 0.08 |
| EE | PWRL | –2.12 0.13 | 293.8 / 235 | 4.7 0.8 | 5.2 1.7 | 1.35 0.45 | ||
| 120605 | Spike | COMP | –1.13 0.07 | 375.780.1 | 403.9 / 351 | 16.7 0.5 | 28.4 3.7 | 2.70 0.14 |
| EE | PWRL | –1.98 0.06 | 338.7 / 352 | 6.6 0.5 | 6.4 1.6 | 1.62 0.23 | ||
| 121029 | Spike | COMP | –0.74 0.15 | 338.368.7 | 545.7 / 561 | 4.4 0.2 | 19.7 2.8 | 3.25 0.26 |
| EE | COMP | –0.34 0.06 | 178.6 6.1 | 577.7 / 561 | 52.6 0.7 | 40.4 4.3 | 2.48 0.06 |
All uncertainties are 1.
in units of
in units of and calculated in the 15350 keV range
in units of and calculated in the 15350 keV range with 64-ms resolution
calculated in the 2550 keV and 50100 keV ranges for BAT and the 50100 keV and 100300 keV ranges for GBM
no enough statistic for F calculation.
could not perform the spectral fit due to its weak nature
Both the spikes and the EE of all of the BAT events were sufficiently described with PWRL, as expected for the narrow-band spectra of BAT. On the other hand, some GBM spectra are described better with COMP model.
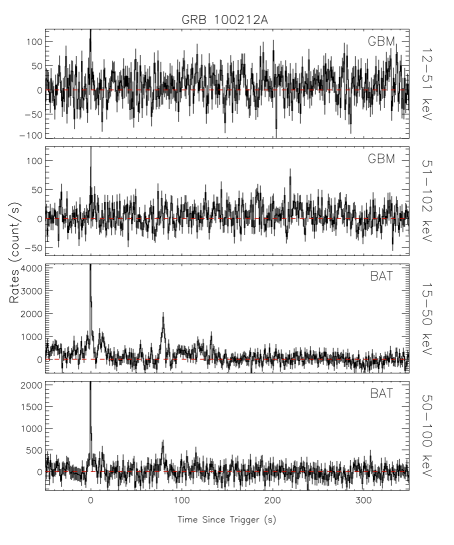
Interestingly, we noticed that the BAT lightcurve of GRB 100212A displayed a secondary spike (at +80 s, see Figure 7) dimmer than the initial spike at , followed by secondary EE. This second episode (both spike and the EE) is actually seen as a X-ray flare in Swift XRT data of the same event333The XRT lightcurve is available at http://www.swift.ac.uk/xrt_curves/00412081/ . We attempted to extract the spectra of the secondary spike and the EE that follows using BAT data (as well as BAT+GBM), but the component was too weak for a spectral analysis. Nevertheless, it is obvious from these lightcurves that the second episode is much softer than the first spike and the first EE (at +10 s). For the spectral analysis of EE of this event presented in Table 3, the duration used as the EE includes the first EE and the entire second episode.
4.3 Common Events
There were a total of 5 GRBs with EE that were observed with both BAT and GBM. For 3 of them EE was identified in both BAT and GBM data in our search (see Table 4 for a summary). The BAT and GBM lightcurves of two example common events are shown in Figure 7.
| EE detected in the search | ||
|---|---|---|
| GRB name | in BAT | in GBM |
| 090531B | yes | no but visible in LC |
| 100212A | yes | no |
| 100522A | yes | yes |
| 110207A | yes | yes |
| 110402A | yes | yes |
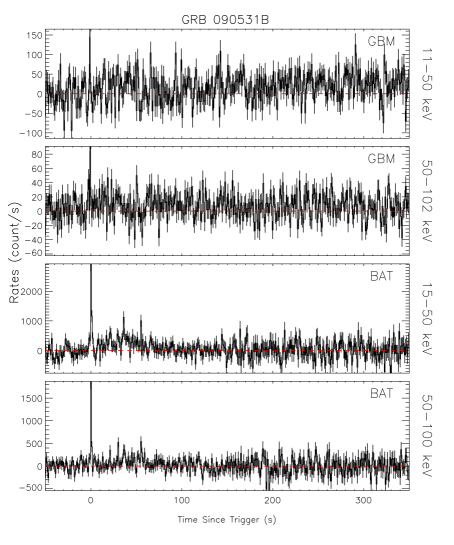
The EE of these two events were identified only in BAT data. Generally speaking, non-detection of EE by GBM may naturally be expected for some weak, soft EE, since BAT has larger effective area over the lower energy range of 10–100 keV than GBM NaI detectors (sta09).
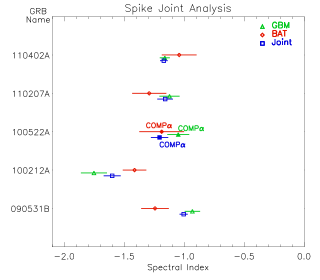
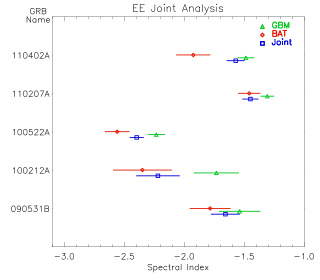
For these 5 common events, we performed joint spectral analysis using both BAT and GBM data of the spikes and the EE. The time intervals of the joint analysis were chosen considering the start and end times of each component of both BAT and GBM data. Then, the earlier start time and later end time of the two were taken as the joint analysis time interval. The exact time intervals are limited by the resolution of GBM data; In order to match the time intervals of both spectra analyzed jointly, we extracted BAT spectra of all these common events with the selected time intervals of the GBM spectra. Moreover, we initially included the EAC factors in the joint fits to account for possible systematic discrepancy between the BAT and GBM NaI data; however, the factors were always close to unity and therefore, not needed in the final fits.
In Figure 8, we compare the spectral indices found in the joint analysis with those found in the single-detector analysis (BAT-only and GBM-only). Most of the joint spectra of both spikes and EE were still best described by PWRL, and there was one case (100522A) in which COMP was better fit to the spectra. In that case, the low-energy power-law index () values are shown in the Figure and indicated as such. Although the BAT energy range used for the spectral analysis (15150 keV) lies well within the GBM energy range (81000 keV), the joint analysis constrained the parameters better in almost all cases as seen in the Figure. The parameters found in the joint analysis of the spikes and EE are more consistent with those found in the GBM-only and BAT-only analysis respectively, although the GBM and BAT parameters are usually consistent within 1–2 (if the same models are used). The joint analysis illustrates that using only the BAT spectrum is not always sufficient to determine the real spectral shape due to the its narrow coverage in relatively softer energy range; nonetheless, adding the BAT data to broader GBM spectra can help better constrain the spectral parameters.
4.4 Correlations
To study the general properties of the spikes and the EE of the 30 candidate events, we looked for correlations among their spectral parameters, durations, lags, and flux/fluence. The correlations were searched separately for the BAT and GBM samples to reduce the chance of finding a false correlation caused by possible systematic differences between the samples. Moreover, we studied the correlations in several different sampling: within the spikes of the 30 events, within the EE components, as well as spike vs. EE, and the spikes and EE all together.
The exact parameters used for the correlation study are: burst’s duration (), durations of each component ( and ), spectral lag, best-fit spectral parameters, energy fluence, peak energy flux, hardness ratio, and total burst energy fluence. For the 8 events with measurements, we also looked at their isotropic-equivalent total energy (), luminosity, and source-frame durations (i.e., ). We also compared the parameters we found in this study to the BATSE sample from our previous study (bos13).
We list in Table 5 only the pairs of parameters between which a significant correlation (with a chance probability, ) was found in at least one of the datasets of BAT, GBM, or BATSE. Only the correlation between the duration and energy fluence is ‘universal’, found to be significant in all three data sets (see Table 5 and Figure 9).
However, including this one, the significance of many correlations greatly improved when all datasets are combined. The most significant combined correlations are found between peak flux and spectral index (), duration and hardness ratio (), and peak flux and hardness ratio (). The correlations between peak flux of spike and EE () also became significant only when all data were combined (see Figure LABEL:dur_hr). It is possible that such an improvement is artificially introduced by putting together samples, each of which has some degree of systematic biases in observed parameters. Uncertainties in cross calibrations among these three instruments may also be a contributing factor. Nonetheless, the most significant combined correlations such as the ones mentioned above (also shown in Figure LABEL:dur_hr) may indicate that the correlations exist when including wider ranges of the parameters, and that each of these instruments is detecting different population in these parameter space. These correlations simply became statistically much more significant with more data points. As we showed in the simulations in §3.2, the EE detection sensitivities of BAT and GBM differs by an order of magnitude, which may explain the scatter in the peak flux values of among the three samples.
| BAT | GBM | BATSE | ALL | |||||||||||||
|---|---|---|---|---|---|---|---|---|---|---|---|---|---|---|---|---|
| Parameters | ||||||||||||||||
| Duration | Spectral Lag | 0.68 | 1.4E4 | 26 | 0.46 | 2.0E2 | 25 | 0.18 | 4.2E1 | 22 | 0.54 | 9.4E7 | 73 | |||
| Duration | Peak Flux | 0.56 | 9.5E4 | 32 | 0.27 | 1.5E1 | 29 | 0.63 | 5.2E5 | 35 | 0.52 | 5.8E8 | 96 | |||
| Peak Flux | Hardness Ratio | 0.70 | 7.3E6 | 32 | 0.45 | 1.4E2 | 29 | 0.44 | 8.3E3 | 35 | 0.55 | 5.6E9 | 96 | |||
| Duration | Hardness Ratio | 0.46 | 7.6E3 | 32 | 0.44 | 1.8E2 | 29 | 0.56 | 4.6E4 | 35 | 0.59 | 1.6E10 | 96 | |||
| Duration | Energy Fluence | 0.48 | 6.0E3 | 32 | 0.65 | 1.4E4 | 29 | 0.54 | 7.4E4 | 35 | 0.46 | 3.1E6 | 96 | |||
| Peak Flux | PWRL Index | 0.71 | 6.3E6 | 32 | 0.53 | 2.8E3 | 29 | 0.60 | 1.4E4 | 35 | 0.68 | 1.5E14 | 96 | |||
| Peak Flux, Spike | Peak Flux, EE | 0.17 | 5.3E1 | 16 | 0.53 | 5.1E2 | 14 | 0.3 | 2.4E1 | 17 | 0.61 | 4.3E6 | 47 | |||
| Hardness Ratio, Spike | Hardness Ratio, EE | 0.36 | 1.8E1 | 16 | 0.82 | 2.9E4 | 14 | 0.01 | 9.7E1 | 17 | 0.27 | 6.4E2 | 47 | |||
Some spectral lag values are associated with large uncertainties, which are not taken into account here (see Table 2)
The hardness ratio are calculated in 50100/2550 keV for BAT, 100300/50100 keV for GBM and BATSE events. For the combined correlation (i.e., ALL), all ratio are calculated in 50100/2550 keV.