Towards chemical structure resolution with nanoscale nuclear magnetic resonance spectroscopy
Abstract
Nuclear magnetic resonance (NMR) spectroscopy has approached the limit of single molecule sensitivity, however the spectral resolution is currently insufficient to obtain detailed information on chemical structure and molecular interactions. Here we demonstrate more than two orders of magnitude improvement in spectral resolution by performing correlation spectroscopy with shallow nitrogen-vacancy (NV) magnetic sensors in diamond. In principle, the resolution is sufficient to observe chemical shifts in 1 T magnetic fields, and is currently limited by molecular diffusion at the surface. We measure oil diffusion rates of nms within (5 nm)3 volumes at the diamond surface.
The extension of nuclear magnetic resonance (NMR) spectroscopy to the nanoscale Degen et al. (2009); Staudacher et al. (2013); Mamin et al. (2013) has important implications for scientific research and technology. In particular, the attainment of sensitivities capable of detecting individual nuclei Müller et al. (2014); Sushkov et al. (2014) has opened the way for non-destructive analysis of single molecules. In this context nitrogen-vacancy (NV) centres in diamond are particularly interesting given they have demonstrated outstanding nanoscale magnetic field sensitivity through a series of foundational experiments Staudacher et al. (2013); Mamin et al. (2013); Müller et al. (2014); Sushkov et al. (2014); Grinolds et al. (2014); Balasubramanian et al. (2008); Rondin et al. (2012); Zhao et al. (2012); Taminiau et al. (2012); Kolkowitz et al. (2012); McGuinness et al. (2013); Steinert et al. (2013). However, whilst the sensitivity of NV-based NMR allows for few spin detection, the spectral resolution is below that required to observe chemical shifts, thereby severely restricting the determination of chemical structure.
The NV center is a paramagnetic defect in diamond consisting of a nitrogen impurity and a neighbouring vacancy. The spin triplet ground state possesses long coherence time and can be detected optically via coupling to optical transitions. Measuring the energy splitting between magnetic sublevels of a single NV center allows determination of the local magnetic field Balasubramanian et al. (2008). The sensitivity of the measurement is then defined by the precision that the energy levels can be determined, which depends upon the coherence time and associated linewidth of the spin transition Taylor et al. (2008). A narrower linewidth not only allows smaller field strengths to be detected, via shifts in the line position, but also allows finely separated energy levels to be resolved.
For NV-based sensing, closely spaced energy levels may arise from dipolar interaction between the NV electronic spin and nuclei in molecules a few nanometers away, or from the internal energy structure of such molecules. Spectral resolution below part per million levels (with respect to applied magnetic field) is vital to observing chemical shifts, quadrupole interactions and dipolar couplings which allow molecular structure to be derived. Likewise, the identification of hyperfine interactions induced by NV centers at few nanometers distance from nuclear spins requires sub-kilohertz spectroscopy. Therefore prolongation of the NV sensing time beyond this limit is important to enable applications of nanoscale sensing to structural analysis, and is especially relevant for centers located close to the diamond surface.
One approach to improve NV magnetic resonance spectroscopy is to remove decoherence sources which act to limit the detection time, either using quantum control techniques (e.g. dynamical decoupling) or by physical treatment (e.g. sample cooling and purification). Recently nanoscale NMR with shallow NV centers was realized, with spectral linewidths limited by the NV dephasing () time Staudacher et al. (2013); Mamin et al. (2013); Müller et al. (2014). Dynamical decoupling protocols were implemented to extend the NV dephasing time, resulting in a commensurate increase in sensitivity and spectral resolution. Dynamic decoupling alters the phase evolution of the sensing qubit such that the effect of unwanted noise is removed, whilst retaining sensitivity to signals at a particular frequency. Pulsed decoupling techniques (e.g. XY-N, CPMG-N) operate by filtering signals at harmonics of the pulsing period whereas continuous decoupling (e.g. spin-locking, Hartmann-Hahn polarization transfer) tune the driving frequency of the qubit [Fig. 1(a)]. Limitations in driving strength and fidelity however, reduce the effectiveness of decoupling, and provide imperfect filtering. For example spectral noise faster than the decoupling speed is not removed, leading to proposals based on quantum error correction Arrad et al. (2014); Kessler et al. (2014). For NV sensing this problem is particularly salient, as poor scaling of dephasing time with number of applied pulses has been observed for shallow NV centers Romach et al. (2015); Myers et al. (2014). As a result spectral resolution on the order of 10 – 100 kHz remains the benchmark, which is more than an order of magnitude worse than the intrinsic NV relaxation () time.
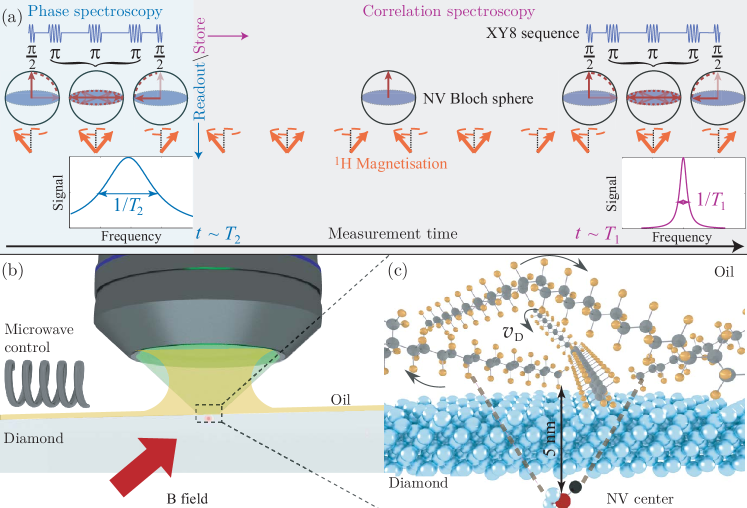
An alternative avenue towards high resolution spectroscopy is to transfer the signal encoded in the NV phase to spin population and then rely upon the long time of the NV center. The idea of extending resolution to timescales limited solely by spin lattice relaxation is closely related to stimulated echo techniques Mims (1972) and was recently demonstrated for coherently coupled spins in diamond Laraoui et al. (2011, 2013). Although this approach does not enhance the sensitivity of the NV center which relies upon coherent phase accumulation, spectral resolution can, in principle, be extended to the limit [Fig. 1(a)]. During the first “preparation” sequence consisting of a multipulse (e.g. XY8) echo, the magnetisation of precessing nuclear spins is mapped onto the NV electronic spin population. After an evolution time , during which the phase of the nuclear magnetisation progresses, the subsequent nuclear phase is then correlated with the initial phase by a second “read” echo sequence which again maps to the NV spin population Sup . The resultant signal is a modulation at the frequency of nuclear precession.
A schematic of the measurement is shown in Fig. 1(b). We use shallow NV centers implanted 2–5 nm into a diamond surface by 2.5 keV N+ implantation. The diamond is 99.999% 12C isotopically enriched, with 10 part per billion impurity content so that the NV spectral environment is dominated by magnetic species at the surface or outside of the diamond Romach et al. (2015). A 400 Gauss magnetic field was applied along the NV axis ( diamond crystal axis), resulting in a proton Larmor frequency of 1.7 MHz (1H gyromagnetic ratio, kHz/Gauss, note the use of real frequency, not angular frequency values). The NMR spectrum of statistically polarized protons in an oil layer placed on the diamond surface was then measured with an XY8 sequence Staudacher et al. (2013). A peak in the spectrum corresponding with the 1H Larmor frequency records the root-mean squared magnetic field amplitude of the protons, as seen by the NV center [Fig. 2(a)]. From the amplitude of the nuclear spin signal Sup , we calculate the NV distance to the diamond surface as nm, with a detection volume of (5 nm)3 [Fig. 1(c)].
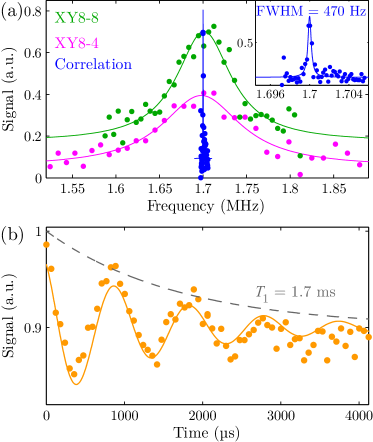
The resolution of the spectra shown in Fig. 2(a) is initially determined by the NV dephasing time. For an XY8-4 sequence consisting of 32 decoupling pulses, the measurement filter function has a linewidth of 110 kHz due to the s NV time. By increasing the number of decoupling pulses the NV time could be increased, leading to a narrower NMR signal with 74 kHz linewidth [Fig. 2(a)]. However the resolution of these initial measurements remains poorer than the expected proton linewidth (typically in the tens of kilohertz range for solid-state NMR and less for liquid-state NMR), meaning little information about chemical structure or sample relaxation rates can be obtained. We therefore performed correlation spectroscopy out to millisecond timescales, allowing a significant improvement in spectral resolution.
As a demonstration of the technique we measured an effective delta frequency signal from a high-stability signal generator. An XY8 sequence followed by a variable time delay and a second XY8 sequence resulted in oscillations of the NV population at the signal generator frequency Sup . In order to detect the correlation oscillations over long evolution times, whilst limiting the number of datapoints required, we applied an under-sampling protocol which recorded the envelope of the correlation signal. The sampling rate was chosen to be 17 kHz (i.e. a sample every 58.859 s) between and , with MHz, MHz and to fulfil the Nyquist criterion Oppenheim and Schafer . The result is shown in Fig. 2(b), from which we obtained the linewidth plotted in Fig. 2(a) by Fourier transform. A resolution improvement of over two orders of magnitude to 470 40 Hz can be seen, in comparison to coherent phase sensing measurements.
To our knowledge, the spectral resolution demonstrated here is a record for magnetometry with shallow NV centers Staudacher et al. (2013); Müller et al. (2014); Romach et al. (2015); Loretz et al. (2014); Rosskopf et al. (2014); Myers et al. (2014). Not only does the resolution outperform current nanoscale NMR techniques, but it is comparable to measurements performed on protected NV centers deep inside diamond Laraoui et al. (2013); Maurer et al. (2012); Balasubramanian et al. (2009). To examine whether the linewidth is indeed limited by spin lifetime, we independently measured the time of the NV center. We find the decay of 1.7 ms closely matches the damping of the correlation signal [Fig. 2(b)]. The good agreement between decay and the measured linewidth indicates that it is the timescale which information is stored in the NV spin population rather than drifts in the external magnetic field or experimental setup, that limit the resolution of these measurements.
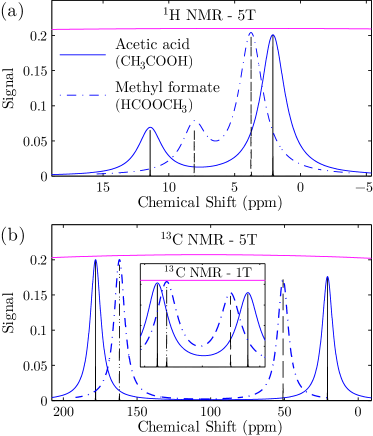
NMR spectroscopy with few hundred hertz resolution is capable of identifying molecular structure in moderate magnetic fields based on chemical shifts. In Fig. 3 we show the simulated 1H and 13C NMR spectra for acetic acid and methyl formate with 470 Hz resolution, where we have neglected any intrinsic sample relaxation and diffusion. The two molecules have identical chemical makeup, differing only in structure, meaning they cannot be distinguished by techniques sensitive to proton/carbon ratio. We show in 5 Tesla magnetic fields, the chemical shift arising from different functional groups can be resolved, which allows for unambiguous identification by comparison to NMR databases NMR . By comparison, coherent phase spectroscopy is unable to yield any structural resolution due to the poorer linewidth [Fig. 3 (magenta)]. The higher chemical shift experienced by carbon atoms mean that chemical shifts can be resolved in magnetic fields of 1 Tesla, making 13C NMR a more attractive option for NV based spectroscopy [Fig. 3 (b, inset)].
Acetic acid and methyl formate were chosen as they contain carboxylic acid and ester functional groups which are present at the diamond surface. Such groups are targets for diamond functionalisation and expected to play a role in the charge state and decoherence of shallow NV centers. We note that the realisation of chemical shift spectroscopy is predicated on the ability to both readout the NV spin state and preserve long times at high magnetic fields, both of which have been demonstrated recently Stepanov et al. (2015); Aslam et al. (2015). Additionally, the intrinsic sample relaxation rates must be low enough to allow for high resolution spectroscopy.
In order to determine whether detection of chemical shifts is indeed readily achievable, and to investigate relaxation mechanisms at the diamond surface we performed correlation spectroscopy of protons at the diamond surface with another NV center of similar depth. Fig. 4 (a) shows the signal measured to 27 s, with characteristic oscillations at the 1H Larmor frequency. Again, we applied an under-sampling protocol to record the envelope of the correlation signal. The sampling rate was chosen to be 0.81 MHz between and , with MHz, MHz and . Oscillations continue beyond 100 s, which although longer than could be investigated with XY8 decoupling, is much shorter than the time of this NV center [Fig. 4 (b)]. From the Fourier transform of the signal we determine the proton linewidth to be 20 kHz, which is now no longer limited by the NV dephasing time [Fig. 4 (c)].
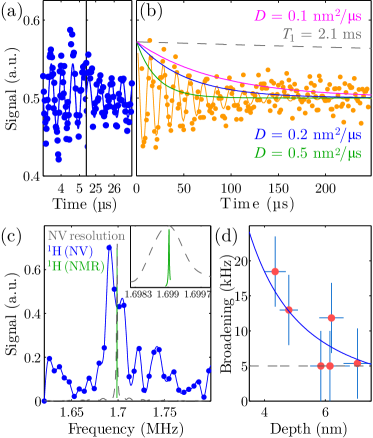
Interestingly the NV measured proton spectrum is significantly broader than the Hz width spectrum measured by conventional NMR [Fig. 4 (c)] (see Sup for details). In nanoscale NMR, molecules can leave the detection volume by molecular diffusion which reduces interaction time with the sensor and results in a broadened linewidth. In contrast, molecular diffusion in conventional NMR leads to narrower linewidths through motional narrowing. To test whether diffusion is responsible for the linewidth broadening, we measured the proton linewidth with six NV centers at different depths using XY8 spectroscopy and recorded broadening (beyond the measurement resolution) as a function of sensor depth [Fig. 4 (d)]. Despite the lower resolution associated with using XY8 spectroscopy, we observe a clear increase in spectral linewidth as the NV depth reduces, which is fitted by a pure diffusion model (, where is broadening) to give a diffusion constant, nms. We note that our model does not take into account nuclear-nuclear interactions, interactions with spins at the diamond surface, or a static boundary layer of non-diffusing liquid which would be expected to give a different depth scaling.
To validate the diffusional model we numerically simulated the magnetic field produced by diffusing protons at the diamond surface. We used a cluster correlation expansion to determine the magnetic field produced by 3000 randomly moving nuclear spin pairs, with their motion calculated in 0.1 s timesteps Sup . As shown in Fig. 4 (b), a diffusion coefficient of nms, gives a best fit to the experimental results. Calculation based on pure diffusion, , where is the mean squared displacement, reproduces this value well for diffusion through a (5 nm)3 sensing volume, with a decay timescale of 65 s, in agreement with Fig. 4 (b).
In summary, we have demonstrated that correlation spectroscopy can be applied to nanoscale NMR for improving the spectral resolution of diamond magnetometry beyond values limited by the coherence time of electron spins. The protocol is limited by the longitudinal relaxation time of the NV spin (several milliseconds at room temperature) leading to sub-kilohertz resolution, and in principle, allowing chemical shifts to be observed in high magnetic field experiments. Importantly, by storing information in spin population, susceptibility to low frequency noise is reduced, which has been shown to be dominant at the diamond surface Romach et al. (2015); Myers et al. (2014); Rosskopf et al. (2014). In contrast to related relaxation spectroscopy techniques Steinert et al. (2013); Kaufmann et al. (2013), the linewidth does not depend on the NV time.
We have also shown how molecular motion at the diamond surface affects the recorded spectrum, which can be used to determine molecular diffusion rates. In addition we highlight the importance of chemical attachment in order to achieve high resolution spectra. Improvements in stabilisation of molecules to the diamond surface, coupled with correlation spectroscopy at high fields, promise to yield information on molecular structure, morphology and dynamics at the single molecule level.
References
- Degen et al. (2009) C. L. Degen, M. Poggio, H. J. Mamin, C. T. Rettner, and D. Rugar, Proceedings of the National Academy of Sciences 106, 1313 (2009).
- Staudacher et al. (2013) T. Staudacher, F. Shi, S. Pezzagna, J. Meijer, J. Du, C. A. Meriles, F. Reinhard, and J. Wrachtrup, Science 339, 561 (2013).
- Mamin et al. (2013) H. J. Mamin, M. Kim, M. H. Sherwood, C. T. Rettner, K. Ohno, D. D. Awschalom, and D. Rugar, Science 339, 557 (2013).
- Müller et al. (2014) C. Müller, X. Kong, J. M. Cai, K. Melentijević, A. Stacey, M. Markham, D. Twitchen, J. Isoya, S. Pezzagna, J. Meijer, J. F. Du, M. B. Plenio, B. Naydenov, L. P. McGuinness, and F. Jelezko, Nature Communications 5 (2014), 10.1038/ncomms5703.
- Sushkov et al. (2014) A. O. Sushkov, I. Lovchinsky, N. Chisholm, R. L. Walsworth, H. Park, and M. D. Lukin, Physical Review Letters 113, 197601 (2014).
- Grinolds et al. (2014) M. S. Grinolds, M. Warner, K. D. Greve, Y. Dovzhenko, L. Thiel, R. L. Walsworth, S. Hong, P. Maletinsky, and A. Yacoby, Nature Nanotechnology 9, 279 (2014), 10.1038/nnano.2014.30.
- Balasubramanian et al. (2008) G. Balasubramanian, I. Y. Chan, R. Kolesov, M. Al-Hmoud, J. Tisler, C. Shin, C. Kim, A. Wojcik, P. R. Hemmer, A. Krueger, T. Hanke, A. Leitenstorfer, R. Bratschitsch, F. Jelezko, and J. Wrachtrup, Nature 455, 648 (2008).
- Rondin et al. (2012) L. Rondin, J.-P. Tetienne, P. Spinicelli, C. Dal Savio, K. Karrai, G. Dantelle, A. Thiaville, S. Rohart, J.-F. Roch, and V. Jacques, Applied Physics Letters 100, 153118 (2012).
- Zhao et al. (2012) N. Zhao, J. Honert, B. Schmid, M. Klas, J. Isoya, M. Markham, D. Twitchen, F. Jelezko, R.-B. Liu, H. Fedder, and J. Wrachtrup, Nat Nano 7, 657 (2012), 10.1038/nnano.2012.152.
- Taminiau et al. (2012) T. H. Taminiau, J. J. T. Wagenaar, T. van der Sar, F. Jelezko, V. V. Dobrovitski, and R. Hanson, Physical Review Letters 109, 137602 (2012).
- Kolkowitz et al. (2012) S. Kolkowitz, Q. P. Unterreithmeier, S. D. Bennett, and M. D. Lukin, Physical Review Letters 109, 137601 (2012).
- McGuinness et al. (2013) L. P. McGuinness, L. T. Hall, A. Stacey, D. A. Simpson, C. D. Hill, J. H. Cole, K. Ganesan, B. C. Gibson, S. Prawer, P. Mulvaney, F. Jelezko, J. Wrachtrup, R. E. Scholten, and L. C. L. Hollenberg, New Journal of Physics 15, 073042 (2013).
- Steinert et al. (2013) S. Steinert, F. Ziem, L. Hall, A. Zappe, M. Schweikert, N. Götz, A. Aird, G. Balasubramanian, L. Hollenberg, and J. Wrachtrup, Nature communications 4, 1607 (2013).
- Taylor et al. (2008) J. M. Taylor, P. Cappellaro, L. Childress, L. Jiang, D. Budker, P. R. Hemmer, A. Yacoby, R. Walsworth, and M. D. Lukin, Nature Physics 4, 810 (2008).
- Arrad et al. (2014) G. Arrad, Y. Vinkler, D. Aharonov, and A. Retzker, Physical Review Letters 112, 150801 (2014).
- Kessler et al. (2014) E. M. Kessler, I. Lovchinsky, A. O. Sushkov, and M. D. Lukin, Physical Review Letters 112, 150802 (2014).
- Romach et al. (2015) Y. Romach, C. Müller, T. Unden, L. J. Rogers, T. Isoda, K. M. Itoh, M. Markham, A. Stacey, J. Meijer, S. Pezzagna, B. Naydenov, L. P. McGuinness, N. Bar-Gill, and F. Jelezko, Physical Review Letters 114, 017601 (2015).
- Myers et al. (2014) B. A. Myers, A. Das, M. C. Dartiailh, K. Ohno, D. D. Awschalom, and A. C. Bleszynski Jayich, Physical Review Letters 113, 027602 (2014).
- Mims (1972) W. B. Mims, Physical Review B 5, 2409 (1972), pRB.
- Laraoui et al. (2011) A. Laraoui, J. S. Hodges, C. A. Ryan, and C. A. Meriles, Physical Review B 84, 104301 (2011).
- Laraoui et al. (2013) A. Laraoui, F. Dolde, C. Burk, F. Reinhard, J. Wrachtrup, and C. A. Meriles, Nature communications 4, 1651 (2013).
- (22) See Supplemental Material at [URL will be inserted by publisher].
- (23) A. V. Oppenheim and R. W. Schafer, Englewood Cliffs, New York .
- Loretz et al. (2014) M. Loretz, S. Pezzagna, J. Meijer, and C. Degen, Applied Physics Letters 104, 033102 (2014).
- Rosskopf et al. (2014) T. Rosskopf, A. Dussaux, K. Ohashi, M. Loretz, R. Schirhagl, H. Watanabe, S. Shikata, K. M. Itoh, and C. L. Degen, Physical Review Letters 112, 147602 (2014).
- Maurer et al. (2012) P. C. Maurer, G. Kucsko, C. Latta, L. Jiang, N. Y. Yao, S. D. Bennett, F. Pastawski, D. Hunger, N. Chisholm, M. Markham, D. J. Twitchen, J. I. Cirac, and M. D. Lukin, Science 336, 1283 (2012).
- Balasubramanian et al. (2009) G. Balasubramanian, P. Neumann, D. Twitchen, M. Markham, R. Kolesov, N. Mizuochi, J. Isoya, J. Achard, J. Beck, J. Tissler, V. Jacques, P. R. Hemmer, F. Jelezko, and J. Wrachtrup, Nature Materials 8, 383 (2009).
- (28) “See for example spectral database for organic compounds sdbs,” .
- Stepanov et al. (2015) V. Stepanov, F. H. Cho, C. Abeywardana, and S. Takahashi, Applied Physics Letters 106, 063111 (2015).
- Aslam et al. (2015) N. Aslam, M. Pfender, R. Stöhr, P. Neumann, M. Scheffler, H. Sumiya, H. Abe, S. Onoda, T. Ohshima, and J. Isoya, arXiv preprint arXiv:1503.04134 (2015).
- Kaufmann et al. (2013) S. Kaufmann, D. A. Simpson, L. T. Hall, V. Perunicic, P. Senn, S. Steinert, L. P. McGuinness, B. C. Johnson, T. Ohshima, F. Caruso, J. Wrachtrup, R. E. Scholten, P. Mulvaney, and L. Hollenberg, Proceedings of the National Academy of Sciences 110, 10894 (2013).