Discovery of a Spin-Down State Change in the LMC Pulsar B0540-69
Abstract
We report the discovery of a large, sudden, and persistent increase in the spin-down rate of B0540-69, a young pulsar in the Large Magellanic Cloud, using observations from the Swift and RXTE satellites. The relative increase in the spin-down rate of is unprecedented for B0540-69. No accompanying change in the spin rate is seen, and no change is seen in the pulsed X-ray emission from B0540-69 following the change in the spin-down rate. Such large relative changes in the spin-down rate are seen in the recently discovered class of “intermittent pulsars”, and we compare the properties of B0540-69 to such pulsars. We consider possible changes in the magnetosphere of the pulsar that could cause such a large change in the spin-down rate.
Subject headings:
pulsars: individual (PSR B0540-69)1. Introduction
B0540-69 is a young, rotationally powered pulsar in the Large Magellanic Cloud (LMC) that is similar to the Crab pulsar in many ways. With a rotation frequency of almost 20 Hz, it is one of the most rapidly rotating young pulsars known. Its spin-down luminosity () of erg , where is the moment of inertia of the neutron star (NS) in units of g , is also among the largest for all pulsars. The spin-down rate of a pulsar is often described in terms of a braking index , in which . The slowdown of B0540-69 is relatively stable for a young pulsar, and it is one of only 8 young pulsars for which a braking index has been reliably measured (Lyne et al. 2015). It has a characteristic spin-down age () of years.
Pulsars are remarkably stable rotators, and the deviations from clocklike precision can provide information about the structure and processes at work in the neutron star and its magnetosphere. Sudden changes in and (“glitches”) are occasionally seen in pulsars, especially those with ages between and years (Yu et al. 2013). Glitches are thought to occur in rotationally powered pulsars when angular momentum is transferred from a more rapidly rotating component of the NS to the outer crust (e.g., Anderson & Itoh 1975; Franco et al. 2000). A different kind of rapid change is seen in some pulsars that affects the spin-down rate. In their examination of long-term monitoring of 366 pulsars, Lyne et al. (2010) found that many pulsars rapidly switch between two different spin-down rates. The time scales for the transitions are quasi-periodic, with typical time scales of years. “Intermittent pulsars” are extreme examples of such pulsars. They transition from a radio-on state to radio-off state with a simultaneous change in the spin-down rate. The best studied example is PSR B1931+24 (Kramer et al. 2006; Young et al. 2013) for which multiple transitions on a timescale of weeks from a radio bright state with Hz s-1 and a radio quiet state with Hz s-1 have been observed. Similar behavior on longer time scales has been reported for PSR J1832+0029 (Lorimer et al. 2012) and PSR J1841-0500 (Camilo et al. 2012). All three pulsars show rapid transitions between two states with stable spin-down rates, large differences in the spin-down rates, large changes in the radio flux, and no simultaneous change in . Unlike most explanations for glitches, models for these state changes have emphasized changes in the pulsar’s magnetosphere (e.g., Li et al. 2012). None of the intermittent pulsars have been detected in the optical, X-ray, or gamma-ray bands, but somewhat similar behavior has been seen for the gamma-ray pulsar PSR J2021+4026 (Allafort et al. 2013). A 4% increase in was seen with a simultaneous decrease of 18% in the flux above 100 MeV with a time scale for the transition of less than a week. Since there is no radio counterpart, any change in radio flux is not known.
B0540-69 has been extensively studied since its discovery with the Einstein Observatory (Seward et al. 1984). A small glitch for B0540-69 was reported by Zhang et al. (2001) with a relative change in of and of . The reality of this glitch was disputed by Cusumano et al. (2003) and later supported by Livingstone et al. (2005). Ferdman et al. (2015) examined 15.8 years of data from RXTE and report a second glitch with a relative change in of and of . Both these changes in are orders of magnitude smaller than we report in this paper. No other glitches have been reported in the extensive monitoring of the pulsar. Optical pulsations are also seen (Mignani et al. 2010 and references therein). Manchester et al. (1993) discovered radio pulsations with an above average luminosity at 640 MHz of 1200 mJy kpc2.
In this paper we present and discuss new timing analysis of B0540-69 as observed with RXTE and Swift. Details of the observations and the results of the temporal analysis are reported in Section 2, and interpretations are given in Section 3. Finally, Section 4 is a summary.
2. Observations and Data Reduction
B0540-69 was observed with the Proportional Counter Array (PCA) on board the Rossi X-ray Timing Explorer (RXTE) (Bradt et al. 1993) during a 12.5-year campaign to monitor the nearby PSR J0537-6910. The final observation was on Dec. 31, 2011. We concentrate on observations covering the final 140 days of the campaign. Results from RXTE observations have been reported by Zhang et al. (2001), Livingstone et al. (2005) and Ferdman et al. (2015). The PCA is composed of five co-aligned xenon detectors (Proportional Counter Units (PCUs)) with a total area of cm2. Individual PCUs were routinely turned off and on to reduce the number of high-voltage breakdowns. Additional observations were made with the X-Ray Telescope (XRT) instrument (Burrows et al. 2005) on the Swift Gamma-Ray Burst Explorer (Gehrels et al. 2004) starting in Feb., 2015. Table 1 is a log of the observations.
Data reduction for both missions followed very similar procedures. X-ray events were screened to maximize the signal-to-noise ratio, and then photon arrival times were corrected to the solar system barycenter with the FTOOL111http://heasarc.gsfc.nasa.gov/docs/software/lheasoft/ faxbary for RXTE and barycorr for Swift using the Hubble Space Telescope position of , (J2000.0) (Mignani et al. 2010). The mid-point of each observation was chosen as the epoch, and then the best period was determined by comparing multiple folded light curves using efsearch. Since the folded light curve is approximately a sine wave (Cusumano et al. 2003), the phase at the epoch was determined by fitting a sine wave to the folded light curve produced with efold and using the phase of the peak of the sine wave. The resulting frequencies and phases were fit to the usual truncated Taylor series expansion of the phase and its time derivatives , , and .
Uncertainties quoted in this paper are given at the 90% confidence level unless otherwise noted. For multi-parameter fits, the other parameters are allowed to vary when calculating the limits.
2.1. RXTE/PCA Observations
The PCA is sensitive to X-rays in the 2 to 60 keV band with moderate () resolution. Each event is time-tagged on the spacecraft with an accuracy better than s (Rots et al. 1998). To improve the signal-to-noise ratio, only events in the first xenon layer in the energy range of keV were included.
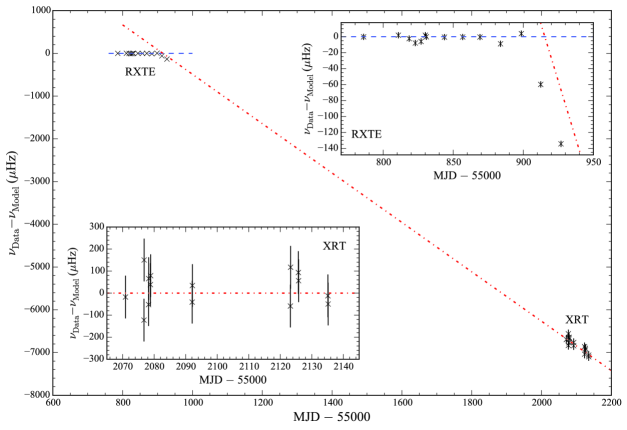
Figure 1 shows the frequency residuals for the last 14 RXTE observations relative to the best-fit ephemeris model for the first 12 of the observations. The value of is set to , the best-fit value for observations between Oct. 2010 and Dec. 2011. The model, whose parameters are given in Table 2, provides a very good fit to the first 12 observations with rms phase residuals of 1%, but the final two observations deviate dramatically. A linear fit to the frequencies for the final two observations indicates that has changed by Hz s-1 with a statistical uncertainty of Hz s-1 at some time between the observations on Dec. 3 and Dec. 17. This is an increase of in the rate at which the pulsar’s spin is slowing. This value is consistent with, but less accurate than, the value determined in Section 2.2 using both Swift and RXTE data. We note that our value for is lower than the values reported by Ferdman et al. (2015) for longer intervals of RXTE data. Reprocessing the RXTE data using the Ferdman et al. values for demonstrates that revising would have a negligible effect on our results and would not change our conclusions.
If the sudden change in were due to a glitch, then a simultaneous change in would be expected. Surveys of glitches in other pulsars find that the amplitude of a glitch in correlates with the amplitude of the glitch in for pulsars in general (Espinoza et al. 2011) and for the Crab Pulsar in particular (Lyne et al. 2015). The correlation for pulsars in general would indicate an accompanying glitch in B0540-69 larger than Hz, and the correlation for the Crab would indicate an accompanying glitch of Hz. There is no indication of an accompanying change in , and we place limits on its possible size by assuming an instantaneous glitch with no recovery and extrapolating the fit to the post-glitch frequencies back toward the final pre-glitch observation. With these assumptions the largest glitch would occur immediately after the final pre-glitch observation with a size of Hz. Later glitches would be smaller until at 200 ks after final pre-glitch observation there would be no glitch in .
Large glitches in typically decay away on time scales from about a day to weeks. Since the new value for is consistent with that later seen with Swift (Section 2.2), there is also no indication of such a recovery. We conclude that the sudden change in is almost certainly a state transition rather than a glitch. We will refer to the state before the transition as the “low spin-down” state and the state after the transition as the “high spin-down” state. There is also no indication of a change in the pulsed X-ray emission from B0540-69. Figure 2 shows the average pulsed count rate (, where A is the relative sine wave amplitude, C is the total number of counts detected, is the exposure time, and is the average number of PCUs that were on during the observation). The average pulsed count rate for the two observations after the transition () is consistent with the average for the first 12 observations (). Further the folded light curves for these two observations show no significant change.
To confirm the continued nominal performance of the PCA including the final two observations, we processed the same observations for PSR J0537-6910 following the procedures given in Marshall et al. (2004). After the glitch near MJD 55815, the final 12 observations are very well fit using the standard form for the ephemeris with an rms phase residual of . We conclude that the unexpected values of for B0540-69 are not due to any instrumental effect.
2.2. Swift XRT Observations
The X-ray Telescope started observations of B0540-69 on Feb. 17, 2015, as part of a Target of Opportunity campaign. The XRT is a focusing X-ray telescope with a CCD detector with an effective bandpass of 0.3 - 10 keV. All observations were made using the Window Timing (WT) mode in which the central 200 CCD columns are continously read out, providing a time resolution of 1.7 ms. The XRT data were reduced with the standard software (xrtpipeline v0.13.1) applying the default filtering and screening criteria (HEASoft 6.16), using the 20140709 update to the XRT CALDB files and the 20150428 update to the clock correction file. The phase and frequency were measured for each continuous viewing interval (a “snapshot”). Each of the Swift entries in Table 1 except the first consists of two snapshots separated by about 96 minutes (the duration of a Swift orbit). The first entry has a single snapshot. We obtained the best ephemeris by determining a model for the closely spaced observations and then refining the model as more widely separated observations were added. All the models assumed a value of for based on measurements with RXTE before the state transition in 2011. This parameter makes a very small contribution to the model because the duration of the current Swift campaign is only 65 days. The best-fit model was confirmed using a large grid search of possible combinations of and . The parameters of the best-fit model and the 90% confidence uncertainties are given in Table 2. The model provides a good fit to the data with rms phase residuals of 3%. Figure 1, which shows the frequency residuals relative to the RXTE ephemeris before the transition, displays the overall history of .
We used two methods to determine after the state transition. The first method uses the best-fit model for the XRT data (Table 2) with a value of at the XRT epoch. After adjusting by to account for the effect of , this is a change in from the value before the transition (Table 2) of .
The second method compares the average value of in the final two RXTE observations ( Hz Hz at MJD 55919.71) with the best-fit value for the XRT data of Hz Hz. The resulting is s-2 at MJD 56498.62. After adjusting by to account for the effect of , the result is s-2 at the XRT epoch, which is larger than result from the first method by s-2. This discrepancy is shown in Figure 1 in which the extrapolation of the XRT ephemeris back to the final two RXTE observations predicts a value for that is larger than that observed. The uncertainty of the extrapolated values due to the uncertainty in the model’s is only Hz. The discrepancy suggests that the evolution of the high spin-down state is more complicated than our simple model. The second method indicates a change in from the value before the transition of .
Since the value of after the state transition is uncertain and the statistical uncertainties are small, we use the value of the adjustments due to to estimate the uncertainty. The relative change in is then and for the first and second methods respectively. We adopt , the average of the two methods with an uncertainty that encompasses the individual error bars, as our best estimate of the relative change in .
The folded light curve is similar to that reported from other X-ray observations (e.g., Cusumano et al. 2003). Although the actual light curve is more complicated, a model of a constant plus a Gaussian provides a good description of the XRT data. The best-fit standard deviation for the Gaussian is , which is consistent with a fit to the folded light curve for the RXTE data before the state transition.
3. Discussion
B0540-69 has been extensively monitored by numerous observatories in the more than 30 years since its discovery including Ginga observations spanning 4.4 years (Deeter et al. 1999) and the 12.5 years of observations with RXTE. More than 10 measurements of the braking index for the pulsar, which require long spans of data, have been reported (Cusumano et al. 2003, who list previous measurements; Ferdman et al. 2015). Values for the braking index range from 1.81 (Zhang et al. 2001) to 2.74 (Ögelman & Hasinger 1990).
None of these studies found a sudden change in comparable to the one reported here. The glitches in reported by Zhang et al. (2001) and Ferdman et al. (2015) are 2000 times smaller, and knowledge of the pulsar’s phase is maintained throughout the 12.5 years of RXTE monitoring until the final two observations. When discovered with the Einstein Observatory (Seward et al. 1984), B0540-69 had a of Hz s-1, which indicates that the pulsar was in the low spin-down state in 1979 and 1980. The lack of published values of indicative of the high spin-down state suggests that B0540-69 remained in the low spin-down state the vast majority of the time, if not all the time, until the transition in late 2011.
The sudden change in the spin-down rate is most likely associated with a change in the magnetosphere of the NS. One possibility is a global change in the conductivity of the magnetosphere. Li et al. (2012) developed solutions for pulsar magnetospheres with finite resistivity that mitigate some of the limitations of the vacuum and force-free models. The dependence of the spin-down luminosity was calculated for a wide range of the conductivity parameter (expressed in terms of the pulsar angular rotation rate ) and inclination angle using a three-dimensional numerical code. For broad ranges of (0∘ to 90 and the conductivity ( from 0.04 to 4.0), a 36% increase in the luminosity (and by extension in ) can be achieved with an increase in of less than a factor of 6. There are maximum values of , ranging from 40 at to 1.3 at above which it is no longer possible to explain an increase in the luminosity with an increase in . Since for large values of , the component of the electric field parallel to the magnetic field (Kalapotharakos et al. 2014), an increase in may reduce the gamma-ray flux from the pulsar. The long-term light curve of B0540-69 in the energy range of 200 MeV to 100 GeV (Fermi-LAT Collaboration 2015) shows no indication of change in the gamma-ray flux with an upper limit of 30%. Detailed modelling, such as that done by Brambilla et al. (2015) for other Fermi pulsars, is needed to understand the implication of this constraint on parameters for B0540-69, but this is beyond the scope of this paper.
Another possible explanation for the spin-down transition is a change in torque due to a change in the plasma outflow from the polar caps. Kramer et al. (2006) suggested this to explain the state transitions in the intermittent pulsar PSR B1931+24. Unlike PSR B1931+24, B0540-69 appears to be radio bright in its low spin-down state, but its radio flux may significantly increase or its pulse shape may change in the high spin-down state. Following Young et al. we estimate the change in the charge density as C m-3, assuming a pulsar radius of 10 km and I45 of . This estimate of 0.78 C m-3 is close to the Goldreich-Julian charge density for B0540-69 of 1.09 C m-3. An increase in predicts an increase in the radio flux, which can be tested with radio observations of the high spin-down state. It also predicts a reduction in the braking index as the relative importance of magnetic dipole radiation decreases.
A change in the amount of open poloidal magnetic flux would also change the spin-down luminosity, which is expected to be proportional to where is the radius beyond which the magnetic field lines become open (Contopoulos 2007). An 36% increase in the spin-down luminosity with no change in would require a 15% decrease in .
4. Summary
The spin-down rate of B0540-69 increased suddenly by 36% (a change in of Hz s-1) between Dec. 3 and Dec. 17, 2011. Observations with Swift in 2015 show that this change in spin-down rate has persisted for more than 3 years. Such a large persistent change in the spin-down rate has never been reported for B0540-69. There is no indication of a simultaneous change in the pulse shape in X-rays, the pulsed X-ray luminosity, or the total gamma-ray luminosity. We interpret this change as a transition between two stable states of the pulsar, similar to state transitions in other pulsars. B0540-69 extends the class of state changing pulsars to include a very young and luminous example. The transitions in B0540-69 appear to be rare with the low spin-down state probably lasting more than 30 years. Future work can test predicted changes in the radio flux and the braking index in the high spin-down state.
We gratefully acknowledge the anonymous referee for suggestions that improved the paper. This work made use of data supplied by the UK Swift Science Data Centre at the University of Leicester and the High Energy Astrophysics Science Archive Research Center, provided by NASA’s Goddard Space Flight Center.
References
- Allafort et al. (2013) Allafort, A., et al. 2013, ApJ, 777, L2
- Anderson et al. (1975) Anderson, P. W., & Itoh, N. 1975, Nature, 256, 25
- Bradt et al. (1993) Bradt, H. V., Rothschild, R. E., & Swank, J. H. 1993, A&AS, 97, 355
- Brambilla et al. (2015) Brambilla, G., et al. 2015, ApJ, 804, 84
- Burrows et al. (2005) Burrows, D. N., et al. 2005, Space Science Reviews, 120, 165
- Camilo et al. (2012) Camilo, F., et al. 2012, ApJ, 746, 63
- Contopoulos (2007) Contopoulos, I., 2007, A&A, 466, 301
- Cusumano et al. (2003) Cusumano, G., et al. 2003, A&A, 402, 647
- Deeter et al. (1999) Deeter, J. E., Nagase, F. & Boynton, P. E. 1999, ApJ, 512, 300
- Espinoza et al. (2011) Espinoza, C. M., et al. 2011, MNRAS, 414, 1679
- Ferdman et al. (2015) Ferdman, R. D., et al. 2015, ApJ, submitted
- Fermi-LAT Collaboration (2015) Fermi-LAT Collaboration, 2015, in prep.
- Franco et al. (2000) Franco, L., Link, B., & Epstein, R. I. 2000, ApJ, 543, 987
- Gehrels et al. (2004) Gehrels, N., et al. 2004, ApJ, 611, 1005
- Kalapotharakos et al. (2014) Kalapotharakos, C., Harding, A. & Kazanas, D. 2014, ApJ, 793, 97
- Kramer et al. (2006) Kramer, M., et al. 2006, Science, 312, 549
- Li et al. (2012) Li, J., Spitkovsky, A. & Tchekhovskoy, A. 2012, ApJ, 746, 60
- Link et al. (1997) Link, B., & Epstein, R. 1997, ApJ, 478, L91
- Livingstone et al. (2005) Livingstone, M. A., et al. 2005, ApJ, 633, 1100
- Lorimer et al. (2012) Lorimer, D. R., et al. 2012, ApJ, 758, 141
- Lyne et al. (2010) Lyne, A. G. et al. 2010, Science, 329, 408
- Lyne et al. (2015) Lyne, A. G. et al. 2015, MNRAS, 446, 857
- Manchester et al. (1993) Manchester, R. N., et al. 1993, ApJ, 403, L29
- Marshall et al. (2004) Marshall, F. E., et al. 2004, ApJ, 603, 682
- Mignani et al. (2010) Mignani, R. P., et al. 2010, A&A, 515, 110
- Ogelman et al. (1990) Ögelman, H. & Hasinger, G. 1990, ApJ, 353, L21
- Rots et al. (1998) Rots, A. H., et al. 1998, ApJ, 501, 749
- Seward et al. (1984) Seward, F. D., Harnden, F. R. & Helfand, D. J. 1984, ApJ, 287, L19
- Young et al. (2013) Young, N. J., et al. 2013, MNRAS, 429, 2569
- Yu et al. (2013) Yu, M., et al. 2013, MNRAS, 429, 688
- Zhang et al. (2001) Zhang, W., et al. 2001, ApJ, 554, L177
| Satellite | Obs. ID | Date | MJD | |
|---|---|---|---|---|
| (1) | (1) | (2) | ||
| RXTE | 96023-01-17 | 2011 Aug 13 | ||
| RXTE | 96023-01-42 | 2011 Sep 06 | ||
| RXTE | 96023-01-43 | 2011 Sep 14 | ||
| RXTE | 96023-01-44 | 2011 Sep 18 | ||
| RXTE | 96023-01-20 | 2011 Sep 23 | ||
| RXTE | 96023-01-45 | 2011 Sep 26 | ||
| RXTE | 96023-01-46 | 2011 Sep 26 | ||
| RXTE | 96023-01-21 | 2011 Oct 09 | ||
| RXTE | 96023-01-22 | 2011 Oct 22 | ||
| RXTE | 96023-01-23 | 2011 Nov 04 | ||
| RXTE | 96023-01-24 | 2011 Nov 18 | ||
| RXTE | 96023-01-25 | 2011 Dec 03 | ||
| RXTE | 96023-01-26 | 2011 Dec 17 | ||
| RXTE | 96023-01-19 | 2011 Dec 31 | ||
| Swift | 00033603002 | 2015 Feb 17 | ||
| Swift | 00033603004 | 2015 Feb 23 | ||
| Swift | 00033603005 | 2015 Feb 25 | ||
| Swift | 00033603006 | 2015 Feb 25 | ||
| Swift | 00033603007 | 2015 Mar 11 | ||
| Swift | 00033603008 | 2015 Apr 11 | ||
| Swift | 00033603009 | 2015 Apr 13 | ||
| Swift | 00033603010 | 2015 Apr 23 |
Note. — (1) At the start of the observation; (2) Exposure time in ks
| Parameter | Pre-transition 2011 | 2015 |
|---|---|---|
| (1) | (1) | |
| Epoch (Modified Julian Date) | 55892.352587464 | 57077.537772223 |
| Phase | 0.000 (15) | 0.000 (23) |
| (Hz) | 19.72655182 (1) | 19.70077383 (4) |
| () | -1.86322 (2) | -2.52871 (8) |
| () | 3.249 (fixed) | 3.249 (fixed) |
Note. — (1) The numbers in parentheses are the 90% confidence errors quoted in the last digit.