Li et al.Ultra metal-poor stars found in LAMOST survey
and
stars:abundances — stars: Population II — early universe
High-resolution spectroscopic studies of ultra metal-poor stars found in LAMOST survey
Abstract
We report on the observations of two ultra metal-poor (UMP) stars with including one new discovery. The two stars are studied in the on-going and quite efficient project to search for extremely metal-poor (EMP) stars with LAMOST and Subaru. Detailed abundances or upper limits of abundances have been derived for 15 elements from Li to Eu based on high-resolution spectra obtained with Subaru/HDS. The abundance patterns of both UMP stars are consistent with the “normal-population” among the low-metallicity stars. Both of the two program stars show carbon-enhancement without any excess of heavy neutron-capture elements, indicating that they belong to the subclass of CEMP-no stars, as is the case of most UMP stars previously studied. The [Sr/Ba] ratios of both CEMP-no UMP stars are above , suggesting the origin of the carbon-excess is not compatible with the mass transfer from an AGB companion where the process has operated. Lithium abundance is measured in the newly discovered UMP star LAMOST J125346.09075343.1, making it the second UMP turnoff star with Li detection. The Li abundance of LAMOST J125346.09075343.1 is slightly lower than the values obtained for less metal-poor stars with similar temperature, and provides a unique data point at to support the “meltdown” of the Li Spite-plateau at extremely low metallicity. Comparison with the other two UMP and HMP (hyper metal-poor with ) turnoff stars suggests that the difference in lighter elements such as CNO and Na might cause notable difference in lithium abundances among CEMP-no stars.
1 Introduction
The atmosphere of stars with extremely low-metallicities, i.e., extremely metal-poor ([Fe/H]111, where and are the number densities of elements A and B respectively, and and refer to the star and the Sun respectively , EMP) stars, preserves detailed information of chemical compositions of the interstellar medium at the time and place that these stars were born in the early universe. These objects, and those with even lower metallicities, e.g., ultra metal-poor (, UMP) and hyper metal-poor (, HMP) stars are believed to provide a new observational window to the earliest phases of evolution of the Galaxy, the formation of the first generation of stars, and the earliest nucleosynthesis process (McWilliam et al., 1995; Norris et al., 1996; Beers & Christlieb, 2005; Frebel & Norris, 2013). Detailed analysis of the chemical composition of metal-poor stars enables us to indirectly probe the range of supernovae nucleosynthesis yields in the early Galaxy (Heger & Woosley, 2010; Nomoto et al., 2013, and references therein), and to ultimately constrain the cosmological models for the primordial nucleosynthesis as well (for details, see Bromm & Yoshida, 2011).
Recent studies using increasing number of metal-poor stars have made it clear that there exist a large fraction of stars with significant enhancements of carbon, which are usually referred to the carbon-enhanced metal-poor (CEMP) stars. The frequency of CEMP stars is suggested to increase with decreasing metallicities (Carollo et al., 2012; Spite et al., 2013; Yong et al., 2013b). Various abundance patterns of heavier elements, especially the neutron-capture elements also indicate that there are more than one subclass of CEMP stars (Beers & Christlieb, 2005): CEMP-s enriched in process elements, CEMP-rs enriched in both s- and process elements, and CEMP-no without enhancement in neutron-capture elements. Detailed analysis of the elemental abundances of CEMP stars allows us to understand the nature of their progenitor stars. Generally, patterns in CEMP-s and CEMP-rs stars are believed to originate from mass-transfer from a companion in the asymptotic giant branch (AGB) with different masses and abundances.
With larger sample of CEMP stars, statistical studies have revealed that at lower metallicities, CEMP-no is the dominant component among all the subclasses (Norris et al., 2013b; Carollo et al., 2014). However, the origin of CEMP-no subclass is not yet well understood (see Masseron et al., 2010, for a recent review). Various polluters have been suggested to explain the observed abundance pattern of the CEMP-no stars, including mass transfer from the AGB companion (Suda et al., 2004; Masseron et al., 2010), faint SNe associated with the first generations of stars (Umeda & Nomoto, 2005; Nomoto et al., 2013), or carbon-rich winds of massive rotating EMP stars(Meynet et al., 2006; Cescutti et al., 2013), etc.
The lithium abundances provide observational constraints to a number of important subjects such as on the origin of different CEMP subclasses, which have been discussed in previous works (e.g., Masseron et al., 2012; Spite et al., 2013; Hansen et al., 2014). The low abundance of Li in CEMP-s and CEMP-rs has been indicated to be mainly caused by the mass transfer from the AGB companion. However, very limited data and relevant discussions have been focused on CEMP-no stars and their origins remain uncertain.
In the past decades, the number of metal-poor stars has been tremendously increased by early wide-field spectroscopic surveys such as the HK survey (Beers et al., 1992) and Hamburg/ESO survey (HES Christlieb et al., 2008), and more recently Sloan Digital Sky Survey (York et al., 2000) including the Sloan Extension for Galactic Understanding and Exploration (SEGUE, Yanny et al., 2009; Rockosi et al., 2009). High-resolution spectroscopic follow-up observations have been performed for the metal-poor star candidates found in these survey projects, including the “First Stars” project (Cayrel et al., 2004; Bonifacio et al., 2009), the “The Most Metal-Poor Stars” (Norris et al., 2013a; Yong et al., 2013a), “Extremely Metal-Poor Stars from SDSS/SEGUE” (Aoki et al., 2013a, 2014), and other projects such as Cohen et al. (2013), Roederer et al. (2014), Jacobson et al. (2015), etc. These follow-up projects have provided with detailed chemical abundances of more than 300 EMP stars. However, only 18 stars are identified to have (e.g., Norris et al., 2007; Caffau et al., 2012; Spite et al., 2013; Masseron et al., 2012; Hansen et al., 2014; Roederer et al., 2014), including the two HMP stars, HE 13272326 (, Frebel et al. 2005; Aoki et al. 2006) and HE 01075240 (, Christlieb et al. 2002, 2004), and SMSS 03136708, the most iron-deficient star with an upper limit of (Keller et al., 2014). A remarkable feature of these UMP stars is the great diversity in the abundance pattern. The number of UMP stars studied to date is, however, quite small, and additional low-metallicity stars, especially objects with , are very important to better understand star formation, stellar evolution, and the enrichment in the earliest phases of Galactic chemical evolution.
LAMOST 222See http://www.lamost.org for more detailed information, and the progress of the LAMOST surveys. (the Large sky Area Multi-Object fiber Spectroscopic Telescope, also known as Wang-Su Reflecting Schmidt Telescope or Guoshoujing Telescope; Cui et al., 2012; Luo et al., 2012) has started the 5-year regular survey since 2011 (Zhao et al., 2012). LAMOST combines a large aperture (4 m), high spectrum acquiring rate (4000 objects at one exposure), and a 5 degree field of view, which allows us to carry out large scale spectroscopic surveys of multiple components of the Galaxy, including metal-poor stars. With the medium-resolution () spectroscopic data from LAMOST, it is possible to reliably identify metal-poor stars in the survey mode, thus evidently enhancing the searching efficiency, and provides a great opportunity to notably enlarge the database of metal-poor stars.
We started follow-up high-resolution spectroscopy using the Subaru Telescope for candidates EMP stars found in LAMOST. This paper reports on detailed abundances of two UMP stars measured in the program. The paper is organized as follows. Observations and data reduction are addressed in Section 2; abundance analysis is described in Section 3, and corresponding interpretations are described in Section 4. The major conclusions are given in Section 5.
2 Observation and measurements
2.1 Candidate selection and follow-up observation
Candidates of metal-poor stars were selected from the low-resolution spectra of the first data release of LAMOST spectroscopic survey. The wavelength coverage (– Å) and resolving power () of the LAMOST spectra (Fig. 1) allow a robust estimation of the stellar parameters including metallicities. Methods to determine the metallicity of an object and the selection of EMP candidates were similar to those made by Li et al. (2015).
Three independent methods are used to determine the metallicity based on LAMOST spectra. The first applies an updated version of the methods described by Beers et al. (1999), which obtain [Fe/H] by making use of the CaII K line index and the HP2 index of the Hδ line. The second method matches the observed line indices to the synthetic ones. Lick indices 333http://astro.wsu.edu/worthey/html/index.table.html have been calculated for the observed spectra, and compared with the synthetic line index grid to find the best match of parameters. The third method is based on a direct comparison of the normalized observed flux with the normalized synthetic spectra in the wavelength range . The minimization technique used by Lee et al. (2008) is adopted to find the best-matching parameters. Any object is regarded as an EMP candidate if it is within the temperature range , and if at least two of the three methods described above yield . The typical uncertainty of – dex for metallicities derived from low-resolution spectra is included in the candidate selection. All candidates which were automatically selected as described above were visually examined to exclude false positives such as cool white dwarfs, or spectra with reduction artifacts.
For 54 candidates of extremely metal-poor stars selected from the LAMOST sample,“snapshot” high-resolution spectra were acquired with the resolving power R36,000 and exposure times of 1020 minutes during the two-night run in May 2014 with Subaru/HDS as made by Aoki et al. (2013b). LAMOST J125346.09075343.1 and LAMOST J131331.18055212.4 are selected from the sample by a quick-look of the snap-shot spectra as candidates of ultra metal-poor stars. Spectra with higher resolving power (R60,000) and higher signal-to-noise ratio covering 40006800 Å were obtained on May 10, 2014. Exposure times for LAMOST J125346.09075343.1 and LAMOST J131331.18055212.4 are both 45 minutes. Data reduction was carried out with standard procedures using the IRAF echelle package including bias-level correction, scattered light subtraction, flat-fielding, extraction of spectra, and wavelength calibration using Th arc lines. Cosmic-ray hits were removed by the method described in Aoki et al. (2005).

Radial velocities of the sample were obtained using the IRAF procedure fxcor, and a synthetic spectrum with low-metallicity was employed as a template for cross-correlation. Equivalent widths were measured by fitting Gaussian profiles to isolated atomic absorption lines based on the line list of Aoki et al. (2013b).
| ID | R.A. | Decl. | r | Expt | S/N | vr |
|---|---|---|---|---|---|---|
| (s) | @4500 Å | (km s-1) | ||||
| LAMOST J125346.09075343.1 | 12 53 46.09 | 07 53 43.1 | 12.3 | 2700 | 165 | 780.4 |
| LAMOST J131331.18055212.4 | 13 13 31.18 | 05 52 12.4 | 14.1 | 2700 | 45 | 1140.7 |
2.2 Stellar parameters and the ultra metal-poor stars
Since there is not a uniform photometric system for all the LAMOST input catalogue, we have adopted the spectroscopic method to derive the stellar parameters of the sample. By minimizing the trend of the relationship between the derived abundances and excitation potentials of Fe I lines, the effective temperatures of the stars were determined. The empirical formula derived by Frebel et al. (2013) has been adopted to correct the usually expected systematic offsets between the spectroscopic and photometric effective temperatures. Microturbulent velocities were also determined based on analysis of Fe I lines, i.e., by forcing the iron abundances of individual lines to exhibit no dependence on the reduced equivalent widths. The sufficiently high quality of Subaru spectra allows us to detect 3 Fe II lines for each object. Therefore the surface gravity was determined by minimizing the difference between the average abundances derived from the Fe I and Fe II lines.
Among the 54 observed candidates, there are 48 objects for which we have been able to measure sufficient amount of atomic lines and to determine relatively reliable parameters. The preliminary estimation of their metallicities based on the snapshot spectra infers that there are 38 EMP stars with , including 13 with , and 2 with . The target selection of extremely metal-poor candidates from LAMOST is thus very efficient, with about 70% of the observed candidates and 80% of the targets with measured parameters proved to be truly extremely metal-poor. More details about the whole sample will be described in a separate paper, and the following context focuses on the two UMP stars (LAMOST J125346.09075343.1 and LAMOST J131331.18055212.4) which have been observed with longer exposures thus achieved higher S/N ratios.

LAMOST J131331.18055212.4 has been independently discovered to be an EMP star, HE 13100520 by HES and followed-up with UVES. After our follow-up observation with Subaru, results of abundance measurements for this objects together with three other UMP stars was published (Hansen et al., 2014). Whereas only 18 Fe I lines were used by Hansen et al. (2014) for parameter determination, we used more than 40 Fe I lines for our estimation. For the common Fe I lines, Fig. 2 compares the equivalent widths that have been adopted by us and Hansen et al. (2014). A good agreement is found between the two measurements, with a mean difference of 0.9 mÅ with mÅ.
| ID | Subaru Measurement | LAMOST measurement | ||||||
|---|---|---|---|---|---|---|---|---|
| [Fe/H] | [Fe/H] | |||||||
| (K) | (km s-1) | (K) | ||||||
| LAMOST J125346.09075343.1 | 6030135 | 3.650.16 | 4.020.06 | 1.40.12 | 6034 | 2.75 | 3.97 | |
| LAMOST J131331.18055212.4 | 475094 | 1.600.21 | 4.120.13 | 1.50.07 | 4630 | 1.32 | 4.23 | |
Note: The error associated with the stellar parameters from Subaru measurement corresponds to the internal uncertainties derived from the spectroscopic analysis.
Table 2 presents the stellar parameters of LAMOST J125346.09075343.1 and LAMOST J131331.18055212.4 which are derived from Subaru and LAMOST spectra. For LAMOST J131331.18055212.4, the derived metallicities are consistent with the value from Hansen et al. (2014), but there is a notable difference of 250 K in . To further investigate the cause of the difference, we have also checked the photometric temperature of the two objects. The color, as well as , is available for LAMOST J131331.18055212.4, while only is available for LAMOST J125346.09075343.1. Considering the calibration by Alonso et al. (1999, 2001), the derived temperatures are 6035 K for LAMOST J125346.09075343.1 (based on ) and 4880 K for LAMOST J131331.18055212.4 (based on ). Hence, for both of the two UMP stars, the spectroscopic temperature well agrees with the photometric value as well as that derived from LAMOST spectra. However, for LAMOST J131331.18055212.4, the spectroscopic temperature is notably lower than that derived by Hansen et al. (2014) through fitting the spectrophotometric observations with model atmosphere fluxes. We hence suspect that the difference may come from the different method of stellar parameter determination, which tends to be larger for cooler giants, e.g., for objects with strong molecular absorption such as the case of LAMOST J131331.18055212.4 (as can be seen from Fig. 1).
3 Abundance determination
The 1D plane-parallel, hydrostatic model atmospheres of the ATLAS NEWODF grid of Castelli & Kurucz (2003) are used for the abundance analysis, assuming a mixing-length parameter of , no convective overshooting, and local thermodynamic equilibrium. We use an updated version of the abundance analysis code MOOG (Sneden, 1973), which does not treat continuous scattering as true absorption, but as a source function which sums both absorption and scattering (Sobeck et al., 2011). The photospheric Solar abundances of Asplund et al. (2009) are adopted when calculating [X/H] and [X/Fe] abundance ratios.
3.1 Methods
The lithium and carbon abundances of the program stars were respectively derived by matching the observed Li I 6707.8 Å doublet and CH A-X band head at 4310 Å (i.e., the G-band) to the synthetic spectra.
For 14 other elements including Na, Mg, Si, Ca, Sc, Ti, Cr, Fe, Co, Ni, Zn, Sr, Ba, and Eu abundances (or upper limits) were computed using the measured equivalent widths (or estimated EW errors) with the derived stellar parameters. If the elemental abundance was derived from a single line, or if the derived abundances deviated by more than 3 from the average values computed for an atomic species from multiple lines, the abundances were checked with spectral synthesis, and modified if necessary. For most of the used lines, synthetic spectra with abundances derived from the measured equivalent widths match the observed spectra well. However, for lines that suffer from blending or problems in setting the continuum level, the observed spectral line was not properly reproduced with the abundance derived from equivalent widths. In such cases, the abundance derived from spectral synthesis was adopted. For lines with no detectable features but with reasonable S/N, a 3 upper limit of corresponding elemental abundace was estimated based on the Bohlin et al. (1983) formular, i.e., , where is the pixel width, and corresponds to number of pixels across the line. Note that no useful upper limits could be derived for Si of LAMOST J125346.09075343.1 due to difficulty in defining the continuum nearby Si 4102 Å. The derived abundances (upper-limits) of the program stars are listed in Table 3, which also includes the number of lines that have been used for deriving the abundance, , together with the abundance error as described in the following text.
| LAMOST J125346.09075343.1 | LAMOST J131331.18055212.4 | Sun | |||||||||
| Ion | log (X) | [X/Fe] | log (X) | [X/Fe] | log (X) | ||||||
| Li | 1.80 | 0.14 | … | 1 | 0.68 | … | … | 1 | 1.05 | ||
| C | 6.00 | 0.19 | 1.59 | 1 | 6.15 | 0.46 | 1.83 | 1 | 8.43 | ||
| Na | 2.02 | 0.18 | 0.20 | 2 | 2.07 | 0.14 | 0.06 | 2 | 6.24 | ||
| Mg | 3.82 | 0.10 | 0.24 | 2 | 3.83 | 0.16 | 0.34 | 3 | 7.60 | ||
| Si | … | … | … | 0 | 3.85 | 0.16 | 0.45 | 1 | 7.51 | ||
| Ca | 2.69 | 0.18 | 0.37 | 2 | 2.37 | 0.20 | 0.14 | 2 | 6.34 | ||
| Sc | 0.66 | 0.12 | 0.21 | 1 | 1.13 | 0.19 | 0.17 | 2 | 3.15 | ||
| Ti | 1.43 | 0.12 | 0.50 | 9 | 1.20 | 0.16 | 0.36 | 9 | 4.95 | ||
| Cr | 1.56 | 0.15 | 0.06 | 4 | 1.05 | 0.20 | 0.48 | 2 | 5.64 | ||
| Fe I | 3.48 | 0.13 | … | 18 | 3.39 | 0.22 | … | 41 | 7.50 | ||
| Fe II | 3.47 | 0.10 | … | 3 | 3.38 | 0.16 | … | 3 | 7.50 | ||
| Co | 1.75 | … | 0.78 | 1 | 0.91 | 0.22 | 0.03 | 1 | 4.99 | ||
| Ni | 2.87 | … | 0.67 | 0 | 1.91 | 0.18 | 0.20 | 1 | 6.22 | ||
| Zn | 2.06 | … | 1.52 | 1 | 1.71 | … | 1.26 | 1 | 4.56 | ||
| Sr | 0.96 | 0.11 | 0.19 | 2 | 2.05 | 0.20 | 0.81 | 2 | 2.87 | ||
| Ba | 2.14 | … | 0.30 | 1 | 2.50 | 0.21 | 0.57 | 2 | 2.18 | ||
| Eu | 1.90 | … | 1.60 | 1 | 3.00 | … | 0.59 | 1 | 0.52 | ||
Note: refers to the total uncertainty of the abundance errors, as described in the text.
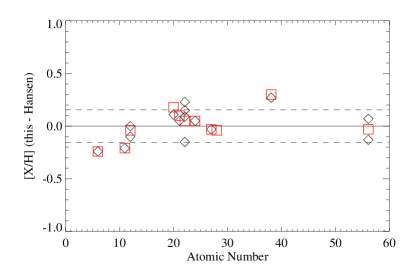
We have also compared the abundances [X/H] of LAMOST J131331.18055212.4 with those from Hansen et al. (2014), as shown in Fig. 3. The average difference between the abundance from this work and that from Hansen et al. (2014) is 0.010.16, indicating a very good agreement between the results of the two studies. We note that the adopted in the present work is about 250 K lower than that of Hansen et al. (2014). This would result in lower Fe abundances based on Fe I lines (see below). However, the smaller microturbulent velocity adopted in our analysis mostly compensate the abundance difference. The difference of may be caused by using different Fe I lines in the two sets of analysis. We note that Fe I lines used in our study is larger in number than those of Hansen et al. (2014), and also cover a wider range of equivalent widths.
3.2 Uncertainties
The error of the derived abundances of the sample mainly comes from two aspects, which includes the uncertainties of the equivalent width measurements, and those caused by the uncertainties of stellar parameters. In the case of equivalent width measurement, the dispersion around the average abundance was used to present random error in the measurements of the equivalent widths. The errors relevant to the uncertainties of the equivalent width measurement are listed in the columns of EW in Table 4. The abundance uncertainties associated with the uncertainties of the stellar parameters were estimated by individually varying by 150 K, by 0.3 dex, [Fe/H] by 0.3 dex, and by 0.3 km s-1 in the stellar atmospheric model. The adopted uncertainties of parameters are conservative estimations of the internal uncertainties derived from the spectroscopic analysis as shown in Table 2, and are comparable with previous experience using high-resolution (R30,000) spectra and spectroscopic method to determine stellar parameters of EMP stars (e.g. Placco et al., 2014a). In Table 4, columns , , [Fe/H], and summarize corresponding quantities in abundance uncertainties. The total uncertainty of the errors, which was computed as the quadratic sum of the above mentioned aspects, as shown in the column of in Table 3, and that of “Total” in Table 4.
| LAMOST J125346.09075343.1 | LAMOST J131331.18055212.4 | ||||||||||||
| Ion | EW | [Fe/H] | Total | EW | [Fe/H] | Total | |||||||
| Li | 0.10 | 0.10 | 0.00 | 0.00 | 0.00 | 0.14 | … | … | … | … | … | … | |
| C | 0.15 | 0.10 | 0.00 | 0.05 | 0.05 | 0.19 | 0.20 | 0.40 | 0.10 | 0.05 | 0.00 | 0.46 | |
| Na | 0.14 | 0.11 | 0.00 | 0.00 | 0.00 | 0.18 | 0.00 | 0.14 | 0.02 | 0.00 | 0.03 | 0.14 | |
| Mg | 0.01 | 0.10 | 0.00 | 0.00 | 0.03 | 0.10 | 0.03 | 0.13 | 0.03 | 0.00 | 0.09 | 0.16 | |
| Si | … | … | … | … | … | … | 0.05 | 0.15 | 0.00 | 0.00 | 0.00 | 0.16 | |
| Ca | 0.14 | 0.10 | 0.01 | 0.01 | 0.06 | 0.18 | 0.03 | 0.15 | 0.04 | 0.00 | 0.12 | 0.20 | |
| Sc | 0.05 | 0.09 | 0.06 | 0.00 | 0.00 | 0.12 | 0.07 | 0.11 | 0.07 | 0.00 | 0.12 | 0.19 | |
| Ti | 0.09 | 0.06 | 0.06 | 0.00 | 0.00 | 0.12 | 0.10 | 0.08 | 0.08 | 0.00 | 0.04 | 0.16 | |
| Cr | 0.05 | 0.14 | 0.00 | 0.00 | 0.01 | 0.15 | 0.00 | 0.19 | 0.03 | 0.00 | 0.04 | 0.20 | |
| FeI | 0.03 | 0.13 | 0.00 | 0.00 | 0.02 | 0.13 | 0.13 | 0.18 | 0.03 | 0.00 | 0.01 | 0.22 | |
| FeII | 0.08 | 0.02 | 0.06 | 0.00 | 0.00 | 0.10 | 0.12 | 0.03 | 0.10 | 0.00 | 0.01 | 0.16 | |
| Co | … | … | … | … | … | … | 0.08 | 0.20 | 0.02 | 0.00 | 0.01 | 0.22 | |
| Ni | … | … | … | … | … | … | 0.08 | 0.16 | 0.02 | 0.00 | 0.01 | 0.18 | |
| Sr | 0.01 | 0.09 | 0.06 | 0.00 | 0.03 | 0.11 | 0.06 | 0.12 | 0.07 | 0.00 | 0.13 | 0.20 | |
| Ba | … | … | … | … | … | … | 0.14 | 0.13 | 0.07 | 0.00 | 0.03 | 0.21 | |
4 Restuls and interpretations
4.1 Abundance trends from C through Zn
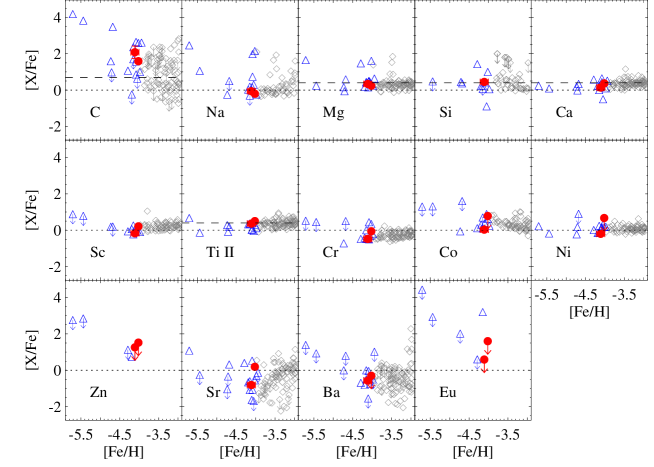
For 11 elements from C to Zn, abundance ratios of [X/Fe] of the program stars together with those of other known 15 UMP and 2 HMP stars from literatures are plotted against [Fe/H] in Fig. 4. Abundances of the extremely metal-poor stars from Yong et al. (2013a) are also included for comparison. Note that the most iron-poor star SMSS 03136708 with only an upper limit of [Fe/H] of 7.1 is not included in the discussion considering the scale of the plots.
Both of the two program stars are carbon-enhanced, as for 14 out of the 18 collected sample of UMP and HMP stars. This provides further support for the picture of high frequency of carbon enhancement in the early universe pointed out by previous studies (e.g., Norris et al., 2013b; Placco et al., 2014b). Such dominant enrichment of carbon at the beginning of the chemical evolution can be explained by the scenario, e.g., for low-mass star-formation proposed by Frebel et al. (2007), which indicates a cooling process through fine-structure lines of carbon and oxygen.
When investigating the carbon abundances of unevolved dwarf and turnoff metal-poor stars, Spite et al. (2013) has found a possible “plateau” or an upper limit of for carbon-rich metal-poor stars with . For the unmixed turnoff star in our sample, LAMOST J125346.09075343.1, we have derived a carbon abundance of , which is well below the “plateau” value, while Hansen et al. (2014) has derived for the turnoff UMP HE 02330343 in their sample. Therefore additional data of less evolved CEMP stars are required before one can conclude whether there exists such a carbon “plateau” at low metallicities.
Aside from the enhancement of carbon, the two program stars in our work show no excess or deficiency of -elements or iron-peak elements, but follow the general trend of abundance ratios in other elements as found in “normal” EMP stars. This is also consistent with the indication by larger samples of EMP stars (e.g., Yong et al., 2013a, Li et al. 2015), that there is a “normal” population dominating the elemental abundance pattern even at the extremely low-metallicity region, except for the carbon-excesses found in many EMP stars.
The abundance ratios of the two stars are very similar in general. Some notable differences are found for Sc and Cr. The [Sc/Fe] of the red-giant LAMOST J131331.18055212.4 is about 0.3 dex lower than that of the turn-off star LAMOST J125346.09075343.1, which is consistent with the discrepancy found by Bonifacio et al. (2009) when comparing EMP turnoff and giant stars. However, they also indicate that the abundance difference cannot be explained by the granulation effect. A low [Cr/Fe] is also obtained for LAMOST J131331.18055212.4, whereas is derived for LAMOST J125346.09075343.1. Such a discrepancy between giants and dwarf stars have been suggested by previous studies (Lai et al., 2008; Bonifacio et al., 2009) that have suggested the non-LTE effect in neutral Cr lines.
4.2 Neutron-capture elements
The wavelength coverage and quality of the spectra enable us to measure abundances of Sr and Ba, which represent light and heavy neutron-capture elements. The abundances of Sr are derived for both objects, while the Ba abundance is determined for the giant LAMOST J131331.18055212.4. Only an upper limit of the Ba abundance is estimated for the turn-off star LAMOST J125346.09075343.1. As can be seen from the last two panels of Fig. 4, the number of UMP stars with detected Sr and Ba is still very small. The abundance of these elements in UMP and HMP stars are very important to understand the neutron-capture processes in the early universe and the origin of carbon-excess for CEMP stars.
The abundance ratios of [Sr/Fe] and [Ba/Fe] of the two program stars are all around or slightly below the Solar value. Such low abundances of neutron-capture elements indicate no significant contribution of process to these stars, and that these stars belong to the CEMP-no sub-class (Beers & Christlieb, 2005; Sivarani et al., 2006). This result supports the findings of previous studies that the significant fraction of CEMP stars are classified into CEMP-no at extremely low metallicity (Aoki et al., 2007; Norris et al., 2013b).
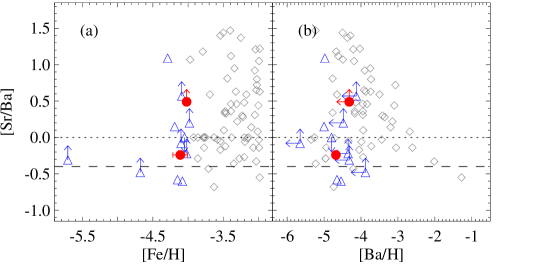
The abundance ratios of the two elements, [Sr/Ba], are useful to constrain the possible nucleosynthesis processes that have taken place in the progenitors of these stars (François et al., 2007; Aoki et al., 2013a). Since production of heavy neutron-capture elements (e.g., Ba) relative to light ones (e.g., Sr) is efficient in the main s-porcess at low metallicity due to high ratios of neutron to seed nuclei (e.g. Busso et al., 1999), a low [Sr/Ba] ratio, e.g., , is expected, as shown by the dashed line in Fig. 5 (Spite et al., 2013). The [Sr/Ba] of the two objects higher than this limit (Fig. 5) excludes the main process from possible origins of neutron-capture elements. Besides, as shown in Fig. 5b, the [Sr/Ba] of the two stars are within the range found by previous studies for stars with low [Ba/H].
Previous works have observed the absence of stars with at approximately or lower, as can be seen in Fig. 5a. The high Sr abundances found in many EMP stars with [Fe/H] are interpreted as significant contributions of neutron-capture process that only yields light neutron-capture elements, e.g., weak process (Wanajo & Ishimaru, 2006); Lighter Element Primary Process (LEPP, Travaglio et al., 2004). The cut-off suggests that such a process is not efficient at the lowest metallicity range, e.g. . The relatively high lower limit of [Sr/Ba] of LAMOST J125346.09075343.1 suggests, however, that the cut-off is located at lower metallicity () if it exists at all.
We note, however, that LAMOST J125346.09075343.1 is a CEMP-no star whose metallicity may not be well represented simply by the Fe abundance, but the excess of carbon should be taken into consideration in the comparisons with most of other EMP stars with shown in Fig. 5. The excess of Sr in this CEMP-no star also recalls the detection of Sr in the HMP star HE 13272326 (). Although the lower limit of [Sr/Ba] of this object is still low due to the high upper-limit of the Ba abundance, this object could also have high Sr/Ba ratios. However, the enhancement of Sr among CEMP-no stars are not especially associated with binaries, e.g., close binaries that favor mass transfer can be excluded in most cases (Starkenburg et al., 2014), while the connection with the carbon-excess might be able to probe the process to produce light neutron-capture elements at low metallicity.
4.3 Lithium
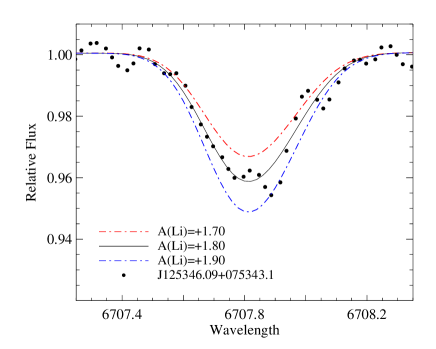
Lithium is only detected in the warmer one of the program stars LAMOST J125346.09075343.1, with 444 is defined as . (as shown in Fig. 6). This is the second lowest-metallicity turnoff star with Li detection, following HE 02330343 with and (Hansen et al., 2014). A quite low upper limit, , is derived for the other object LAMOST J131331.18055212.4. The derived upper limit is close to that from Hansen et al. (2014). Such low value is expected for red giants like LAMOST J131331.18055212.4, because they have already undergone the first dredge up and the surface material is mixed with internal one with depleted Li.
For further discussion on lithium in EMP/UMP stars, we limit the range to exclude severely Li-depleted stars such as the evolved giant LAMOST J131331.18055212.4. Among a variety of criteria of adopted in previous studies (e.g. Spite & Spite, 1982; Shi et al., 2007; Meléndez et al., 2010) we adopt K. This range includes the UMP turn-off star SDSS 1029+1729 with a low upper limit of the Li abundance (Caffau et al., 2012).
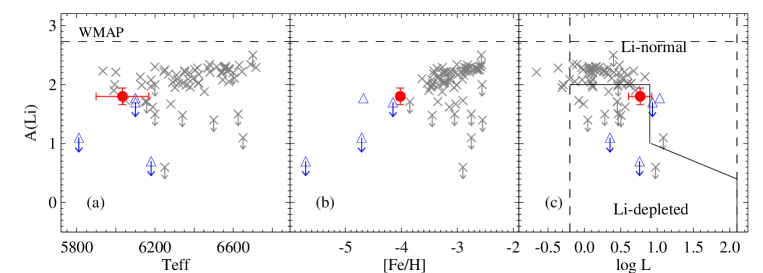
Li abundances of EMP/UMP stars are shown in Fig. 7 as a function of , [Fe/H] and luminosity. Metal-poor turnoff stars and dwarfs from literatures (Aoki et al., 2009; Sbordone et al., 2010; Bonifacio et al., 2012; Masseron et al., 2012) are also included for comparison in Fig. 7. To focus on lower metallicities, only objects with are shown in the plot.
In Fig. 7a, the observed plateau of lithium abundance ((Li)) is clearly seen, which is known to be about 0.5 dex lower than the model prediction by the big-bang nucleosynthesis based on the cosmological parameters determined from WMAP measurement, whereas a fraction of stars show lower values. The UMP turnoff star LAMOST J125346.09075343.1 in our sample is slightly below the observed plateau, compared with objects with similar temperatures but with higher metallicities.
The Li abundance of LAMOST J125346.09075343.1 is similar to that of the UMP turn-off star HE 02330343 with (Hansen et al., 2014). Fig. 7b shows the Li abundances as a function of Fe abundances. Our measured lithium abundance of LAMOST J125346.09075343.1 privides with a unique data point in the metallicity range around [Fe/H], suggesting decreases of Li abundances with decreasing metallicitiy, which is sometimes called the Spite plateau “meltdown” below (Sbordone et al., 2012). However, the Li detection for only two objects below does not allow us to investigate in more details about the explanation for such meltdown.
It should be noted that LAMOST J125346.09075343.1 and HE 0233 are both CEMP-no stars. Li abundances of CEMP stars were studied by Masseron et al. (2012) for an extended sample of more than 40 stars. Most of the stars in their sample are CEMP-s or CEMP-rs stars, which would be affected by the mass transfer from AGB companions. Masseron et al. (2012) showed that CEMP-no stars in their sample are Li-depleted, but the sample size is still small to derive any conclusions.
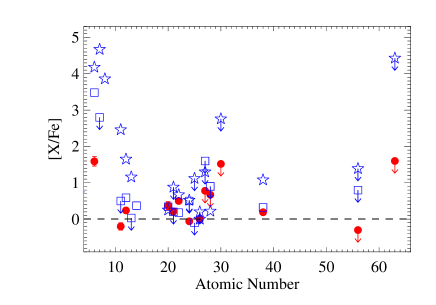
It is noted that in all plots of Fig 7, except the difference in the metallicity, LAMOST J125346.09075343.1 is quite similar to HE 02330343, including the lithium abundances, evolutionary status (luminosity), and the fact of both being CEMP-no (Hansen et al., 2014). These objects are also similar to the HMP CEMP-no turnoff star HE 13272326. However, no Li is detected in this HMP star, and a tight upper limit of (Li) dex is derived (Frebel et al., 2008). Elemental abundances of the three objects are compared in Fig. 8. Although these three objects are carbon-enhanced stars with no clear excess of the heavy neutron-capture element Ba, the abundance ratios of carbon, Na, and -elements are quantitatively different between the two UMP stars and HE 13272326, which might be related to the large difference of the Li abundance of HE 13272326 from the other two stars.
5 Conclusions
We present high-resolution and high-quality spectroscopic observations of two UMP stars with , adding one new discovery to the other dozen of such rare objects. The two objects have been selected from the LAMOST spectroscopic survey, and followed-up using Subaru/HDS. These are part of a larger project on searching for EMP stars with LAMOST and Subaru, and the current result proves the project to be quite efficient, reaching an 80% success in identifying EMP stars in the Galaxy.
Detailed abundance analyses (or upper limit estimation) are performed for 15 elements including Li, C, Na, four elements (Mg, Si, Ca, and Ti), five iron-peak elements (Sc, Cr, Co, Ni, and Zn), and three neutron-capture elements (Sr, Ba, and Eu). Both program stars are carbon-enhanced, in consistency with previous studies which suggest higher fraction of CEMP stars in lower metallicity range. Moreover, neither of the two objects are enhanced in neutron-capture element, supporting previous observational results that the subclass of CEMP-no dominates the extremely low-metallicity region. The origins of the enhancement of Sr in these objects cannot solely be explained by the mass transfer from an AGB companion, while the connection with their carbon excesses may shed light on productions of light neutron-capture elements at early times.
The lithium abundance is determined for the turnoff star LAMOST J125346.09075343.1, which makes it the second UMP turnoff star with Li detection. This newly discovered UMP turnoff star is located at a unique position around to support the so-called “meltdown” of the Li plateau at extremely low metallicities. It is noted that all known UMP and HMP turnoff stars are CEMP-no, except for SDSS 1029+1729 (Caffau et al., 2012), and depleted in lithium, which is consistent with the suggestion by Masseron et al. (2012). The origin of such trend is not yet clear, and larger sample of unevolved CEMP-no stars with Li detections would be important. When comparing with other UMP and HMP turnoff/dwarf stars, the turnoff star of our sample, LAMOST J125346.09075343.1 shows very close Li abundance to that of HE 02330343 (), while the HMP turnoff star HE 13272326 has no Li detection but a quite low upper limit of . By comparing their abundance patterns, it is shown that HE 13272326 is extremely enhanced in Na, Mg, and Sr, in contrast to the “normal” pattern of LAMOST J125346.09075343.1 and HE 02330343. Different polluters at their birth time and places may have been causing the observed discrepancies in Li abundances.
The huge amount of data which will be obtained through LAMOST spectroscopic survey, and joint collaborations with Subaru will enable us to significantly enlarge the sample of UMP stars, so as to explore the nature of the nucleosynthesis and chemical enrichment at the very beginning of the Universe.
We are grateful to the anonymous referee who made valuable suggestions and help improve the paper. H.N.L. and G.Z. acknowledge supports by NSFC grants No. 11103030, 11233004, and 11390371. W.A. and T.S. are supported by the JSPS Grant-in-Aid for Scientific Research (S:23224004). S.H. is supported by the JSPS Grant-in-Aid for Scientific Research (c:26400231). N.C. acknowledges support from Sonderforschungsbereich 881 “The Milky Way System” (subproject A4) of the German Research Foundation (DFG). Guoshoujing Telescope (the Large Sky Area Multi-Object Fiber Spectroscopic Telescope, LAMOST) is a National Major Scientific Project built by the Chinese Academy of Sciences. Funding for the project has been provided by the National Development and Reform Commission. LAMOST is operated and managed by the National Astronomical Observatories, Chinese Academy of Sciences.
References
- Alonso et al. (1999) Alonso, A., Arribas, S., & Martínez-Roger, C. 1999, A&AS, 140, 261
- Alonso et al. (2001) —. 2001, A&A, 376, 1039
- Aoki et al. (2009) Aoki, W., Barklem, P. S., Beers, T. C., Christlieb, N., Inoue, S., García Pérez, A. E., Norris, J. E., & Carollo, D. 2009, ApJ, 698, 1803
- Aoki et al. (2007) Aoki, W., Beers, T. C., Christlieb, N., Norris, J. E., Ryan, S. G., & Tsangarides, S. 2007, ApJ, 655, 492
- Aoki et al. (2014) Aoki, W., Suda, T., Beers, T. C., & Honda, S. 2014, ArXiv e-prints
- Aoki et al. (2013a) Aoki, W., Suda, T., Boyd, R. N., Kajino, T., & Famiano, M. A. 2013a, ApJ, 766, L13
- Aoki et al. (2005) Aoki, W., et al. 2005, ApJ, 632, 611
- Aoki et al. (2006) —. 2006, ApJ, 639, 897
- Aoki et al. (2013b) —. 2013b, AJ, 145, 13
- Asplund et al. (2009) Asplund, M., Grevesse, N., Sauval, A. J., & Scott, P. 2009, ARA&A, 47, 481
- Beers & Christlieb (2005) Beers, T. C., & Christlieb, N. 2005, ARA&A, 43, 531
- Beers et al. (1992) Beers, T. C., Preston, G. W., & Shectman, S. A. 1992, AJ, 103, 1987
- Beers et al. (1999) Beers, T. C., Rossi, S., Norris, J. E., Ryan, S. G., & Shefler, T. 1999, AJ, 117, 981
- Bohlin et al. (1983) Bohlin, R. C., Jenkins, E. B., Spitzer, Jr., L., York, D. G., Hill, J. K., Savage, B. D., & Snow, Jr., T. P. 1983, ApJS, 51, 277
- Bonifacio et al. (2012) Bonifacio, P., Sbordone, L., Caffau, E., Ludwig, H.-G., Spite, M., González Hernández, J. I., & Behara, N. T. 2012, A&A, 542, A87
- Bonifacio et al. (2009) Bonifacio, P., et al. 2009, A&A, 501, 519
- Bromm & Yoshida (2011) Bromm, V., & Yoshida, N. 2011, ARA&A, 49, 373
- Busso et al. (1999) Busso, M., Gallino, R., & Wasserburg, G. J. 1999, ARA&A, 37, 239
- Caffau et al. (2012) Caffau, E., et al. 2012, A&A, 542, A51
- Carollo et al. (2014) Carollo, D., Freeman, K., Beers, T. C., Placco, V. M., Tumlinson, J., & Martell, S. L. 2014, ApJ, 788, 180
- Carollo et al. (2012) Carollo, D., et al. 2012, ApJ, 744, 195
- Castelli & Kurucz (2003) Castelli, F., & Kurucz, R. L. 2003, in IAU Symposium, Vol. 210, Modelling of Stellar Atmospheres, ed. N. Piskunov, W. W. Weiss, & D. F. Gray, 20P–+
- Cayrel et al. (2004) Cayrel, R., et al. 2004, A&A, 416, 1117
- Cescutti et al. (2013) Cescutti, G., Chiappini, C., Hirschi, R., Meynet, G., & Frischknecht, U. 2013, A&A, 553, A51
- Christlieb et al. (2008) Christlieb, N., Schörck, T., Frebel, A., Beers, T. C., Wisotzki, L., & Reimers, D. 2008, A&A, 484, 721
- Christlieb et al. (2002) Christlieb, N., et al. 2002, Nature, 419, 904
- Christlieb et al. (2004) —. 2004, A&A, 428, 1027
- Cohen et al. (2013) Cohen, J. G., Christlieb, N., Thompson, I., McWilliam, A., Shectman, S., Reimers, D., Wisotzki, L., & Kirby, E. 2013, ApJ, 778, 56
- Cui et al. (2012) Cui, X.-Q., et al. 2012, Research in Astronomy and Astrophysics, 12, 1197
- Cyburt et al. (2008) Cyburt, R. H., Fields, B. D., & Olive, K. A. 2008, JCAP, 11, 12
- François et al. (2007) François, P., et al. 2007, A&A, 476, 935
- Frebel et al. (2013) Frebel, A., Casey, A. R., Jacobson, H. R., & Yu, Q. 2013, ApJ, 769, 57
- Frebel et al. (2008) Frebel, A., Collet, R., Eriksson, K., Christlieb, N., & Aoki, W. 2008, ApJ, 684, 588
- Frebel et al. (2007) Frebel, A., Johnson, J. L., & Bromm, V. 2007, MNRAS, 380, L40
- Frebel & Norris (2013) Frebel, A., & Norris, J. E. 2013, Metal-Poor Stars and the Chemical Enrichment of the Universe, ed. T. D. Oswalt & G. Gilmore, 55
- Frebel et al. (2005) Frebel, A., et al. 2005, Nature, 434, 871
- Hansen et al. (2014) Hansen, T., et al. 2014, ApJ, 787, 162
- Heger & Woosley (2010) Heger, A., & Woosley, S. E. 2010, ApJ, 724, 341
- Jacobson et al. (2015) Jacobson, H. R., et al. 2015, ArXiv e-prints
- Keller et al. (2014) Keller, S. C., et al. 2014, Nature, 506, 463
- Lai et al. (2008) Lai, D. K., Bolte, M., Johnson, J. A., Lucatello, S., Heger, A., & Woosley, S. E. 2008, ApJ, 681, 1524
- Lee et al. (2008) Lee, Y. S., et al. 2008, AJ, 136, 2022
- Li et al. (2015) Li, H.-N., Zhao, G., Christlieb, N., Wang, L., Wang, W., Zhang, Y., Hou, Y., & Yuan, H. 2015, ApJ, 798, 110
- Luo et al. (2012) Luo, A.-L., et al. 2012, Research in Astronomy and Astrophysics, 12, 1243
- Masseron et al. (2012) Masseron, T., Johnson, J. A., Lucatello, S., Karakas, A., Plez, B., Beers, T. C., & Christlieb, N. 2012, ApJ, 751, 14
- Masseron et al. (2010) Masseron, T., Johnson, J. A., Plez, B., van Eck, S., Primas, F., Goriely, S., & Jorissen, A. 2010, A&A, 509, A93
- McWilliam (1997) McWilliam, A. 1997, ARA&A, 35, 503
- McWilliam et al. (1995) McWilliam, A., Preston, G. W., Sneden, C., & Searle, L. 1995, AJ, 109, 2757
- Meléndez et al. (2010) Meléndez, J., Casagrande, L., Ramírez, I., Asplund, M., & Schuster, W. J. 2010, A&A, 515, L3
- Meynet et al. (2006) Meynet, G., Ekström, S., & Maeder, A. 2006, A&A, 447, 623
- Nomoto et al. (2013) Nomoto, K., Kobayashi, C., & Tominaga, N. 2013, ARA&A, 51, 457
- Norris et al. (2007) Norris, J. E., Christlieb, N., Korn, A. J., Eriksson, K., Bessell, M. S., Beers, T. C., Wisotzki, L., & Reimers, D. 2007, ApJ, 670, 774
- Norris et al. (1996) Norris, J. E., Ryan, S. G., & Beers, T. C. 1996, ApJS, 107, 391
- Norris et al. (2013a) Norris, J. E., et al. 2013a, ApJ, 762, 25
- Norris et al. (2013b) —. 2013b, ApJ, 762, 28
- Placco et al. (2014a) Placco, V. M., Frebel, A., Beers, T. C., Christlieb, N., Lee, Y. S., Kennedy, C. R., Rossi, S., & Santucci, R. M. 2014a, ApJ, 781, 40
- Placco et al. (2014b) Placco, V. M., Frebel, A., Beers, T. C., & Stancliffe, R. J. 2014b, ApJ, 797, 21
- Rockosi et al. (2009) Rockosi, C., Beers, T. C., Majewski, S., Schiavon, R., & Eisenstein, D. 2009, in Astronomy, Vol. 2010, astro2010: The Astronomy and Astrophysics Decadal Survey, 14
- Roederer et al. (2014) Roederer, I. U., Preston, G. W., Thompson, I. B., Shectman, S. A., Sneden, C., Burley, G. S., & Kelson, D. D. 2014, AJ, 147, 136
- Sbordone et al. (2012) Sbordone, L., Bonifacio, P., & Caffau, E. 2012, Memorie della Societa Astronomica Italiana Supplementi, 22, 29
- Sbordone et al. (2010) Sbordone, L., et al. 2010, A&A, 522, A26
- Shi et al. (2007) Shi, J. R., Gehren, T., Zhang, H. W., Zeng, J. L., & Zhao, G. 2007, A&A, 465, 587
- Sivarani et al. (2006) Sivarani, T., et al. 2006, A&A, 459, 125
- Sneden (1973) Sneden, C. 1973, ApJ, 184, 839
- Sobeck et al. (2011) Sobeck, J. S., et al. 2011, AJ, 141, 175
- Spite & Spite (1982) Spite, F., & Spite, M. 1982, A&A, 115, 357
- Spite et al. (2013) Spite, M., Caffau, E., Bonifacio, P., Spite, F., Ludwig, H.-G., Plez, B., & Christlieb, N. 2013, A&A, 552, A107
- Starkenburg et al. (2014) Starkenburg, E., Shetrone, M. D., McConnachie, A. W., & Venn, K. A. 2014, MNRAS, 441, 1217
- Suda et al. (2004) Suda, T., Aikawa, M., Machida, M. N., Fujimoto, M. Y., & Iben, Jr., I. 2004, ApJ, 611, 476
- Travaglio et al. (2004) Travaglio, C., Gallino, R., Arnone, E., Cowan, J., Jordan, F., & Sneden, C. 2004, ApJ, 601, 864
- Umeda & Nomoto (2005) Umeda, H., & Nomoto, K. 2005, ApJ, 619, 427
- Wanajo & Ishimaru (2006) Wanajo, S., & Ishimaru, Y. 2006, Nuclear Physics A, 777, 676
- Yanny et al. (2009) Yanny, B., et al. 2009, AJ, 137, 4377
- Yong et al. (2013a) Yong, D., et al. 2013a, ApJ, 762, 26
- Yong et al. (2013b) —. 2013b, ApJ, 762, 27
- York et al. (2000) York, D. G., et al. 2000, AJ, 120, 1579
- Zhao et al. (2012) Zhao, G., Zhao, Y.-H., Chu, Y.-Q., Jing, Y.-P., & Deng, L.-C. 2012, Research in Astronomy and Astrophysics, 12, 723