11email: tventuri@ira.inaf.it 22institutetext: National Centre for Radio Astrophysics, Tata Institute of Fundamental Research, Post Bag 3, Ganeshkind, Pune 411007, India 33institutetext: Department of Astronomy, University of Maryland, College Park, MD, 20742-2421, USA 44institutetext: INAF–Osservatorio Astronomico, Via Ranzani 1, 40126 Bologna, Italy 55institutetext: Dipartimento di Fisica e Astronomia, Universitá di Bologna, Via Ranzani 1, 40126 Bologna, Italy
Brightest Cluster Galaxies in the Extended GMRT radio halo cluster sample
Abstract
Aims. First-ranked galaxies in clusters, usually referred to as Brightest Cluster Galaxies (BCGs), show exceptional properties over the whole electromagnetic spectrum. They are the most massive elliptical galaxies, and show the highest probability to be radio loud. Moreover, their special location at the centres of galaxy clusters raises the question of the role of the environment on their radio properties. In the attempt to decouple the effect of the galaxy mass and of the environment in their statistical radio properties, we investigate the possible dependence of the occurrence of radio loudness and of the fractional radio luminosity function on the dynamical state of the hosting cluster.
Methods. We studied the radio properties of the BCGs in the Extended GMRT Radio Halo Survey (EGRHS), which consists of 65 clusters in the redshift range 0.2–0.4, with X–ray luminosity L erg s-1, and quantitative information on their dynamical state from high quality imaging. We obtained a statistical sample of 59 BCGs, which was divided into two classes, depending on the dynamical state of the host cluster, i.e. merging (M) and relaxed (R).
Results. Among the 59 BCGs, 28 are radio–loud, and 31 are radio–quiet. The radio–loud sources are located favourably located in relaxed clusters (71%), while the reverse is true for the radio–quiet BCGs, mostly located in merging systems (81%). The fractional radio luminosity function (RLF) for the BCGs in merging and relaxed clusters is different, and it is considerably higher for BCGs in relaxed clusters, where the total fraction of radio loudness reaches almost 90%, to be compared to the 30% in merging clusters. For relaxed clusters, we found a positive correlation between the radio power of the BCGs and the strength of the cool core, consistent with previous studies on local samples.
Conclusions. Our study suggests that the radio loudness of the BCGs strongly depends on the cluster dynamics, their fraction being considerably higher in relaxed clusters. We compared our results with similar investigations, and briefly discussed them in the framework of AGN feedback.
Key Words.:
radio continuum: galaxies - galaxies: cluster: general - galaxies: active - X-rays: galaxies - clusters1 Introduction
First-ranked galaxies are the brightest and most massive galaxies in the Universe, and inhabit the cores of galaxy clusters. Galaxies in this class are both elliptical and cD, and are commonly referred to as Brightest Cluster Galaxies (BCGs). BCGs represent the bright end of the luminosity function of early–type galaxies, with a small luminosity dispersion around the mean value. They are located at small distance from the peak of the thermal X–ray emission from the intracluster medium (ICM), and have small velocity dispersions (Quintana & Lawrie quintana82 (1982)).
Due to their special location at the centres of the largest gravitationally
bound structures in the Universe, BCGs have been devoted special
attention for a long time. Many of them exhibit exceptional properties,
with emission in the UV and FIR, as well as Hα lines, suggesting
the presence of multiphase gas and ongoing star formation
(e.g. O’Dea et al. odea08 (2008), Haarsma et al. haarsma10 (2010),
Donahue et al. donahue10 (2010), Edge et al. edge10 (2010),
O’Dea et al. odea10 (2010), Liu et al. liu12 (2012)).
From the radio point of view, BCGs are a special class, too. A large
fraction of them shows radio emission of nuclear origin. In a number of cases
the radio emission extends well beyond the optical envelope to form extended
radio jets, which bend in a C shape (wide–angle tail sources) as a result
of galaxy motion and cluster weather (Burns burns98 (1998)). A prototypical
case is the radio galaxy 3C 465 at the centre of A 2634 (Eilek et al.
eilek84 (1984)). Albeit some
remarkable exceptions, their radio power is either at the transition
between FRI and FRII radio galaxies
(Fanaroff & Riley fr74 (1974)) or below (Owen & Laing ol89 (1989)).
Over the past decade, our view and understanding of the properties of the central regions in galaxy clusters has improved thanks to the contribution of the X–ray observatories and XMM–Newton. The radiative cooling of the X–ray emitting gas in cool–core clusters (Peterson & Fabian peterson06 (2006)) requires some source of heating to balance the radiative losses, and the AGN activity associated with the BCG in those systems is the primary candidate to provide such energy (McNamara & Nulsen mcnamara07 (2007)). The existence of aged radio plasma, detected at frequencies below 1 GHz and associated with X–ray cavities in a number of rich and poor clusters, is interpreted as the signature of repeated radio outbursts from the BCG, and provides strong support to the AGN feedback picture (e.g., Clarke et al. clarke05 (2005) and clarke09 (2009), Fabian et al. fabian02 (2002), Giacintucci et al. 2011a , McNamara & Nulsen mcnamara12 (2012)).
An important tool to investigate the nature of the radio loudness in elliptical galaxies is the fractional radio luminosity function (RLF), defined as the probability that an elliptical galaxy of a given optical magnitude hosts a radio galaxy with radio power above a threshold value. A number of studies show that the RLF strongly depends on the optical magnitude of the associated galaxy (e.g. Auriemma et al. auriemma77 (1977), Ledlow & Owen lo96 (1996), Mauch & Sadler mauch07 (2007), Bardelli et al. bardelli10 (2010)), and is higher for brighter absolute optical magnitudes. BCGs are by definition the brightest galaxies, and show the highest probability to be radio loud. However, BCGs are special not only in terms of mass but also because of their location at the cluster centre, and it is important to decouple these two effects. Those earlier studies suggested that the fractional radio luminosity function is independent of the galaxy environment (rich clusters, groups, field). On the other hand, Best et al. (best07 (2007)) found that BCGs are more likely to be radio loud than other galaxies of similar mass, and this effect becomes stronger for galaxies with stellar mass MMSun, suggesting that their location at the cluster centre does play a role in their radio properties. The importance of the local environment was clear also from the work of Mittal et al. (mittal09 (2009)), who studied the radio properties of the HIghest X–ray FLUx Galaxy Cluster Sample (HIFLUGCS, Reiprich & Böhringer RB02 (2002)), and found that radio loud BCGs are more abundant in cool–core clusters: their fraction increases from 45% in non–cool–core (NCC) to 100% in strong cool–core (SCC) systems, and their radio power shows a positive correlation with the cool–core strength.
In this context, and motivated by the importance to decouple the effect of the galaxy mass from that of the local environment, we addressed the question of the radio properties of BCGs in connection with the dynamical status of the host cluster, with the aim of providing a complementary picture to previous literature studies. We used the Extended GMRT (Giant Metrewave Radio Telescope) Radio Halo Survey (EGRHS), which includes 65 clusters in the redshift interval 0.20.4 observed at 610 MHz (see Venturi et al. venturi07 (2007) and venturi08 (2008), hereinafter V07 and V08; Kale et al. kale13 (2013) and kale15 (2015), hereinafter K13 and K15). The main goal of the EGRHS was to investigate the origin of diffuse cluster–scale radio sources in galaxy clusters, namely radio halos, mini–halos and relics. Thanks also to the results of the EGRHS, nowadays it is quite clear that the origin of large diffuse emission in galaxy clusters is related to the cluster dynamical status (e.g. Brunetti & Jones bj14 (2014) for a review). In particular, it has been statistically shown that giant radio halos are associated with merging galaxy clusters (V07, Cassano et al. cassano10 (2010), hereinafter C10), as well as radio relics (e.g. de Gasperin et al. degasperin14 (2014)). On the other hand, radio mini–halos always surround a radio active BCG at the centre of relaxed cool–core clusters (Giacintucci et al. giacintucci14 (2014), ZuHone et al. zuhone13 (2013), K15). Diffuse cluster scale emission in galaxy clusters can thus be used as tracer of the cluster dynamics, together with the more direct probes supplied by X–ray imaging and analysis.
In this paper we present the radio properties and the fractional radio luminosity function of the BCGs in the EGRHS, and relate those quantities to the cluster dynamical status (merger versus relaxed), which we derived quantitatively using high quality images. The paper is organized as follows. In Sect. 2 we report on the selection criteria for our BCG sample and provide an overview of the sample as a whole; the radio properties of the BCGs and the X–ray properties of the host clusters are presented in in Sect. 3; in Sect. 4 we present the statistical radio properties of the BCGs, as well as the dynamical properties of the host cluster, and we describe the method to derive the fractional radio luminosity function. A discussion of our results and conclusions are given respectively in Sect. 5 and 6.
We adopted a standard CDM cosmology to convert observed quantitites into intrinsic ones (Ho=70 km s-1Mpc-1, =0.29). The convention S is used throughout the paper.
2 BCG Sample
The sample of BCGs presented in this work is extracted from the EGRHS (V07, V08, K13 and K15), which consists of galaxy clusters selected from the ROSAT–ESO flux–limited X–ray (REFLEX) galaxy cluster catalogue (Böhringer et al. boh04 (2004)) and from the extended ROSAT Brightest Cluster Sample (EBCS) catalogue (Ebeling et al. ebeling98 (1998) and ebeling00 (2000)) according to the following criteria:
-
•
LX (0.1-2.4 keV) erg s-1;
-
•
; and
-
•
.
From the original cluster sample we removed A 689, whose X–ray luminosity has been recently revised and is below our threshold (Giles et al. giles12 (2012)), and we remained with 65 clusters, whose BCGs were identified by visual inspection of the optical images. Where available we used images from the Data Release 7 (DR7) of the Sloan Digital Sky Survey (SDSS, Ahn et al. ahn14 (2014)), otherwise we used the red plate of the Digitized Sky Survey (DSS-2). In order to identify the BCGs we searched for the brightest cluster member in the proximity of the X–ray surface brightness peak, using the NASA Extragalactic Database (NED). Proprietary and archival and X–ray images were used to this aim. Out of the full cluster sample, six clusters host 2 BCGs (see Sect. 2.1), while no obvious one was found in three clusters (see Sect. 2.2).
The final BCG sample includes 68 objects (in 62 clusters). Table 1 reports the galaxies used for our statistical analysis, while Table 2 lists those radio emitting BCGs which were excluded (see Sect. 3.1). Both tables are listed in order of decreasing radio power, and contain the following information: column 1=cluster name; column 2= redshift; column 3=name of the BCG (from NED); column 4=radio power at 1.4 GHz (see Sect. 3.1); column 5=note on the dynamical state of the cluster (see Sect. 3.2); column 6 = note on the presence of diffuse cluster scale emission (RH=radio halo, MH=mini–halo). The three clusters with no obvious BCG are listed in Table 3. Some notes on the special cases are given in the next subsections.
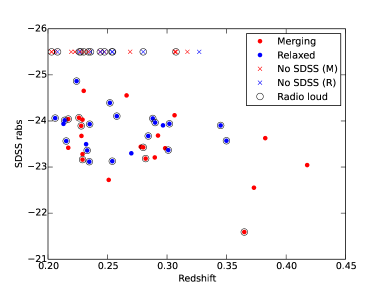
Fig. 1 shows the absolute red magnitude for the 44 objects in the sample with optical information available on the SDSS. Those galaxies without information are plotted as crosses at a fixed magnitude. The BCGs with radio emission are circled in black. There seems to be no bias in redshift or cluster type for those BCGs whose magnitude in unavailable on SDSS. Most of the BCGs with available information have absolute magnitude in the range –23 R –24, with few objects outside this interval. The faintest objects are at the highest redshift in the sample and are noticeably found in merging clusters. The stellar masses for BCGs in the redshift range considered here are on average a few times 1011MSun (Lin et al. lin13 (2013)).
2.1 Clusters with multiple BCGs
The cluster sample consists of several dynamically disturbed clusters, some of them with multiple peaks in the X–ray surface brightness images. The identification of the BCG in those clusters was made under the hypothesis that more than one BCG may be present, possibly associated with merging sub–clusters. We considered only those BCGs falling within the X–ray emission of the host cluster. Here below we report some information.
-
•
A 773 is a merging cluster with a radio halo (Govoni et al. govoni01 (2001)). Two BCGs are located close to the single X–ray peak. One has a compact radio source, detected after re–analyis of archival VLA observations at 1.4 GHz (Tables 1 and 2).
-
•
A 2163 has two BCGs (Maurorgodato et al. maurogordato08 (2008)). One of them is radio quiet, while the radio power of the second one is below the threshold considered for our statistical studies (Sect. 3.1, Tables 1 and 2).
-
•
A 2744 has two BGCs, located at the peak of both the X–ray emission and the radio radio halo (V13, Giacintucci et al. in prep.). Both galaxies are radio quiet (Table 1).
-
•
RXCJ1314.4–2515 is a known merging system (Mazzotta et al. mazzotta11 (2011)) with two radio relics and a halo (V07, Feretti et al. feretti05 (2005)). Two BCGs are identified by Valtchanov et al. (valtchanov02 (2002)). They lie on each side of the single X–ray peak and are both radio–quiet (Table 1).
-
•
RXCJ 1514.9–1523 has two BGCs, both radio quiet.
-
•
Z 5247 has a double peaked X–ray morphology with a BCG at each peak. One of the two BCGs has detected radio emission (Table 1).
Only 3/10 of the BCGs in these multiple merger clusters show radio emission at some level.
2.2 Clusters with no BCGs
In the optical field of A 520, RXCJ 2003.5–2323 and
RXCJ 1212.3–1816 there is no dominant galaxy that can be considered a BCG.
It is noteworthy that they are all merging clusters, two of them with
a radio halo (see Table 3).
Three BCGs are actually reported in the literature for A 520 (Mahdavi
et al. mahdavi07 (2007)), however they are all very distant from the
centre of the X–ray emission, and their absolute optical magnitude is
about a couple of magnitudes fainter than typical for this class of
objects, hence we regard A 520 as a non–BCG cluster.
2.3 Other special cases
A 141 shows complex X–ray substructure with a prominent secondary peak south of the main double condensation. Based on the image inspection and on the literature information we considered valid only the BCG listed in Hoffer et al. (hoffer12 (2012)). The radio power of this galaxy is below the threshold considered for our statistical investigations (see Sect. 3.1) and is reported in Table 2.
The central region of A 2813 is quite complex, with three candidate galaxies within the brightest region of X–ray emission. On the basis of the information available from NED (and by visual inspection of DSS–2), the galaxy coincident with the peak of the X–ray emission is the faintest. The brightest galaxy in this region is 2 MFGC 00530 and we consider it as the cluster BCG. It is radio quiet (see Table 1).
Note: Dynamical state: M=merger, R=relaxed;
Diffuse emission: mH=mini–halo; RH=Radio Halo; Rel=relic radio id.
References to dynamical state: ⋆ this paper; 1 Cuciti et al. 2015;
2 C10; 3 C13; 4 K15.
References to diffuse emission:
a Bacchi et al. 2003; bV07; c K15; d K13; e Giacintucci et al.
2014: f Murgia et al. 2009; g V13: h Giacintucci et al. 2011b;
i Mazzotta & Giacintucci 2008; l Giacintucci et al. 2014;
m Orrú et al. 2007; n V08; O Venturi et al. 2011;
p Feretti et al. 2005; q Giacintucci et al. 2011c;
r Govoni et al. 2001; s Feretti et al. 2001.
Name
z
BCG ID
logP
Dyn.
Diff.
2MASX/SDSS/other
W Hz-1
State
Emission
A 1763
0.2279
1237662306722447498
26.09
M1
A 2390
0.2329
1237680297268019748
25.54
R2
mHa
S 780
0.2357
2MASXJ14592875-1810453
25.21
R2
mHb,c
RXCJ 1115.8+0129
0.3499
1237654028716802393
24.87
R2
RXJ 0439.0+0520
0.208
2MASXJ04390223+0520443
24.85
R3
RXJ 1532.9+3021
0.345
2MASXJ15012308+4220405
24.80
R2
mHd,e
A 1835
0.252
2MASXJ14010204+0252423
24.80
R1
mHf
A 1576
0.302
2MASXJ12365866+6311145
24.77
R3
A 1300
0.3075
2MASXJ11315413-1955391
24.77
M2
RHg
RXCJ 1504.1–0248
0.2153
1237655497600467190
24.76
R2
mHh
RXJ2129.6+0005
0.235
2MASXJ21293995+0005207
24.64
R4
mHc
A 2667
0.2264
2MASXJ23513947-2605032
24.50
R2
Z 5247
0.229
2MASXJ12342409+0947157
24.46
M1
A 2146
0.234
2MASXJ15561395+6620530
24.44
M3
RXJ0027.6+2616
0.3649
2MASXJ00274579+2616264
24.38
M3
Z 2701
0.214
2MASXJ09524915+5153053
24.32
R2
A 1758a
0.28
2MASXJ13323845+5033351
24.27
M2
RHg
Z 2089
0.2347
2MASXJ09003684+2053402
24.25
R2
RXJ2228.6+2037
0.4177
1237680298882433199
24.15
M2
Z 2661
0.3825
1237667733956395341
24.06
M⋆
RH?n
A 2261
0.224
2MASXJ17222717+3207571
24.04
R2
Z 1953
0.373
2MASXJ08500730+3604203
24.04
M4
A 2895
0.2275
2MASXJ01181108-2658122
24.02
M1
Z 7160
0.2578
2MASXJ14571507+2220341
23.98
R2
mHi
Z 3146
0.29
2MASXJ10233960+0411116
23.95
R4
mHd,l
A 963
0.206
2MASXJ10170363+3902500
23.92
R⋆
A 1722
0.327
ABELL1722:[HHP90]1318+7020A
23.90
R4
Z 348
0.254
1237666340799643767
23.89
R3
A 2744
0.3066
ABELL2744:[CN84]001
23.84
M2
RH+Relg,m
A 2744_1
0.3066
ABELL2744:[CN84]002
23.84
M2
RH+Relg,m
Z 5699
0.3063
2MASXJ13055884+2630487
23.84
M3
A 781
0.2984
2MASXJ09202578+3029380
23.81
M2
Reln,o
A 2537
0.2966
2MASXJ23082221-0211315
23.80
R2
A 2813
0.2924
2 MFGC 00530
23.79
M1
Z 7215
0.2897
2MASXJ15012308+4220405
23.78
M⋆
A 2631
0.2779
2MASXJ23373975+0016165
23.74
M2
RXJ0142.0+2131
0.28
[BDJ2005]0479
23.72
R3
A 1682
0.226
2MASXJ13064997+4633335
23.71
M2
RXCJ2211.7-0350
0.27
2MASXJ22114596-0349438
23.71
R⋆
Z 5768
0.266
2MASXJ13114620+2201367
23.70
M3
A 68
0.254
2MASXJ00370686+0909236
23.65
M1
A 2645
0.251
2MASXJ23411705-0901110
23.64
M3
A 2485
0.2472
2MASXJ22483112-1606258
23.62
R3
RXCJ 1314.4-2515
0.2439
2MASXJ13142209-2515456
23.61
M
RH+2 Relb,p
2MASXJ13143263-2515266
23.61
A 2697
0.232
2MASXJ00031162-0605305
23.56
R3
RXCJ0437.1+0043
0.2842
2MASXJ04370955+0043533
23.55
R2
A 3444
0.2542
2MASXJ10235019-2715232
23.55
R1
mHc
A 267
0.23
2MASXJ01524199+0100257
23.55
M2
Z 5247_1
0.229
2MASXJ12341746+0945577
23.55
M1
A 2111
0.229
2MASXJ15394049+3425276
23.55
M⋆
A 2219
0.2281
2MASXJ16401981+4642409
23.54
M2
RHm
RXCJ 1514.9-1523_1
0.2226
2MASXJ15145772-1523447
23.52
M1
RHq
RXCJ 1514.9–1523
0.2226
2MASXJ15150305-1521537
23.52
M1
RHq
RXCJ 0510.7–0801
0.2195
2MASXJ05104786-0801449
23.51
M1
A 773
0.217
2MASXJ09175344+5143379
23.49
M2
RHr
A 1423
0.213
2MASXJ11571737+3336399
23.48
R2
A 209
0.206
2MASXJ01315250-1336409
23.44
M2
RHb
A 2163
0.203
ABELL2163:[MCF2008]308
23.43
M2
RHs
Note: Dynamical state: M=merger, R=relaxed;
Diffuse emission: mH=mini–halo; RH=Radio Halo; Rel=relic radio id.
References to dynamical state: 1 Cuciti et al. 2015; 2 C10;
3 C13. References to diffuse emission: a V08; b Macario et al. 2010;
c Govoni et al. 2001; d Feretti et al. 2001; e Brunetti et al. 2008.
Name
z
BCG ID
logP
Dyn.
Diff.
2MASX/SDSS/other
W Hz-1
State
Emission
A 2552
0.301
2MASXJ23113330+0338056
23.37
R?1
A 697
0.282
2MASXJ08425763+3622000
23.30
M2
RHa,b
A 141
0.23
2MASXJ01053543-2437476
23.21
M2
A 773_1
0.217
2MASXJ09175344+5144009
23.21
M2
RHc
A 611
0.288
2MASXJ08005684+3603234
23.12
R2
RXJ 0439.0+0715
0.244
2MASXJ04390053+0716038
23.12
R3
A 2163_1
0.203
2MASX J16153353-0609167
22.99
M2
RHd
A 3088
0.2537
2MASXJ03070207-2839574
22.79
R2
A 521
0.2475
2MASXJ04540687-1013247
22.66
M2
RH+Rele
References to dynamical state: 1 C10; 2 K15.
⋆ Note on the presence of diffuse radio emission:
GRH=giant radio halo. References: a Giacintucci et al. 2009;
b Govoni et al. 2001.
Name
z
Dynamical State
Note⋆
RXCJ 2003.5–2323
0.317
M1
GRHa
RXCJ 1212.3–1816
0.269
M2
–
A 520
0.203
M1
GRHb
3 The radio and X–ray data
3.1 The radio data
The EGRHS is the starting point of our BCG sample. The radio information we used to derive the radio luminosity function, however, is not taken from the 610 MHz GMRT observations (V07, V08, K13 and K15). To ensure a sensitivity as uniform as possible over the whole sample, and for a direct comparison with works from other authors, mainly performed at 1.4 GHz, we cross–checked our sample with the Northern VLA Sky Survey (NVSS) and extracted the 1.4 GHz flux density of each source directly from those images. To overcome a few cases of blending on NVSS, where possible we used the images on the VLA FIRST Survey (angular resolution of 5′′). Finally, for those BCGs in mini–halo clusters (see Table 1) we used the 1.4 GHz flux density values published in Giacintucci et al. (giacintucci14 (2014)), which were accurately estimated to avoid contamination from the diffuse emission of the mini–halo111For the BCG in S 780, flux density measurements from GMRT proprietary data and re–analysis of VLA archival data suggest that the source is variable, and that the core of the radio emission has an inverted spectrum..
For a number of clusters the FIRST images, whose angular resolution is comparable to our 610 MHz GMRT images () are not available, and the angular resolution of the NVSS () is inadequate to isolate the flux density of the BCG from that of other nearby sources (RXCJ 0439.0+0520, RXCJ 0027.6+2616, Z 348, RXCJ 0142.0+2131 and A 1682) or from a diffuse radio halo (A 1300 and A 1758a). In those cases we made use of our high resolution images at 610 MHz (V07, V08, K13 and K15) and at 325 MHz (Venturi et al. venturi13 (2013)) and we derived the flux density at 1.4 GHz assuming a spectral index of 0.8, which is a reasonable average value for this type of sources (Klein et al. klein95 (1995)).
Due to the higher sensitivity of the EGRHS compared to NVSS and FIRST,
six BCGs detected at 610 MHz do not have a counterpart either on
NVSS or on FIRST. In particular:
A 141 and A 3088 (V07),
A 521 (Giacintucci et al. giacintucci06 (2006)),
A 697 (V08),
A 2552 (K15) and RXJ 0439.0+0715 (K13).
Moreover, radio emission below the sensitivity limit of FIRST and NVSS
was detected by Giacintucci et al. (in prep.) for
A 773_1 and A 2163_1 after re-analysis of archival 1.4 GHz VLA
data.
Finally, A 611 has a strong detection at 610 MHz (the radio source
associated with the BCG has S mJy), but nothing is visible
on NVSS. Inspection of FIRST shows a very weak source (at )
which would have remained unnoticed without careful comparison with the
610 MHz image. For this source, in Table 2 we report the radio power
derived from the 1.4 GHz flux density from FIRST.
These nine radio sources, listed in Table 2, were removed from our statistical
analysis.
For those BCGs without radio emission, we considered a conservative
radio power upper limit derived from NVSS, whose average noise level is
1=0.45 mJy b-1, i.e. S mJy
(namely , see Table 1).
The final sample we used for the statistical studies (see Sect. 4 and 5) includes a total of 59 BCGs, hosted in 55 clusters.
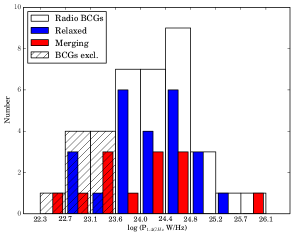
The histogram in Fig. 2 shows the radio power distribution of all BCGs with radio emission, including those nine faintest objects (see Table 2) which we did not consider in the statistical analyis performed in Section 4. The distribution peaks around logP 24.5, which is the typical transition power between FRI and FRII radio galaxies (Fanaroff & Riley fr74 (1974)), as commonly found at cluster centres. Except for the case of the BCG in A 1763 (the only object in the bin of highest radio power), the BCGs in relaxed clusters are the most abundant in most bins of radio power.
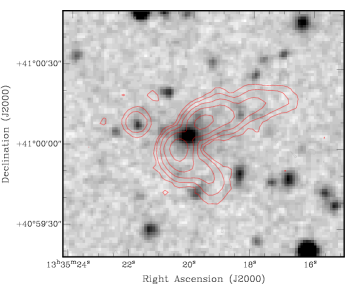
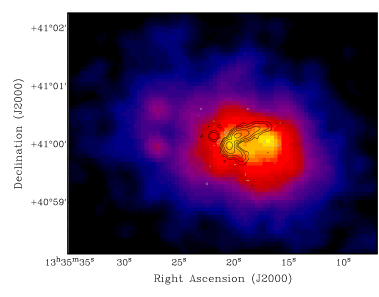
As a final remark, we note that all the radio BCGs in our sample show very little extended structure both at 610 MHz and at 1.4 GHz. The only exception is the wide–angle tail (WAT) at the centre of A 1763, whose 1.4 GHz contours from FIRST are shown in Fig. 3 overlaid on the optical frame and on the X–ray emission. This is also the most powerful radio source in the sample (see Table 1). WAT radio galaxies are found only in association with brightest cluster galaxies (Feretti & Venturi fv02 (2002) for a review), and their bent morphology is considered as the signature of bulk motions in the intracluster medium (Burns burns98 (1998)).
3.2 The X–ray data and cluster morphological analysis
To assess the cluster dynamical status we used the morphological parameters, namely the power ratio P3/P0, the centroid shift and the concentration parameter , derived in C10 and Cassano et al. (cassano13 (2013), hereinafter C13) from proprietary and archival data.
We briefly remind here that the power ratio is a multipole decomposition of the two–dimensional projected mass within a given aperture, and it provides a measure of the substructure (e.g., Buote & Tsai bt95 (1995)). The centroid shift is defined as the standard deviation of the projected separation between the peak and the centroid of the cluster X–ray brightness distribution (e.g., Poole et al. poole06 (2006)). In particular, is estimated over an aperture of 500 kpc. The concentration parameter is defined as the ratio of the peak (within 100 kpc) over the ambient (within 500 kpc) X–ray surface brightness (Santos et al. santos08 (2008)).
For five clusters not included in those earlier works (marked with in Table 1) we derived the morphological indicators following C10 (see Sect. 3 of C10 for details). The results of this analysis are reported in Tables 1, 2 and 3, where the clusters are classified as merger (M) or relaxed (R), according to their position in the morphological diagrams.
We further complemented our analysis with literature information, by visual inspection of the available X–ray images, and considering the presence of diffuse extended emission in the form of radio halos or mini–halos, whose connection respectively with merging and relaxed clusters is an established result (Brunetti & Jones bj14 (2014)).
All 65 clusters in the EGRHS have a classification of their dynamical status: 35 are merging (M) and 30 are relaxed (R), i.e. 54% and 46% respectively (see Tables 1, 2 and 3). Note that the morphological parameters used to derive the cluster dynamics are not sensitive to mergers aligned close to the line of sight, however it is reasonable to assume that these are only a negligible fraction of the whole esample. The redshift distribution of the two subsamples is quite similar: the median value of z is 0.251 and 0.253 for the merging and relaxed clusters respectively.
4 Radio loudness, cluster dynamics and radio luminosity function
4.1 Radio loudness fraction and cluster dynamics
Starting from the initial sample of 68 BCGs, and after inspection of the radio information available (Sect. 3.1), we ended up with a final sample of 59 objects for our statistical analysis. Out of these 59 BCGs, 28 are radio loud and 31 are radio quiet (47% and 53% in each class, see Table 1).
We divided the 55 clusters hosting the 59 BCGs (see Sect. 2.1 for the
clusters with multiple BCGs) in merging and relaxed, following Sect. 3.2
(see column 5 in Table 1), to estimate the fraction of radio loud BCGs in
each class: we have 29 merging and 26 relaxed clusters (53% and 47%
of the total respectively).
Our results are summarised in Table 4. Radio loud BCGs are considerably more common in relaxed clusters (71%
against 29% in merging clusters). Conversely, radio quiet BCGs are much
more common in merging systems (81% to be compared to the 19% in
relaxed clusters).
We tested the significance of this result by running Monte Carlo (MC)
calculations. In particular, we randomly assigned the 28 radio loud BCGs
among the 55 clusters in the sample and counted the number of objects
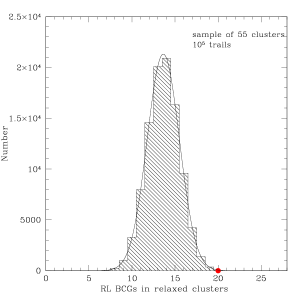
that fall in relaxed clusters in our MC trials. In the left panel of
Fig. 4 we report the distribution of the number of radio loud BCGs
in relaxed clusters obtained after MC trials. The distribution
can be fitted with a Gaussian function, with a central value of 13.6 and
standard deviation of 1.875. This means that the observed value of 20 BCGs
in relaxed clusters (red point in Fig. 4, left panel) is at 3.4
from the value expected
assuming that the distribution of the radio loud BCGs is independent of
the cluster dynamical status. This shows that the probability that our
result is a chance detection is .
A similar result can be obtained considering radio quiet BCGs in merging
and relaxed clusters.
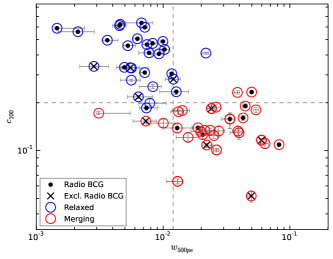
The distribution of the BCGs in the different environments is given in the right panel of Fig. 4, which shows the clusters in the – space, selected to describe the dynamical state. The grey dotted lines are traced as reference values to statistically pinpoint the regions of merging (bottom right portion) and relaxed (upper left portion) clusters (see C10 for details). The black points show the radio loud BCGs, and again we note that the bulk of them (71%) are found in relaxed systems.
4.2 Radio power of BCGs and cluster dynamics
The radio power of the BCGs in the full sample of 68 objects spans more than three orders of magnitude, from logP(W Hz-1)=22.66 (A 521) to logP (W Hz-1)=26.09 (A 1763) (see Tables 1 and 2). Even restricting our considerations to the 59 BCGs used in the statistical sample, the range of values is quite broad (2.5 orders of magnitude).
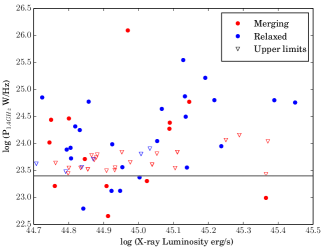
We checked for a possible connection between the radio power of the BCGs, the X–ray luminosity (LX), and the dynamical state of the host cluster. The left panel of Fig. 5 shows the distribution of the radio power of the BCGs in different environments versus LX. Upper limits are also plotted. The figure is suggestive of a few considerations. Even though no significant trend is visible, upper limits are much more abundant in less luminous (logLX (erg s ) merging clusters, whereas for logLX (erg s the fraction of radio BCGs is much higher, and 9 out of 10 are found in relaxed clusters.
If we consider the BCGs in relaxed clusters, only a weak trend is present between the radio power and the core X–ray luminosity (within 0.15R500222R500 is the radius corresponding to a total density contrast 500(z), where (z) is the critical density., see C13) of the host cluster: a Spearman test on a possible correlation between these two variables provides =0.375 and a probability of null hypothesis of 16.8%. A correlation might be present for logLX (erg s-1) 45, but the small number of points above this value does not allow to draw any conclusion.
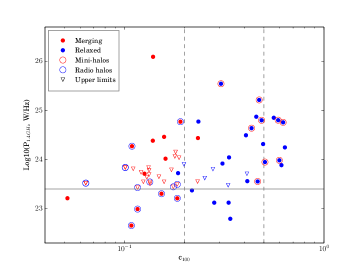
Finally, we checked for a possible dependence of the BCG radio power
with the cluster dynamics. We used the concentration parameter as
proxy for the cluster dynamical state
(high values of indicate peaked X–ray brightness distributions,
typical of relaxed clusters) and plotted the radio power and upper
limits vs . Our results are shown in the right panel of Fig. 5.
As a further information, we highlighted those relaxed clusters hosting
a mini–halo, and those merging clusters hosting a giant radio halo.
By definition all relaxed clusters (blue dots) have .
The radio power range is populated fairly uniformly for both classes.
No obvious trend is visible for the radio loud BCGs in merging clusters,
which span the whole range of radio power. On the other hand, the
right panel of Fig. 5 is suggestive of a positive trend for the BCGs in
relaxed systems, which show increasing radio power with increasing value
of .
A Spearman test on the possible correlation between logP and
for the radio BCGs in relaxed clusters provides a Spearman’s
rank–order coefficient =0.53 (suggesting a positive correlation)
and a probability of null hypothesis of 1%, which is thus rejected.
The test was performed on all relaxed clusters with .
The inclusion of the two most deviating points (i.e., A 1576 and A 2390)
does not change the result.
| # BCGs | Merging | Relaxed | % Merging | % Relaxed |
|---|---|---|---|---|
| Radio Loud | 8 | 20 | 29% | 71% |
| Radio Quiet | 25 | 6 | 81% | 19% |
4.3 The fractional radio luminosity function
The fractional radio luminosity function (RLF) is a powerful tool to investigate the statistical properties of a population of objects. It provides the probability that a galaxy is radio loud with radio power higher than a given value of P.
To minimize the problems raised by the sensitivity limits of different
arrays and ensure uniform sensitivity, we based our analysis on NVSS
(see Section 3.1). However, the redshift of the BCGs in our sample spans
over the range z=0.2–0.4, and the radio power upper limit
for the undetected sources is a function of redshift, as clear from
Table 1.
To account for the upper limits in the fractional RLF, different methods have
been proposed. Among those, we adopted that developed by Fanti
(see appendix in Hummel hummel81 (1981)), which shows the smallest
statistical fluctuations in Monte Carlo experiments. The cumulative
fractional radio luminosity function is described as follows:
with
Here is the fraction of detections in the –th radio power interval, is the number of upper limits (undetections) for , and is the number of detections for . Given a sample with N objects, due to sensitivity limits objects are undetected, and are detected, and +=N.
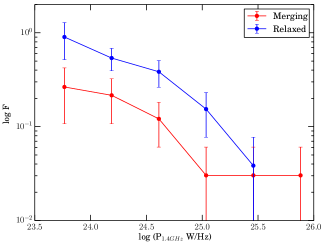
We computed the fractional RLF using radio power intervals with width logP=0.4. We then summed up the detections in each bin to obtain the RLF in the cumulative form. Our results are shown in Fig. 6, where the RLF is reported for the merging (red) and relaxed clusters (blue).
The fractional RLF for our two subsamples is different. BCGs in relaxed clusters show a significantly higher probability to be radio loud than those in merging systems. At high radio powers the statistics is poor (as clear from Tab. 1), while the faint end of the radio luminosity function suffers from incompleteness, nevertheless the differences are clear in the most populated bins of radio detections. In particular, the probability that a BCG in a relaxed cluster is radio loud with radio power logP(W Hz-1) 23.5 is 90%, to be compared to 30% for the BCGs in merging clusters.
To quantify this result we applied a Kolmogorov-Smirnov (KS) test to the fractional RLF in merging and relaxed clusters. The null hypothesis in this test is that both samples are drawn from the same distribution. We obtained D=0.67 (distribution parameter) and p=7.6% (probability function), hence we reject the null hypothesis. The statistical significance of this result is small, however it is strengthened by the results found in the previous sections.
5 Discussion
In this paper we address the question of the possible connection between the nuclear radio emission of BCGs and the dynamical state of the host cluster. The sample selected to this aim consists of 68 galaxies in the clusters of the Extended GMRT Radio Halo Survey (LX (0.1-2.4 keV) erg s-1, and ).
Previous studies focussed on samples of BCGs in nearby clusters and groups (z0.2), and were mainly performed in the framework of the AGN/ICM feedback mechanisms, hence they were mainly concentrated on the connection between the radio loudness of the BCGs and the presence of a cool core (Mittal et al. mittal09 (2009), Sun et al. sun09 (2009), Dunn & Fabian dunn08 (2008)). They provided clear indication of a positive correlation between the strength of the cluster cool core and the presence of a radio loud BCG, and its power.
The statistical analysis presented here differs from the earlier investigations, and complements those results. Our BCG sample covers a new redshift space, and extends the findings of previous studies up to z=0.4. Our starting sample of galaxy clusters has no a-priori bias towards the cluster dynamical state, the clusters being almost evenly distributed between mergers and relaxed systems (52% and 48% respectively). From the radio point of view, our analysis is not restricted to the most powerful and extreme BCGs, but it includes also relatively faint objects, down to logP (W Hz-1) 23.5. Finally, our statistical analysis accounts for the sensitivity limits of the radio data, with the inclusions of the upper limits for the non–detections, and it is hence complete within the volume covered by the sample.
5.1 Statistical properties of the BCGs in the EGRHS cluster sample and the cluster dynamics
The radio power range of our sample is typical of low and intermediate power radio loud AGN (23 logPW Hz-1 26, see Owen & Laing ol89 (1989) for reference values), and our analysis shows that the nuclear radio properties of BCGs strongly depend on the central properties of the host cluster.
Roughly 50% of the BCGs in our sample are radio loud, consistent with earlier findings (Best et al. best07 (2007)). However, if we separate the BCGs according to the dynamical state of the cluster, we find that radio loud BCGs are much more abundant in relaxed systems, i.e. 71% vs 29%. Monte Carlo simulations show that the probability of a chance result can be rejected (Sect. 4.1). At the same time radio quiet objects are mainly found in merging clusters, i.e. 81% vs 19%. Motivated by this result, we further investigated the possible dependence of the radio power of the BCGs with the cluster dynamics.
Mittal et al. (mittal09 (2009)), reported that at fixed X–ray luminosity the fraction of radio loud BCGs as well as their radio power increase with increasing cool–core strength. Our analysis based on the X–ray images for the clusters in our sample neither separates cool–core and non–cool–core clusters, nor allows it to measure the strength of cool cores; however, the parameter was introduced to search for cool–core clusters and its value is a measure of the cool–core strength, which increases with increasing (Santos et al. santos08 (2008), C13). On this basis, we made a comparison between our results and those in Mittal et al. (mittal09 (2009)), and tentatively separated all clusters in three different intervals of , following their classification (see dotted lines in the right panel of Fig. 5): clusters with are mergers, i.e. likely non–cool–core clusters (NCC), those with are weak cool–cores (WCC) and those with should have strong cool–cores (SCC). Allowing for the uncertainty due to the poorer statistics in each interval, our data are consistent with the result reported in Mittal et al. (mittal09 (2009)). In particular, the fraction of radio BCGs is considerably lower in clusters with (NCC) compared to WCC+SCC clusters (): it rises from 33% to 85%. If we restrict our considerations to the WCC and SCC clusters, the fraction further increases from 84% for WCC to 100% for SCC, as clear in Fig. 5 (right).
Finally, we found a positive correlation between the concentration parameter and the radio power of the BCG in relaxed clusters. After removing A 1576 and A 2390 (see Sect. 4.1), we fitted the law
and found a=2.550.33 and b=25.050.83. For comparison, Mittal et al. (mittal09 (2009)) found P, on a larger sample of objects. Considering that (e.g. Santos et al. santos08 (2008)) our results are in line with those obtained by Mittal et al. (mittal09 (2009)).
The close connection between the fraction of radio loud BCGs, their power and the cluster dynamics is further strengthened by the fractional radio luminosity function (RLF), which shows that BCGs in relaxed systems have a considerably higher probability to be radio loud than those in merging clusters: the probability to find a radio loud BCG with logPW Hz 23.5 is almost 90% for relaxed clusters, whereas it falls to 20-30% in merging clusters.
5.2 Optical properties of the BCGs in the EGRH sample
To check for possible trends between the dynamical state of the host clusters, the radio emission of the BCGs and the properties of the gaseous environment feeding the AGN, we investigated the occurrence of optical emission lines in the spectra of the BGCs in our sample.
Unfortunately, only 28/68 BCGs in the full sample have spectra on the SDSS, therefore no strong conclusions can be drawn. Nevertheless the results are interesting. Among those 28 BCGs, 19 show radio emission (5/19 in merging and 14/19 in relaxed clusters) and 9 have upper limits (7/9 in merging and 2/9 in relaxed clusters). None of the galaxies with radio upper limit shows emission lines in the optical spectrum, while 11/19 radio loud do, and they are all found in relaxed clusters.
The optical spectrum of the BCG is available only for 7 of the mini–halo clusters in our sample , and in all cases emission lines are present. Those are A 1835, A 2390, RXCJ 1504.1–0248, RXCJ 1532.9+3021, RXCJ 2129.6+0005, Z 3146 and Z 7160. The remaining four are RXCJ 1115.8+0129, Z 2089, Z 2701 and Z 348.
It is interesting to note that the radio power of these emission line galaxies in our sample is typical of low/intermediate power radio galaxies, which usually lack emission lines (Balmaverde et al. balmaverde08 (2008), Heckman & Best hb14 (2014) and references therein) Moreover, most of the radio emitting BCGs in the sample are unresolved. The only exceptions are the small tail in Z 5247 and the large WAT in A 1763 (see Fig. 3).
5.3 BCGs, accretion and the radio properties of the host clusters
The dynamical state of galaxy clusters and their overall formation through a series of mergers are phenomena involving scales much larger (Mpc) than the inner regions at play in the radio loud activity of AGN, whose typical sizes are of the order of the sub–kpc. However, the striking occurrence of radio–loud BCGs in relaxed clusters and the positive trend between radio power and cool–core strength suggest that the two phenomena are related, at least to some extent.
The radio emission in massive early–type galaxies is broadly classified on the basis of their accretion rate, with “jet–mode” radio galaxies accreting inefficiently (L/LEdd 0.01) and “radiative–mode” sources accreting at high rates, i.e. L/LEdd 0.1 (see Heckman & Best hb14 (2014) for a recent review and nomenclature). The two classes of radio-loud AGN differ in the optical properties, the former being low-excitation (LERG), the latter being high excitation galaxies (HERG). Typically, radio galaxies with moderate radio power (P W Hz-1) belong to the first class (e.g., Balmaverde et al. balmaverde08 (2008)), while more powerful radio galaxies (P W Hz-1) usually show spectral features typical of the HERG class. It has been recently proposed (Hardcastle et al. hardcastle07 (2007)) that a main difference between LERG and HERG resides in the source of accreting gas: LERG may accrete hot gas from the intergalactic medium (“hot–mode”), while HERG may be fed by infalling cold gas (“cold–mode”). It has been further pointed out that the radio luminosity function for “hot–mode” radio galaxies would depend both on the black hole mass function and on the distribution properties of the central hot gas, while that of the “cold–mode” radio galaxies would be not be affected by the black hole mass.
By definition, cool–core clusters are characterized by relatively cold gas with high mass deposition rates at their centres (see Hudson et al. hudson10 (2010) for a review). This builds up a reservoir of cold gas for the BCGs at their centres, which may feed the AGN and provide fuel to the radio emission. Though on a limited fraction of our sample, the available spectral information does support this, suggesting that at least part of the radio loud BCGs in cool–core clusters in our sample are supplied by cold gas at the cluster centre. An impressive example is the BCG in RXCJ 1504.1–0248 (Ogrean et al. ogrean10 (2010)), which is one of the cool–core clusters with mini–halo. At the same time, the observations show that cool cores are often disrupted during cluster mergers, and this cold gas may no longer be available to the BCGs in unrelaxed systems. Indeed, none of the emission line BCGs in our sub–sample (see previous section) is in a merging cluster.
It is tempting to suggest that the fraction of radio galaxies and the fractional radio luminosity function for the BCGs in the relaxed clusters of our sample is the result of two populations of radio galaxies, one accreting gas from the hot corona, and the other accreting cold gas in cluster core region. The latter would not be found in merging clusters, as the contribution of the intracluster cold gas would be missing.
6 Summary and Conclusions
In this paper we addressed the possible connection between the radio properties of Brightest Cluster Galaxies and the dynamical state of the host cluster using a sample of BCGs selected from the Extended GMRT Radio Halo Sample (EGRHS). The BCGs in our sample are located in the redshift interval 0.2z0.4. All clusters have available quantitative information on their dynamical state from X–ray data. We can summarize our results as follows:
-
•
Most of the BCGs in our sample have optical red magnitude in the range –24 R –23, i.e. the stellar mass range of the galaxies (a few times 1011MSun) is narrow. Considering that the fraction of radio galaxies and the radio luminosity function depend on the stellar mass (e.g., Auriemma et al. auriemma77 (1977), Ledlow & Owen lo96 (1996), Bardelli et al. bardelli10 (2010)), the optical properties of our sample ensure that our results are not strongly affected by this.
-
•
The full radio sample includes 68 BCGs, whose radio power spans a wide range, from logP (W Hz-1)=22.8 to 26.1. Most of the radio galaxies are unresolved at the resolution of few arcsec (GMRT at 610 MHz).
-
•
High quality X–ray imaging is available for all the 65 clusters in the EGRHS. Our quantitative morphological analysis shows that mergers and relaxed clusters are fairly equally represented, i.e. 54% and 46% respectively.
-
•
Among the sample of 59 BCGs considered for our statistical analysis, 47% is radio loud. Among the radio–loud population 71% of the BCGs are located in relaxed systems. This result is solid (): Monte Carlo simulations show that the probability that this result is a chance detection is . On the other hand, radio quiet BCGs are mostly found in merging systems (81%).
-
•
We find that the fraction of radio BCGs in relaxed clusters increases with increasing value of the concentration parameter , reaching 100% for . For relaxed clusters (), we find a positive trend between and the BCG radio power, in the form P. Since is an indicator of the cool–core strength (t, e.g. Santos et al. santos08 (2008)), this trend suggests that the most powerful BCGs are located in the strongest cool–core clusters, indicating a clear connection between the AGN activity of the BCGs and the deposition of the cooling gas at the cluster centre (see also Mittal et al. mittal09 (2009)).
-
•
For the BCGs in relaxed clusters, there is only a weak correlation between the radio power of the BCGs and the core X–ray luminosity of the host cluster (within 0.15R500).
-
•
The fractional radio luminosity function differs for the BCGs in the two environments. In particular, the BCGs in relaxed clusters have an extremely high probability to be radio loud, i.e. almost 90%, to be compared to the 20–30% for those in relaxed clusters.
-
•
For a subset of our full sample (41%), optical spectra are available in the SDSS. 11/28 of those spectra show emission lines, and these are all radio–loud BCGs in relaxed clusters, 7 of them with a radio mini–halo.
Our study provides support for a strong link between the radio properties of BCGs and the dynamical state of the host cluster. We propose that our results reflect the AGN accretion mode of the BCGs. At least a fraction of the radio loud BCGs in relaxed clusters may be accreting cold gas from the central region of the host cool–core cluster. Such cold gas is certainly available for those radio galaxies in mini–halo clusters, as their optical spectra show, and it is most likely less abundant in BCGs in merging clusters, where the dominant accretion mode for the radio AGN may be due to accretion of hot gas from the IGM of the galaxy itself. Understanding how the cold gas in the central cluster regions is transported all the way through the galaxy in the nearest proximity of the black hole remains an open issue.
Acknowledgements.
We thank Prof. R. Fanti for the many insightful discussions. Thanks are due to S. Ettori for providing the routines we used for the X–ray data analysis and for the derivation of the cluster morphological parameters. R.K. and T.V. acknowledge partial support by PRIN-INAF 2008 and by FP7-People-2009 IRSES CAFEGroups project under grant agreement 247653. Funding for SDSS-III has been provided by the Alfred P. Sloan Foundation, the Participating Institutions, the National Science Foundation, and the U.S. Department of Energy Office of Science. The SDSS-III web site is http://www.sdss3.org/. SDSS-III is managed by the Astrophysical Research Consortium for the Participating Institutions of the SDSS-III Collaboration including the University of Arizona, the Brazilian Participation Group, Brookhaven National Laboratory, Carnegie Mellon University, University of Florida, the French Participation Group, the German Participation Group, Harvard University, the Instituto de Astrofisica de Canarias, the Michigan State/Notre Dame/JINA Participation Group, Johns Hopkins University, Lawrence Berkeley National Laboratory, Max Planck Institute for Astrophysics, Max Planck Institute for Extraterrestrial Physics, New Mexico State University, New York University, Ohio State University, Pennsylvania State University, University of Portsmouth, Princeton University, the Spanish Participation Group, University of Tokyo, University of Utah, Vanderbilt University, University of Virginia, University of Washington, and Yale University. This research has made use of the NASA/IPAC Extragalactic Database (NED) which is operated by the Jet Propulsion Laboratory, California Institute of Technology, under contract with the National Aeronautics and Space Administration.References
- (1) Ahn, C.P., Alexandroff, R., Allende P.C., et al., 2014, ApJS, 211, 17
- (2) Auriemma, C., Perola, G.C., Ekers, R.D., et al., 1977, A&A, 57, 41
- (3) Bacchi, M., Feretti, L., Giovannini, G., et al., 2003, A&A, 400, 465
- (4) Balmaverde, B., Baldi R.D., Capetti, A., 2008, A&A, 486, 119
- (5) Bardelli, S., Schinnerer, E., Smolčic, V., et al., 2010, A&A 511, A1
- (6) Best, P. N., Kauffmann, G., Heckman, T.M., et al., 2005, MNRAS, 362, 25
- (7) Best, P.N., von der Linden, A., Kauffmann, G., et al., 2007, MNRAS, 379, 894
- (8) Böhringer, H., Schuecker, P., Guzzo, L., et al., 2004, A&A, 425, 367
- (9) Buote, D.A., & Tsai, J.C., 1995, ApJ, 452, 522
- (10) Brentjens, M.A., 2011, A&A, 526, 9
- (11) Brown, S., & Rudnick, L., 2011, MNRAS, 412, 2
- (12) Brunetti, G., Giacintucci, S., Cassano, R., et al., 2008, Nature, 455, 944
- (13) Brunetti, G., & Jones, T.W., 2014, International Journal of Mod. Phys., Vol. 23, N. 4, p. 1430007
- (14) Burns,J.O., 1998, Science, 280, 400
- (15) Cassano, R., Ettori, S., Giacintucci, S., et al., 2010, ApJ, 721L, 82 (C10)
- (16) Cassano, R., Ettori, S., Brunetti, G., et al., 2013, ApJ, 777, 141 (C13)
- (17) Clarke, T.E., Sarazin, C.L., Blanton E.L., et al., 2005, ApJ, 625, 478
- (18) Clarke, T.E., Blanton, E.L., Sarazin, C.L., et al. 2009, ApJ, 697, 1481
- (19) de Gasperin, F., van Weeren, R. J., Brüggen, M., et al., 2014, MNRAS, 444, 3130
- (20) Donahue, M., Bruch, S., Wang, E., et al., 2010, ApJ, 715, 881
- (21) Dunn, R.J.H., & Fabian, A.C., 2008, MNRAS, 385, 757
- (22) Ebeling, H., Edge, A.,C., Böhringer, H., et al., 1998, MNRAS, 301, 881
- (23) Ebeling, H., Edge, A.C., Allen, S.W., et al., 2000, MNRAS, 318, 333
- (24) Edge, A.C., Oonk, J.B.R., Mittal, R., et al., 2010, A&A, 518L, 47E
- (25) Eilek, J.A., Burns, J.O., O’Dea, C.P., et al., 1984, ApJ, 278, 37
- (26) Fabian, A.C., Celotti, A., Blundell, K.M., et al., 2002, MNRAS, 331, 369
- (27) Fanaroff, B.L., & Riley, J.M., 1974, MNRAS, 167, 31
- (28) Feretti, L., Fusco-Femiano, R., Giovannini, G., et al., 2001, A&A, 373, 106
- (29) Feretti, L., & Venturi, T., in Merging Processes in Galaxt Clusters, 2002, Astrophys. and Space Science Lib., Kluwer Academic Publishers, Vol. 272, 163
- (30) Feretti, L., Schuecker, P., Böhringer, H., et al., 2005, A&A, 444, 157
- (31) Giacintucci, S., Venturi, T., Bardelli, S., et al., 2006, New Astr., 11, 437
- (32) Giacintucci, S., Venturi, T., Brunetti, G., et al., 2009, A&A, 505, 45
- (33) Giacintucci, S., O’Sullivan, E., Vrtilek, J., et al., 2011a, ApJ, 732, 95
- (34) Giacintucci, S., Markevitch, M., Brunetti, G., et al., 2011b, A&A, 525L, 10
- (35) Giacintucci, S., Dallacasa, D., Venturi, T., et al., 2011c, A&A, 534A, 57
- (36) Giacintucci, S., Markevitch, M., Venturi, T., et al., 2014, ApJ, 781, 9
- (37) Giles, P.A., Maughan, B.J., Birkinshaw, M., et al. 2012, MNRAS, 419, 503
- (38) Govoni, F., Feretti, L., Giovannini, G., et al., 2001, A&A, 376, 803
- (39) Haarsma, D.B., Leisman, L., Donahue, M., et al., 2010, ApJ, 713, 1037
- (40) Hardcastle, M.J., Evans, D.A., Croston, J.H., 2007, MNRAS, 376, 1849
- (41) Heckman, T.¡ & Best, P.N., 2014, ARA&A, 52, 589
- (42) Hoffer, A.S., Donahue, M., Hicks, A., et al., 2012, ApJS, 199, 23
- (43) Hudson, D.S., Mittal, T. Reiprich, T.H., et al., 2010, A&A, 513, A37
- (44) Hummel, E., 1981, A&A, 93, 93
- (45) Kale, R., Venturi, T., Giacintucci, S., et al., 2013, A&A, 557, 99 (K13)
- (46) Kale, R., Venturi, T., Giacintucci S., et al. 2015, A&A in press (arXiv:1503.02415v1) (K15)
- (47) Klein, U., Mack, K.-H., Gregorini, L., et al., 1995, A&A, 303, 427
- (48) Ledlow, M.J., & Owen, F.N., 1996, AJ, 112, 9
- (49) Lin, Y.-T., Brodwin, M., Gonzales, A.H., et al., 2013, ApJ,771, 61
- (50) Liu, F.S., Shude Mao, & Meng, X.M., 2012, MNRAS, 423, 422
- (51) Macario, G., Venturi, T., Brunetti, G., et al., 2010, A&A, 517A, 43
- (52) Mahdavi, A., Hoekstra, H., Babul, A., et al., 2007, ApJ, 668, 806
- (53) Mauch, T., & Sadler, E.M., 2007, MNRAS, 375, 931
- (54) Maurogordato, S., Cappi, A., Ferrari, C., et al., 2008 A&A, 481, 593
- (55) Mazzotta, P., & Giacintucci, S., 2008, ApJL, 675, 9
- (56) Mazzotta, P., Bourdin, H., Giacintucci, S., et al., 2011, Mem. Italian Astron. Society, 82, 495
- (57) McNamara, B.R., & Nulsen, P.E.J., 2007, ARA&A, 45, 117
- (58) McNamara, B.R., Nulsen, P.E.J., 2012, New Journal of Phys., Vol. 14, Issue 5, p. 5023
- (59) Mittal, R., Hudson, D.S., Reiprich, T.H., et al., 2009, A&A, 501, 835
- (60) Murgia, M., Govoni, F., Markevitch, M., et al., 2009, A&A, 499, 679
- (61) O’Dea, C.P., Baum, S.A., Privon, G., et al., 2008, ApJ, 681, 1035
- (62) O’Dea, K.P., Quillen, A.C., O’dea, C.P., et al., 2010, ApJ, 719, 1619
- (63) Ogrean, G.A., Hatch, N.A., Simionescu, A., et al., 2010, MNRAS, 406, 354
- (64) Orrú, E., Murgia, M., Feretti, L., et al., 2007, A&A, 467, 943
- (65) Owen, F.N., & Laing, R.A., 1989, MNRAS, 238, 357
- (66) Peterson, J., & Fabian, A.C., 2006, Phys. Rev., 407, 1
- (67) Poole, G.B., Faradal, M.A., Babul, A., et al., 2006, MNRAS, 373, 881
- (68) Quintana, H., & Lawrie, D.G., 1982, AJ, 87, 1
- (69) Reiprich, T.H., & Böhringer, H., 2002, ApJ, 567, 716
- (70) Santos, J.S., Rosati, P., Tozzi, P. et al., 2008, A&A, 483, 35
- (71) Sun, M., 2009, ApJ, 704, 1586
- (72) Valtchanov, I., Murphy, T., Pierre, M., 2002, A&A, 392, 795
- (73) Venturi, T., Giacintucci, S., Brunetti, G., et al., 2007, A&A, 463, 937 (V07)
- (74) Venturi, T., Giacintucci, S., Dallacasa, D., et al., 2008, A&A, 484, 327 (V08)
- (75) Venturi, T., Giacintucci, S., Dallacasa, D., et al., 2011, MNRAS, 414L, 65
- (76) Venturi, T., Giacintucci, S., Dallacasa, D., et al., 2013, A&A, 551A, 24
- (77) von der Linden, A., Best, P.N., Kauffmann, G., et al., 2007, MNRAS, 379, 867
- (78) ZuHone, J.A., Markevitch, M., Brunetti, G., et al., 2013, ApJ, 762, 78