Interplay of Electron and Nuclear Spin Noise in GaAs
Abstract
We present spin noise (SN) measurements on an ensemble of donor-bound electrons in ultrapure GaAs:Si covering temporal dynamics over six orders of magnitude from milliseconds to nanoseconds. The SN spectra detected at the donor-bound exciton transition show the multifaceted dynamical regime of the ubiquitous mutual electron and nuclear spin interaction typical for III-V based semiconductor systems. The experiment distinctly reveals the finite Overhauser-shift of an electron spin precession at zero external magnetic field and a second contribution around zero frequency stemming from the electron spin components parallel to the nuclear spin fluctuations. Moreover, at very low frequencies features related with time-dependent nuclear spin fluctuations are clearly resolved making it possible to study the intricate nuclear spin dynamics at zero and low magnetic fields. The findings are in agreement with the developed model of electron and nuclear SN.
pacs:
72.25.Rb, 72.70.+m, 78.47.db, 85.75.-dHarnessing coherence is one of the central topics in current research and attracts high interest due to the complex fundamental physics bridging quantum mechanics and statistics as well as due to prospective applications for information processing Awschalom et al. (2002); Devoret and Schoelkopf (2013); Leibfried et al. (2003). The solid state quantum states based upon the spin degree of freedom of confined carriers in semiconductors are at the forefront of many current research activities in this field. In this respect, optically addressable electron and hole spin quantum states in III-V based semiconductor systems bear the beauty of efficient options for initialization, manipulation, and readout by light in combination with exceptional sample quality Urbaszek et al. (2013). Currently, a promising system for these tasks are donor-bound electrons in ultrahigh quality, very weakly -doped GaAs since the widely spaced, quasi-isolated electrons act as an ensemble of identical, individually localized atoms Sladkov et al. (2010); Fu et al. (2008). However, the ostensible catch of this approach is the inherent interaction with the nuclear spin bath which has been addressed in many different systems so far Merkulov et al. (2002); Khaetskii et al. (2002); Faribault and Schuricht (2013); Braun et al. (2005); Dou et al. (2011).
In principle, there are different approaches to deal with the decoherence imposed via the hyperfine interaction. On the first sight, the most obvious way is to replace the isotopes carrying a nuclear spin with spinless isotopes like in 28Si Morley et al. (2010) but silicon has the drawback of an indirect gap. Direct semiconductors with spinless isotopes like, e.g., isotopically purified II-VI systems have yet the drawback of inferior sample quality. In single III-V based quantum dots, the hyperfine interaction can be reduced by either moving on to hole spins which show a diminished hyperfine interaction Brunner et al. (2009); Chekhovich et al. (2013); Dahbashi et al. (2014) or by polarizing the nuclei in order to make them less effective Sallen et al. (2014); Smirnov (2015). Besides that, the mutual interaction between carrier and nuclear spins is also strain dependent and strongly varying coupling strengths in such nanostructures result in a row of widely discussed problems with the central spin problem being one of the most prominent and complex examples Sinitsyn et al. (2012); Faribault and Schuricht (2013). By contrast, donor-bound electrons in high purity bulk GaAs have an isotropic, well defined hyperfine interaction in a strain free environment, in which case an in-depth understanding and exploitation of the generic electron and nuclear spin dynamics looks feasible.
Measurements of the intrinsic spin dynamics of weakly interacting donor-bound electrons in bulk GaAs are extremely challenging since any optical excitation of free electrons or holes dramatically affects their spin dynamics. One reason is the slow cooling time of free carriers at low lattice temperatures. The Hanle effect Dzhioev et al. (2002) and the resonant spin amplification technique Kikkawa and Awschalom (1998) yield long spin relaxation times of resident electrons, however, these experiments involve considerable optical excitation of the sample. Here, we avoid the problem of optical excitation of free carriers by utilizing spin noise spectroscopy. This quantum optical method Aleksandrov and Zapasskii (1981); Oestreich et al. (2005); Crooker et al. (2009); Hübner et al. (2014); Li et al. (2012) based on spectral analysis of fluctuations in the polarization state of the laser light transmitted through the sample is a matchless tool for this task since the technique measures the spin dynamics at thermal equilibrium practically perturbation-less, and provides a complete picture of the involved spin dynamics of both the electrons and the host lattice nuclei on time scales spanning from nanoseconds to milliseconds, respectively.
The sample under study is a m thick, very high purity GaAs layer grown by molecular beam epitaxy (MBE) on top of a semi-insulating GaAs substrate separated by a GaAs/AlAs superlattice and an AlAs etch stop buffer layer. The intentional n-type doping density of the GaAs:Si layer is cm-3 which yields an average distance between two neighboring Si-donors of about 20 Bohr-radii. The hydrogen-like wavefunction of each localized electron overlaps with host lattice nuclear magnetic moments leading to the contact hyperfine interaction Abragam (2006). A via-hole with diameter m is wet chemical etched through the backside of the sample etc to gain unobstructed optical access to the MBE-grown GaAs for transmission measurements.
The sample is mounted in a cold finger cryostat and cooled down to temperatures between K and K. An electro-magnet is used to apply transverse magnetic fields up to mT with respect to the direction of light propagation. Linearly polarized laser light is focused to a beam-waist of m and tuned quasi–resonantly to the donor-bound exciton () transition at meV showing an inhomogeneous broadening with a full width at half maximum (FWHM) of eV measured by absorption spectroscopy. The spin induced stochastic Faraday rotation (spin noise) of the transmitted laser light is resolved by a polarization bridge and a low-noise balanced photo receiver. The noise background due to optical and electronic noise is eliminated by subtracting SN spectra with different transverse magnetic field from each other Müller et al. (2010); sup .
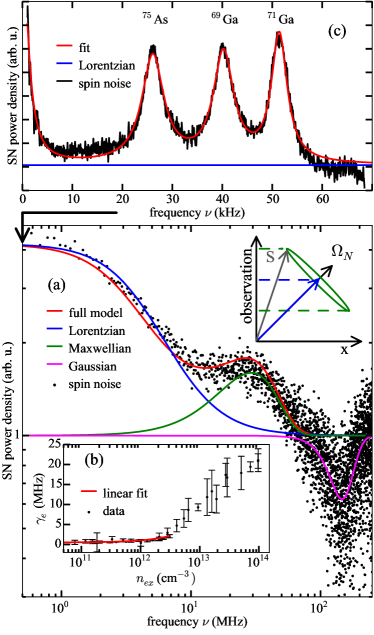
Figure 1 shows the measured spin noise spectra in the frequency range from 1 kHz to 250 MHz. First, we focus on the SN power density between 0.6 MHz and 250 MHz (Fig. 1a, black dots) which clearly consists of three contributions. The depicted spectrum is the difference of SN spectra acquired at mT and mT, respectively 111The difference spectrum is normalized to the maximum SN density and shifted by 1 for presentation on logarithmic scale.. First, we focus on the contributions measured at zero external magnetic field which are centered at and at MHz. The peak at arises from electron spin precession in the quasi-static field of nuclear fluctuations, i.e. from the precession in the randomly distributed Overhauser fields Merkulov et al. (2002) (see pictogram in Fig. 1): Their random distribution at different donor sites results in a Maxwell-like SN shape Glazov and Ivchenko (2012); Glazov (2015) (Fig. 1a, green line). Here, is the respective noise power nor , and results from the dispersion of the nuclear fields as , where is the electron -factor. The feature arises from the electron spin component parallel to , which is conserved in the course of fast electron spin precession (pictogram in Fig. 1) Merkulov et al. (2002); Glazov and Ivchenko (2012). This contribution is approximated by a Lorentzian shape (blue line in Fig. 1a) i.e., nor with being the damping related to a finite electron correlation at a given donor Glazov (2015) and to spin-flip processes not related to hyperfine interaction Glazov and Ivchenko (2012). Such a specific two-peak structure is a distinct feature of the SN of localized electrons coupled to lattice moments and, moreover, the simultaneous presence of both contributions in the zero field spectrum clearly demonstrates that the correlation time is long, i.e., Glazov (2015).
The feature at about MHz results from the Larmor precession of the stochastically oriented electron spin ensemble in the effective magnetic field given by the sum of the local hyperfine fields and the applied transverse magnetic field. In agreement with Refs. Glazov and Ivchenko (2012); Glazov (2015) this feature is well approximated by a Gaussian function shown as magenta line in Fig. 1a. Here, is the SN power of the precession contribution, is the Larmor-frequency, and is the spread of the spin precession frequencies caused by nuclear fields and -factor variations, see below. Glazov and Ivchenko (2012) By fitting to the data, an electron -factor of err is extracted in agreement with expectations for donor-bound electrons in GaAs. Fu et al. (2005)
| type | rel. noise power (arb. u.) | rate (MHz) |
|---|---|---|
| Lorentzian | ||
| Maxwell | ||
| Gaussian |
∗ reduces to MHz for negligible excitation density.
All extracted fit parameters are summarized in Table 1. The consistency is demonstrated by the general conservation of SN power: , which describes the redistribution of SN power from the Larmor precession peak at towards the two-peak structure at . However, the width of the precession peak at is increased by about compared to the Overhauser contribution which is attributed to an electric field dependent -factor inh ; poi , see Ref. sup .
Interestingly, the power ratio of the homogeneous and the Overhauser contribution deviates strongly from the expected ratio Glazov and Ivchenko (2012); Glazov (2015) and is caused by a finite value of the electron correlation time at a given donor: Overall, the two features are very well modeled after Eqs. (6) and (9) of Ref. Glazov (2015) including (i) spin precession in the random hyperfine fields and (ii) the finite correlation time . The model (red curve in Fig. 1a) is fitted to the data with and being the only parameters and allows to extract the nuclear field spread MHz. This corresponds to mT, which is in close agreement with other experimental data Dzhioev et al. (2002); Colton et al. (2004) as well as with the value extracted from the Maxwellian fit. The correlation time of ns is very close to the value reported in Ref. Dzhioev et al. (2002) for a comparable electron density. The Lorentizan fit of the zero-frequency peak gives a similar value of ns. Nevertheless, all correlation times are mainly limited by optical excitation as discussed in the next paragraph.
In order to gain further insight into the electron SN, the dependence of the noise power of the zero-frequency component on the photo-generated excitation density is measured by reducing the bandwidth of the used detector. This allows to accumulate SN at very low optical powers. The excitation density is calculated via from the experimental parameters ( is the laser energy, is the layer thickness, is the optical power incident on the sample) assuming a peak absorption coefficient of the donor electron ensemble and a radiative lifetime of ns Finkman et al. (1986). The measured data are fitted by the Lorentzian function and the resulting dependence is depicted in Fig 1b over more than three orders of magnitude. The extrapolation towards yields a value of MHz corresponding to a correlation/spin relaxation time of about 320 ns. This time is comparable with the nuclear spin precession time in the Knight-field of the electron. sup
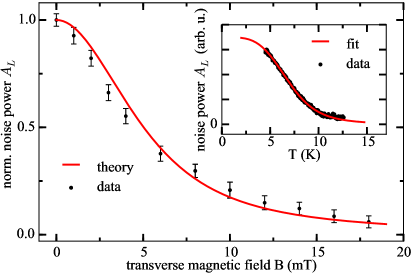
The measured noise power of the zero-frequency SN contribution as a function of the transverse magnetic field is plotted in Fig. 2 (black dots) showing clearly the expected reduction of the zero frequency peak. Glazov and Ivchenko (2012) The red line is calculated after Eq. (13) of Ref. Glazov and Ivchenko (2012) with the same parameters as used to fit the SN spectrum in Fig. 1 and shows an excellent agreement. The inset of Fig. 2 depicts the SN power of the zero-frequency contribution as a function of the cryostat temperature. The experimentally observed SN (black dots) reduces drastically with increasing temperature due to thermal ionization of the donors. The red line is a fit according to Blakemore’s equation with the two free parameters being the doping density and a temperature offset between the sensor at the heat exchanger of the cryostat and the laser spot Blakemore (1987). The extracted offset is K, being typical for our cryostat configuration. However, the extracted doping density of cm-3 is much lower than the nominal doping density. The origin of this discrepancy is not fully understood but could be related with unintentional -type co-doping (compensation) and donor depletion due to surface charges.
Now we focus on the very low frequency range kHz kHz. Here, the SN spectrum reveals a clearly resolved fine structure shown in Fig. 1c acquired at a transverse field mT, where three additional, very narrow spin noise peaks at finite frequencies are resolved. These peaks shift linearly for mT, see Fig. 3, and their origin is identified by the corresponding magnetic moments as the host lattice isotopes 75As, 69Ga, and 71Ga. sup Interestingly, the relative magnitudes of the nuclear SN do not scale with the different abundance and coupling strengths Paget et al. (1977) of the isotopes. The origin is unclear so far. By fitting the corresponding contributions by Lorentzians (red line in Fig. 1c), we extract a ratio of the nuclear SN power for all host lattice isotopes to the zero-frequency electron SN power contribution . sup
The observation of nuclear SN in the FR noise spectrum is, at first glance, very surprising, since lattice nuclear spins do not couple directly with light. However, nuclear spin fluctuations affect via hyperfine interaction the electron spin degrees of freedom and manifest them-self in the optical response Artemova and Merkulov (1985); Giri et al. (2013). Particularly, for bulk semiconductors with donor-bound electrons there are two contributions to nuclei-induced Faraday rotation: (i) the Overhauser field induced splitting of the transition line, which is temperature independent, and (ii) a state-filling effect caused by the electron spin polarization in the Overhauser field, which depends on temperature Giri et al. (2013). The straightforward calculation sup shows that the nuclear fluctuation-induced splitting dominates the SN for quasi-resonant detection in an inhomogeneously broadened transition and that the ratio of the nuclei and electron spin noise powers is given by . Here, eV is the nuclear spin noise induced energetic fluctuation of the line and is the homogeneous width of the resonance. Taking eV Oohashi et al. (1996) we estimate sup which is in rather good agreement with the experimentally observed value. This ratio is temperature independent in the studied range between K and K.
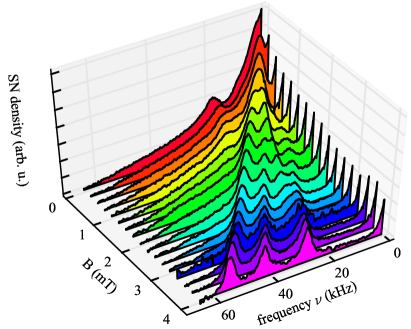
The detection of nuclear spontaneous spin resonance by spin noise spectroscopy provides the novel method that enables measurements of the nuclear spin dynamics without exciting a nuclear spin polarization Ryzhov et al. , applying strong external magnetic fields to split the nuclear spin sublevels, or using radio frequency pulses like in NMR/ODNMR experiments. The suggested technique is particularly useful to address the nuclear spin dynamics at low magnetic fields unaccessible otherwise. Particularly, at mT we reveal complex behavior of nuclear spin resonance lines with strong deviations from linear-in- dependence. These deviations, as well as the appearance of the zero-frequency line in the nuclear SN spectra can be related with small quadrupolar splittings, local fields and intricate nuclear spin decoherence Bechtold et al. , see Ref. sup for details, and require further in-depth studies.
In summary, detailed spin noise measurements on the neutral exciton transition of nearly isolated, localized donor electrons in GaAs yield a comprehensive picture of the intricate electron and nuclear spins at thermal equilibrium including (a) the homogeneous and Overhauser SN contribution at , (b) the influence of the correlation time on their shape and relative noise powers, (c) the temperature dependence of the ionization of a low-density electron ensemble, (d) the inhomogeneous broadening of the Overhauser contribution at finite external magnetic fields due to electron -factor variations, and (e) the observation of nuclear fluctuations by optical spin noise spectroscopy and their intricate magnetic field dependence. Especially, the new nuclear SN technique gives an inimitable access to the nuclear spin dynamics at thermal equilibrium and very low external magnetic fields and promises a variety of applications, i.e., for highly sensitive spatially resolved nuclear magnetic resonance.
Acknowledgements.
We acknowledge the financial support by the BMBF joint research project Q.com-Halbleiter (16KIS0109 and 16KIS00107) and the Deutsche Forschungsgemeinschaft (TRR160 and OE 177/10-1). MMG is grateful to the Dynasty Foundation, RFBR, RF President grant MD-5726.2015.2, Russian Ministry of Education and Science (Contract No. 11.G34.31.0067), and SPbSU Grant No. 11.38.277.2014.References
- Awschalom et al. (2002) D. D. Awschalom, D. Loss, N. Samarth, P. Avouris, K. von Klitzing, H. Sakaki, and R. Wiesendanger, eds., Semiconductor Spintronics and Quantum Computation, NanoScience and Technology (Springer Berlin Heidelberg, Berlin, Heidelberg, 2002).
- Devoret and Schoelkopf (2013) M. H. Devoret and R. J. Schoelkopf, Science 339, 1169 (2013).
- Leibfried et al. (2003) D. Leibfried, R. Blatt, C. Monroe, and D. Wineland, Reviews of Modern Physics 75, 281 (2003).
- Urbaszek et al. (2013) B. Urbaszek, X. Marie, T. Amand, O. Krebs, P. Voisin, P. Maletinsky, A. Högele, and A. Imamoglu, Rev. Mod. Phys. 85, 79 (2013).
- Sladkov et al. (2010) M. Sladkov, A. U. Chaubal, M. P. Bakker, A. R. Onur, D. Reuter, A. D. Wieck, and C. H. van der Wal, Phys. Rev. B 82, 121308 (2010).
- Fu et al. (2008) K.-M. C. Fu, S. M. Clark, C. Santori, C. R. Stanley, M. C. Holland, and Y. Yamamoto, Nat Phys 4, 780 (2008).
- Merkulov et al. (2002) I. A. Merkulov, A. L. Efros, and M. Rosen, Physical Review B 65, 205309 (2002).
- Khaetskii et al. (2002) A. V. Khaetskii, D. Loss, and L. Glazman, Phys. Rev. Lett. 88, 186802 (2002).
- Faribault and Schuricht (2013) A. Faribault and D. Schuricht, Phys. Rev. B 88, 085323 (2013).
- Braun et al. (2005) P.-F. Braun, X. Marie, L. Lombez, B. Urbaszek, T. Amand, P. Renucci, V. K. Kalevich, K. V. Kavokin, O. Krebs, P. Voisin, and Y. Masumoto, Phys. Rev. Lett. 94, 116601 (2005).
- Dou et al. (2011) X. M. Dou, B. Q. Sun, D. S. Jiang, H. Q. Ni, and Z. C. Niu, Phys. Rev. B 84, 033302 (2011).
- Morley et al. (2010) G. W. Morley, M. Warner, A. M. Stoneham, P. T. Greenland, J. van Tol, C. W. M. Kay, and G. Aeppli, Nature Materials 9, 725 (2010).
- Brunner et al. (2009) D. Brunner, B. D. Gerardot, P. A. Dalgarno, G. Wüst, K. Karrai, N. G. Stoltz, P. M. Petroff, and R. J. Warburton, Science 325, 70 (2009).
- Chekhovich et al. (2013) E. A. Chekhovich, M. M. Glazov, A. B. Krysa, M. Hopkinson, P. Senellart, A. Lemaitre, M. S. Skolnick, and A. I. Tartakovskii, Nat Phys 9, 74 (2013).
- Dahbashi et al. (2014) R. Dahbashi, J. Hübner, F. Berski, K. Pierz, and M. Oestreich, Phys. Rev. Lett. 112, 156601 (2014).
- Sallen et al. (2014) G. Sallen, S. Kunz, T. Amand, L. Bouet, T. Kuroda, T. Mano, D. Paget, O. Krebs, X. Marie, K. Sakoda, and B. Urbaszek, Nat. Commun. 5 (2014).
- Smirnov (2015) D. S. Smirnov, Phys. Rev. B 91, 205301 (2015).
- Sinitsyn et al. (2012) N. A. Sinitsyn, Y. Li, S. A. Crooker, A. Saxena, and D. L. Smith, Phys. Rev. Lett. 109, 166605 (2012).
- Dzhioev et al. (2002) R. I. Dzhioev, K. V. Kavokin, V. L. Korenev, M. V. Lazarev, B. Y. Meltser, M. N. Stepanova, B. P. Zakharchenya, D. Gammon, and D. S. Katzer, Phys. Rev. B 66, 245204 (2002).
- Kikkawa and Awschalom (1998) J. M. Kikkawa and D. D. Awschalom, Phys. Rev. Lett. 80, 4313 (1998).
- Aleksandrov and Zapasskii (1981) E. B. Aleksandrov and V. S. Zapasskii, Zh. Eksp. Teor. Fiz 81, 132 (1981).
- Oestreich et al. (2005) M. Oestreich, M. Römer, R. J. Haug, and D. Hägele, Physical Review Letters 95, 216603 (2005).
- Crooker et al. (2009) S. A. Crooker, L. Cheng, and D. L. Smith, Phys. Rev. B 79, 035208 (2009).
- Hübner et al. (2014) J. Hübner, F. Berski, R. Dahbashi, and M. Oestreich, physica status solidi (b) 251, 1824 (2014).
- Li et al. (2012) Y. Li, N. Sinitsyn, D. L. Smith, D. Reuter, A. D. Wieck, D. R. Yakovlev, M. Bayer, and S. A. Crooker, Physical Review Letters 108, 186603 (2012).
- Glazov (2015) M. M. Glazov, Physical Review B 91, 195301 (2015).
- Abragam (2006) A. Abragam, The principles of nuclear magnetism, reprinted. ed., The international series of monographs on physics (Oxford Univ. Press, Oxford, 2006).
- (28) A mixture of /, followed by citric acid/ and diluted HF to selectively etch the GaAs substrate and the hindering layers is used Clawson (2001) and results in a surface roughnes .
- Müller et al. (2010) G. M. Müller, M. Oestreich, M. Römer, and J. Hübner, Physica E: Low-dimensional Systems and Nanostructures 43, 569 (2010).
- (30) See Supplementary Materials for details.
- Note (1) The difference spectrum is normalized to the maximum SN density and shifted by 1 for presentation on logarithmic scale.
- Glazov and Ivchenko (2012) M. M. Glazov and E. L. Ivchenko, Physical Review B 86, 115308 (2012).
- (33) The constants , and represent the half of the SN power, since SN spectra are symmetric with replacement.
- (34) The main error results from the uncertainty in the distance between the probe volume and the coils of the electro-magnet, i.e., from the uncertainty of the absolute value of the magnetic field at the probe volume.
- Fu et al. (2005) K.-M. C. Fu, C. Santori, C. Stanley, M. C. Holland, and Y. Yamamoto, Phys. Rev. Lett. 95, 187405 (2005).
- (36) The inhomogeneity of varies in the small probe volume only by .
- (37) By solving Poisson’s equation a depletion zone of m at both surfaces due to Fermi mid-gap level pinning and an electric field of is estimated. The measured g-factor modification compares very well to Fig. 2a in Reference De et al. (2009) where this modification is caused by spreading the impurity wave function into a region with lower overall potential.
- Colton et al. (2004) J. S. Colton, T. A. Kennedy, A. S. Bracker, J. B. Miller, and D. Gammon, Solid State Communications 132, 613 (2004).
- Finkman et al. (1986) E. Finkman, M. D. Sturge, and R. Bhat, Journal of Luminescence 35, 235 (1986).
- Blakemore (1987) J. S. Blakemore, Semiconductor statistics, reprint. ed., Dover books on physics and chemistry (Dover Publ., New York, 1987).
- Paget et al. (1977) D. Paget, G. Lampel, B. Sapoval, and V. I. Safarov, Phys. Rev. B 15, 5780 (1977).
- Artemova and Merkulov (1985) E. S. Artemova and I. A. Merkulov, Sov. Phys. Solid State 27, 941 (1985).
- Giri et al. (2013) R. Giri, S. Cronenberger, M. M. Glazov, K. V. Kavokin, A. Lemaître, J. Bloch, M. Vladimirova, and D. Scalbert, Phys. Rev. Lett. 111, 087603 (2013).
- Oohashi et al. (1996) H. Oohashi, H. Ando, and H. Kanbe, Phys. Rev. B 54, 4702 (1996).
- (45) I. I. Ryzhov, S. V. Poltavtsev, K. V. Kavokin, M. M. Glazov, G. G. Kozlov, M. Vladimirova, D. Scalbert, S. Cronenberger, A. V. Kavokin, A. Lemaître, J. Bloch, and V. S. Zapasskii, arXiv:1504.00799 .
- (46) A. Bechtold, D. Rauch, F. Li, T. Simmet, P.-L. Ardelt, A. Regler, K. Müller, N. A. Sinitsyn, and J. J. Finley, arXiv:1410.4316 .
- Clawson (2001) A. R. Clawson, Materials Science and Engineering: R: Reports 31, 1 (2001).
- De et al. (2009) A. De, C. E. Pryor, and M. E. Flatté, Physical Review Letters 102, 017603 (2009).