MULTI-WAVELENGTH LIGHT CURVE MODEL OF THE ONE-YEAR RECURRENCE PERIOD NOVA M31N 2008-12A
Abstract
We present a theoretical light curve model of the recurrent nova M31N 2008-12a, the current record holder for the shortest recurrence period (1 yr). We combined interior structures calculated using a Henyey-type evolution code with optically thick wind solutions of hydrogen-rich envelopes, which give the proper mass-loss rates, photospheric temperatures, and luminosities. The light curve model is calculated for a 1.38 white dwarf (WD) with an accretion rate of yr-1. This model shows a very high effective temperature ( (K) ) and a very small wind mass-loss rate ( yr-1) even at the maximum expansion of the photosphere. These properties are consistent with the faint optical peak of M31N 2008-12a because the brightness of the free–free emission is proportional to the square of the mass-loss rate. The model well reproduces the short supersoft X-ray turn-on time of 6 days and turnoff time of 18 days after the outburst. The ejecta mass of our model is calculated to be , corresponding to 37% of the accreted mass. The growth rate of the WD is 0.63 times the mass accretion rate, making it a progenitor for a Type Ia supernova. Our light curve model predicts a bright supersoft X-ray phase one or two days before the optical peak. We encourage detection of this X-ray flash in future outbursts.
Subject headings:
novae, cataclysmic variables - stars: individual (M31N 2008-12a) - supernovae: general - white dwarfs - X-rays: binaries1. INTRODUCTION
A nova is a thermonuclear runaway event on a mass-accreting white dwarf (WD) in a binary. When hydrogen burning sets in, the envelope of the WD greatly expands, and the WD becomes bright in the optical band. Wind mass-loss begins, carrying away part of the envelope mass. After the optical maximum, the photosphere moves inward, and the main emitting wavelength region of photons shifts to a shorter wavelength region. Subsequently, the WD becomes a supersoft X-ray source (SSS), and the SSS phase continues until the end of hydrogen burning.
The recent discovery of the yr recurrence period nova M31N 2008-12a has drawn attention to novae of short recurrence periods (Darnley et al., 2014, 2015; Henze et al., 2014, 2015; Tang et al., 2014). Recurrent novae are binaries harboring a massive WD. One-year recurrence periods occur for very massive WDs of and very high mass accretion rates of yr-1 (Prialnik & Kovetz, 1995; Wolf et al., 2013; Tang et al., 2014; Kato et al., 2014). Such massive WDs are considered to be among the candidates for Type Ia supernova (SN Ia) progenitors (Hachisu et al., 1999a, b; Hachisu & Kato, 2001; Hachisu et al., 2010; Han & Podsiadlowski, 2004; Li & van den Heuvel, 1997; Kato & Hachisu, 2012). SNe Ia play an important role in astrophysics as a standard candle for measuring cosmological distances, and as the main producers of iron group elements in the chemical evolution of galaxies. However, their immediate progenitors remain elusive. The current debate centers on the single degenerate (SD) versus double degenerate (DD) scenarios (e.g., Maoz et al., 2014; Pagnotta & Schaefer, 2014). In SD scenarios (e.g., Hachisu et al., 1999a, b; Kato & Hachisu, 2012), very short recurrence periods in novae indicate the final stages before an SN Ia explosion. The recurrent nova M31N 2008-12a has a recurrence period of one year, the shortest on record, and is thus considered to be an immediate progenitor. The detailed properties of an immediate progenitor could shed new light on the debate between DD and SD scenarios. Thus, theoretical and observational studies of M31N 2008-12a are very important.
In the last outburst of M31N 2008-12a in October 2014, unprecedented observational data were obtained, including the optical rising phase, X-ray turn-on time (), and X-ray turnoff time () (Darnley et al., 2015; Henze et al., 2015). The nova exhibits a faint optical peak, which is 1–2 mag fainter than the galactic recurrent novae U Sco, whose recurrence time is 8–20 yr and RS Oph whose recurrence time is 10–20 yr, and has a very short X-ray turn-on time ( days after the outburst), followed by a supersoft X-ray phase of 12 days with a high effective temperature of up to eV (a blackbody fit of the Swift XRT spectrum by Henze et al. (2015)). The X-ray turnoff time is days. All of these characteristics indicate a very massive WD.
2. DURATION OF SUPERSOFT X-RAY PHASE
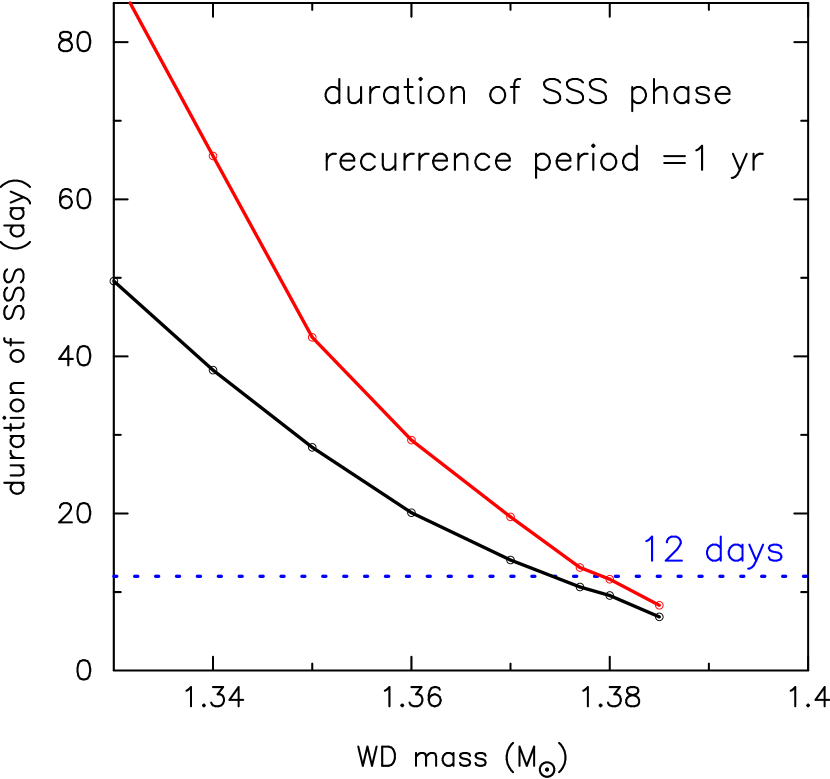
In an SSS phase, the envelope on the WD is geometrically thin, and in hydrostatic balance. This phase is well represented by a sequence of hydrostatic solutions (e.g., Kato & Hachisu, 1994; Sala & Hernanz, 2005). We calculated the duration of the SSS phase for the WD masses, 1.33, 1.34, 1.35, 1.36, 1.37, 1.377, 1.38, and 1.385 . The chemical composition of the envelope is assumed to be uniform in space and constant in time, but to have a linear dependence on the WD mass, i.e., for , and for with , the value of which are taken from Kato et al. (2014). We also include the so-called gravitational energy release, which amounts to 10% of the photospheric luminosity. Figure 1 shows the duration of the SSS phase, with the time between the X-ray turn-on and turnoff times defined as the epoch when the optically thick winds stop, and the epoch when hydrogen burning is extinguished, respectively (Kato & Hachisu, 1994; Hachisu and Kato, 2010).
If the accretion disk is not destroyed because of very weak winds, the accretion may resume soon after the winds stop. In this case, we have a longer duration of the SSS phase because additional nuclear fuel (hydrogen) is being supplied. The red line in Figure 1 represents the SSS duration in the presence of accretion, the rates of which are taken from those of one-year recurrence period novae (Kato et al., 2014), e.g., yr-1 for 1.38 , yr-1 for 1.35 , and yr-1 for 1.33 .
This accretion effect is more significant in the 1.33 WD than in more massive WDs because the accretion rate is close to the steady hydrogen burning rate in the 1.33 WD, but much smaller in the 1.385 WD. From this figure, we conclude that the nova M31N 2008-12a ( days) harbors a very massive WD, (as massive as ) in cases both with and without accretion in the SSS phase.
3. LIGHT CURVE MODEL
We calculated nova outbursts on the WD accreting hydrogen-rich matter (, and for hydrogen, helium, and heavy elements, respectively) at a rate of yr-1. We calculated eight cycles until the flash reaches the limit cycle using the same Henyey-type code as used by Kato et al. (2014). The recurrence period of flashes is 1.07 yr. During the shell flash, the photospheric radius (as well as the luminosity) increases, and the temperature decreases beyond the peak of OPAL opacities ( (K) , Iglesias & Rogers, 1996). This triggers wind mass loss. In such a stage, we adopt the optically thick wind solutions (Kato & Hachisu, 1994) as the surface boundary condition. The wide band spectrum–energy distribution of the 2014 outburst of M31N 2008-12a showed flat spectra (see Figure 11 of Darnley et al., 2015). This means that the spectrum is of free–free emission. The optical and ultraviolet (UV) light curves are calculated using the wind mass-loss rate, photospheric radius, and velocity, assuming free–free emission (Equation (2) in Hachisu et al., 2008; Hachisu and Kato, 2010). The absolute flux of the free–free emission is determined from the distance and extinction to M31. After the optically thick winds stop, the envelope structure approaches that of hydrostatic balance. The X-ray light curve is calculated assuming a blackbody emission for the photospheric temperature and luminosity of the envelope. We stopped the accretion during the wind phase and restarted it at the beginning of the SSS phase.
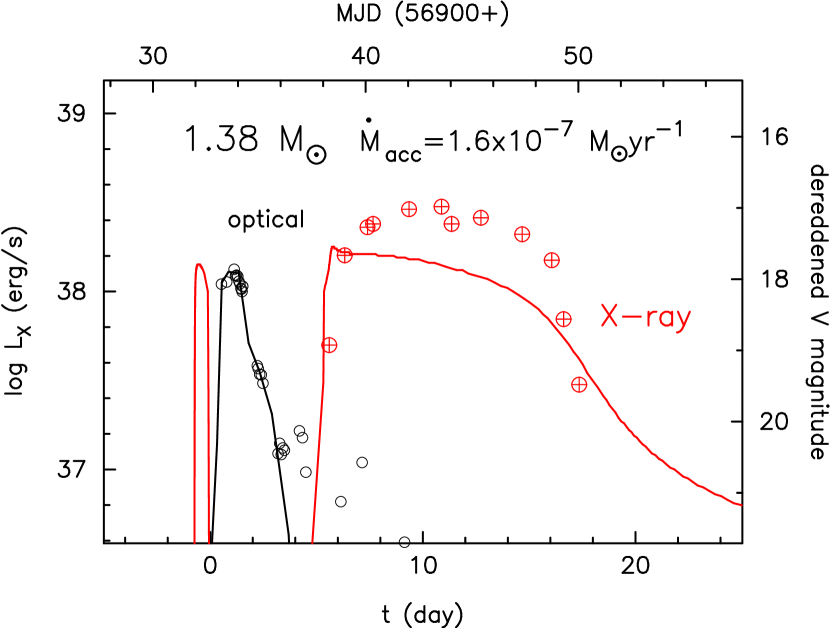
Figure 2 shows our multi-wavelength light curves. The solid red lines represent the theoretical supersoft X-ray flux (0.2–1 keV). In the very early phase of the outburst, the photospheric temperature increases, keeping the radius almost constant up to (K) = 6.1, then decreases with expansion. Thus, we have a short X-ray bright phase (X-ray flash) one or two days before the optical peak.
After the envelope expands, the optically thick wind begins to blow, and lasts for 5.4 days. The black line in Figure 2 is the optical brightness calculated on the basis of free–free emission. The brightness reaches its maximum at the maximum expansion of the photosphere, when the photospheric temperature reaches its minimum, although as high as (K) = 4.97, the wind mass-loss rate attains its maximum at yr-1. This mass-loss rate is much smaller than that of typical classical novae (Kato & Hachisu, 1994), which explains the faint optical peak of M31N 2008-12a (See Figure 36 in Hachisu & Kato, 2015) because the brightness of the free–free emission is proportional to the square of the mass-loss rate. The internal structure of the winds is essentially the same as in Kato & Hachisu (1994). After the optical maximum, the flux of free–free emission decays quickly as the wind-mass loss rate decreases.
Our optical light curve well reproduces the observed magnitude light curve in the first three days, as shown in Figure 2, where the data are taken from Table 6 in Darnley et al. (2015). We assumed an absorption of , where we adopt the hydrogen column density cm-2 (Henze et al., 2014, 2015) and the relationship cm-2 (Güver & Özel, 2009).
After day 3, the observed optical magnitude decays much more slowly than the theoretical light curve. These excess fluxes could not come from either the free–free emission, because the wind has already stopped, or from the photospheric blackbody emission, because its temperature is too high to emit at the optical bands. They could be an indication of the beginning of a nebular phase, that is, the contribution of strong emission lines (see, e.g., Hachisu and Kato, 2010) or of a plateau phase, as observed in other recurrent novae, i.e., emission from an irradiated disk, such as in U Sco (Hachisu et al., 2000a) and RS Oph (Hachisu et al., 2006).
After day 5, the photospheric temperature increases enough to emit X-rays, and the nova enters an SSS phase. Our theoretical light curve of the supersoft X-ray band well reproduces the observed X-ray turn-on and turnoff times. The theoretical temperature rises to (K) = 6.16 (i.e., 125 eV), consistent with eV obtained from a blackbody fit of the Swift XRT spectrum (Henze et al., 2015).
4. DISCUSSION AND CONCLUSIONS
Our light curve model predicts a bright X-ray phase before the optical maximum. In our model, the X-ray flash begins at day (i.e., 1.85 days before the optical peak at days) and lasts 0.64 days, as shown in Figure 2. Here, we regard the X-ray phase as the time the X-ray luminosity spends above erg s-1 (based on the blackbody luminosities in Henze et al. (2015)). The evolution time is longer in less massive WDs, and so is the duration of the X-ray flash. For a WD with a mass accretion rate of yr-1, the X-ray flash starts 7.0 days before the optical maximum, and lasts 1.4 days. The timescale may also depend on other quantities, such as the mass accretion rate and chemical composition of the accreted matter. However, our estimate of an X-ray flash of day duration starting days before the optical maximum is robust unless the duration of the SSS phase after the optical peak is changing.
The mass lost in the wind phase is calculated to be . This value is very small compared with those of typical classical novae (–). The accreted matter is . Thus, the lost mass amounts to 37% of the accreted matter. The mass accumulation efficiency is in our 1.38 WD.
In our calculation, the ejecta is hydrogen-rich, with . This small decrease in from the initial value of to is caused by convective mixing in the very early phase of the shell flash. Henze et al. (2015) estimated the ejected hydrogen mass to be . Considering the hydrogen content of , our value of () is roughly consistent with the observational estimate. Darnley et al. (2015) derived a total ejected mass of based on the observed deceleration of the ejecta and a comparison to RS Oph. Our value is also consistent with this estimate.
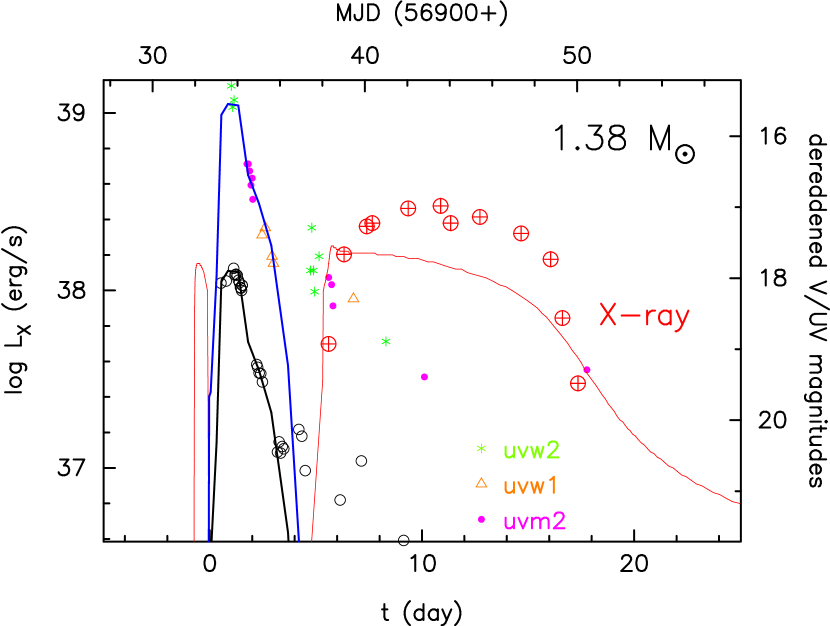
M31N 2008-12a was very bright in the UV bands in the optically bright phase, as shown in Figure 3. We suggest that these UV fluxes are free–free emission from the ejecta just outside the photosphere, based on the following. The first reason is the wide-band spectrum–energy–distribution (Darnley et al., 2015), which is consistent with free–free emission, not only in the V band, but also in these UV bands. The second reason is the light curve shape. The blue line in Figure 3 has the same shape as the black line, but is shifted up by 2.35 mag. This blue line shows good agreement with the UV data, although the three UV bands, , , and , have different band-passes. If free–free emission dominates the spectrum, these light curves should have the same shape (e.g., Hachisu & Kato, 2006, 2015). This agreement strongly indicates that the UV emission is free–free emission. The third reason is that these strong UV fluxes cannot be explained by photospheric blackbody emission, which is as small as erg s-1 for the band at (K) (maximum expansion of the photosphere). In future outbursts, we encourage high cadence UV observation to confirm the wavelength-independent shape of the light curve.
Our main results are summarized as follows.
-
1.
We calculated the duration of the supersoft X-ray phase of novae of one-year recurrence periods for various WD masses. The duration of 12 days suggests that the recurrent nova M31N 2008-12a harbors a WD as massive as . This value is close to the upper limit of the mass-accreting WD because the mass-accreting WDs have a hot core, and the upper limit is less than the Chandrasekhar mass limit (e.g., Nomoto, 1982).
-
2.
We modeled the M31N 2008-12a outbursts as a nova outburst on a 1.38 WD with an accretion rate of yr-1. This model explains the optical/UV light curves on the basis of free–free emission originating from winds, as well as the supersoft X-ray light curve on the basis of blackbody emission from the WD photosphere. The smaller wind mass-loss rates and higher photospheric temperatures are consistent with the faint optical peak of M31N 2008-12a.
-
3.
The ejected mass is calculated to be . This corresponds to the mass accumulation efficiency of . Thus, the WD is increasing in mass. This makes M31N 2008-12a a strong candidate for an SN Ia progenitor.
- 4.
-
5.
The next outburst of the recurrent nova M31N 2008-12a is expected in autumn 2015. We encourage detection of this X-ray flash in order to obtain a complete description of this valuable outburst. Also, detection of a UV flux during the X-ray flash would give us unprecedented information on the irradiated accretion disk or circumbinary matter before it is disturbed by the high velocity ejecta. High cadence observation of UV light curves, as well as spectra, would be very useful for studying the origin of these emissions.
References
- Darnley et al. (2014) Darnley, M. J., Williams, S. C., Bode, M. F., et al. 2014, A&A, 563, L9
- Darnley et al. (2015) Darnley, M. J., Henze, M., Steele, I.A. et al. 2015, A&A, in press (arXiv:1506.04202)
- Güver & Özel (2009) Güver, T., & Özel, F. 2009, MNRAS, 400, 2050
- Hachisu & Kato (2001) Hachisu, I., & Kato, M. 2001, ApJ, 558, 323
- Hachisu & Kato (2003a) Hachisu, I., & Kato, M. 2003a, ApJ, 590, 445
- Hachisu & Kato (2003b) Hachisu, I., & Kato, M. 2003b, ApJ, 598, 527
- Hachisu & Kato (2006) Hachisu, I., & Kato, M. 2006, ApJS, 167, 59
- Hachisu et al. (2008) Hachisu, I., Kato, M., & Cassatella, A. 2008, ApJ, 687, 1236
- Hachisu and Kato (2010) Hachisu, I., and Kato, M. 2010, ApJ, 709, 680
- Hachisu & Kato (2015) Hachisu, I., & Kato, M. 2015, ApJ, 798, 76
- Hachisu et al. (2000a) Hachisu, I., Kato, M., Kato, T., & Matsumoto, K. 2000a, ApJ, 528, L97
- Hachisu et al. (2006) Hachisu, I., Kato, M., Kiyota, S. et al., 2006, ApJ, 651, L141
- Hachisu et al. (1999b) Hachisu, I., Kato, M., & Nomoto, K. 1999b, ApJ, 522, 487
- Hachisu et al. (2010) Hachisu, I., Kato, M., & Nomoto, K. 2010, ApJ, 724, L212
- Hachisu et al. (1999a) Hachisu, I., Kato, M., Nomoto, K., & Umeda, H. 1999a, ApJ, 519, 314
- Han & Podsiadlowski (2004) Han, Z., & Podsiadlowski, Ph. 2004, MNRAS, 350, 1301
- Henze et al. (2014) Henze, M., Ness, J.-U., Darnley, M., et al. 2014, A&A, 563, L8
- Henze et al. (2015) Henze, M., Ness, J.-U., Darnley, M., et al. 2014, A&A, in press (arXiv:1504.06237)
- Iglesias & Rogers (1996) Iglesias, C. A., & Rogers, F. J. 1996, ApJ, 464, 943
- Li & van den Heuvel (1997) Li, X.-D., & van den Heuvel, E. P. J. 1997, A&A, 322, L9
- Kato & Hachisu (1994) Kato, M., & Hachisu, I., 1994, ApJ, 437, 802
- Kato & Hachisu (2012) Kato, M., & Hachisu, I. 2012, BASI, 40, 393
- Kato et al. (2014) Kato, M., Saio, H., Hachisu, I., & Nomoto, K. 2014, ApJ, 793, 136
- Maoz et al. (2014) Maoz, D., Mannucci, F., & Nelemans, G. 2014, ARA&A, 52, 107
- Nomoto (1982) Nomoto, K. 1982, ApJ, 253, 798
- Pagnotta & Schaefer (2014) Pagnotta, A., & Schaefer, B. E. 2014, ApJ, 788, 164
- Prialnik & Kovetz (1995) Prialnik, D., & Kovetz, A. 1995, ApJ, 445, 789
- Sala & Hernanz (2005) Sala, G., & Hernanz, M. 2005, A&A, 439, 1061
- Tang et al. (2014) Tang, S., Bildsten, L., Wolf, W. M., et al. 2014, ApJ, 786: 61
- Wolf et al. (2013) Wolf, W. M., Bildsten, L., Brooks, J., & Paxton, B. 2013, ApJ, 777, 136: Erratam 782, 117