First measurements of 15N fractionation in N2H+ toward high-mass star forming cores ††thanks: Based on observations carried out with the IRAM-30m Telescope. IRAM is supported by INSU/CNRS (France), MPG (Germany) and IGN (Spain).
Abstract
We report on the first measurements of the isotopic ratio 14N/15N in N2H+ toward a statistically significant sample of high-mass star forming cores. The sources belong to the three main evolutionary categories of the high-mass star formation process: high-mass starless cores, high-mass protostellar objects, and ultracompact Hii regions. Simultaneous measurements of the 14N/15N ratio in CN have been made. The 14N/15N ratios derived from N2H+ shows a large spread (from up to ), while those derived from CN are in between the value measured in the terrestrial atmosphere () and that of the proto-Solar nebula () for the large majority of the sources within the errors. However, this different spread might be due to the fact that the sources detected in the N2H+ isotopologues are more than those detected in the CN ones. The 14N/15N ratio does not change significantly with the source evolutionary stage, which indicates that time seems to be irrelevant for the fractionation of nitrogen. We also find a possible anticorrelation between the 14N/15N (as derived from N2H+) and the H/D isotopic ratios. This suggests that 15N enrichment could not be linked to the parameters that cause D enrichment, in agreement with the prediction by recent chemical models. These models, however, are not able to reproduce the observed large spread in 14N/15N, pointing out that some important routes of nitrogen fractionation could be still missing in the models.
1 Introduction
Nitrogen is the fifth most abundant chemical element in the universe, and exists in the form of two stable isotopes: 14N and 15N. In the terrestrial atmosphere (TA), the typical atomic composition 14N/15N as derived from N2 is . This value is quite consistent (within a factor 2) with that measured in cometary nitrile-bearing molecules (e.g. Bockelée-Morvan et al. 2008, Manfroid et al. 2009) and in primitive chondrites (e.g. Briani et al. 2009, Bonal et al. 2010), but it is significantly smaller than the value measured in the present-day Solar wind, which is , as derived from the particles collected by the Genesis spacecraft (Marty et al. 2011). This value is comparable to that of the Jupiter’s atmosphere (Fouchet et al. 2004), and it is considered to be representative of the so-called ”proto-Solar nebula” (PSN), from which our Sun has formed. However, to understand how these values are linked to the initial chemical composition of the molecular environment in which the System itself was formed, and put constraints on chemical models, measurements of the 14N/15N ratio in dense molecular star-forming cores similar to that in which the Sun was likely formed are mandatory.
In dense molecular cores, where the direct observation of N2 is impossible, the 14N/15N isotopic ratio is measured from abundant N-bearing species such as N2H+, NH3, CN, HCN, and HNC, and the results are still puzzling. In fact, while the 14N/15N ratio measured toward pre–stellar cores or protostellar envelopes in hydrogenated nitrogen compounds (such as N2H+ and NH3) is comparable to the value found in the PSN (e.g. in NH3; Lis et al. 2010; Gerin et al. 2009; Daniel et al. 2013), or even larger (1000200 in N2H+; Bizzocchi et al. 2013), the 14N/15N ratio derived from the nitrile-bearing species HCN and HNC is significantly lower (140 – 360, Hily-Blant et al. 2013a; 120–400, Adande & Ziurys 2012; 160–290, Wampfler et al. 2014). Differences in nitrogen hydrides and nitrile-bearing molecules within clouds are predicted by chemical models inclusive of spin-state chemistry (Wirström et al. 2012; Hily-Blant et al. 2013a), but no models have been able so far to reproduce the low 15N fractions measured in N2H+. The 15N fraction measured in CN toward starless cores has been found marginally consistent with the proto-Solar value of 441 (50075, Hily-Blant et al. 2013b), in contrast with the large 15N fractions measured in HCN in both starless cores (Hily-Blant et al. 2013b) and protostellar objects (Wampfler et al. 2014). This is also expected from theory (Hily-Blant et al. 2013b). A gradient of 14N/15N with the Galactic distance has been measured by Adande & Ziurys (2012) via observations of molecular clouds in CN and HCN, and found to be in agreement with predictions of Galactic chemical evolution models (e.g. Clayton 2003, Romano & Matteucci 2003). However, the 15N fractionation of CN and HCN are often based on observations of the optically thin isotopologues containing 13C, because the main isotopologues are typically optically thick, which makes it less accurate the derivation of the column densities (e.g. Hily-Blant 2013a, 2013b). Roueff et at. (2015) have found possible reduced abundances of the 13C due to the fact that nitriles and isonitriles are predicted to be significantly depleted in 13C (Roueff et at. 2015). However, this depletion is estimated to be of the order of the , namely often of the order of the calibration uncertainties associated to the measured column densities.
In star forming regions, D- and 15N- fractions are not correlated. For example, in L1544, N2H+ is highly deuterated (D-fraction 30%; Caselli et al. 2002), while an anti-fractionation is observed in 15N (Bizzocchi et al. 2013). Wirström et al. (2012) reproduced these differentiations and noticed that they are also present in meteoritic material, as only in a few cases 14N/15N correlates with H/D ratios (Mandt et al. 2014). This suggests an interstellar heritage of the Solar System 15N and D isotopic anomalies. Therefore, it is important to gather more data and to put stringent constraints on current chemical models, with the ultimate goal of investigating the possible link between cometary and interstellar medium material (see also Caselli & Ceccarelli 2012), especially in intermediate- and high-mass dense cores, since growing evidence is suggesting that our Sun was born in a rich stellar cluster (Adams 2010).
In this letter we report the first observational measurements of the 14N/15N ratio in a sample of dense cores associated with different stages of the high-mass star formation process, and already studied in deuterated molecules. Our study can investigate if the nitrogen fractionation process varies with the physical evolution of the core. What is more, the 14N/15N ratio is derived from two well-studied nitrogen-bearing species, N2H+ and CN, allowing us to investigate whether the fractionation of the two species follows different pathways as suggested by Hily-Blant et al. (2013a).
2 Observations
The spectra presented in this work are part of a spectral survey performed with the IRAM-30m Telescope in two millimeter bands, one centred at about 3 mm covering frequencies in the range 89.11 – 96.89 GHz, and another centred at about 1.3 mm covering frequencies in the range 216.0 – 223.78 GHz, towards 26 dense cores divided into three main evolutionary categories: High-mass starless cores (HMSCs); high-mass protostellar objects (HMPOs); Ultracompact Hii regions (UC Hiis , see also Fontani et al. 2011 for details on the source selection criteria). In Fontani et al. (2015) we have published part of these observations, namely that about the lines of CH3OH and of its deuterated forms, so that we refer to Sect. 2 and Table 2 of that work for a description of the observational parameters and technical details. In the 3 mm band, the fundamental rotational transition of N2H+, 15NNH+ and N15NH+ (at 93173.4 MHz, 90263.8 MHz and 91205.7 MHz, respectively) were observed simultaneously to the CH3OH observations described by Fontani et al. (2015) with velocity resolution of km s-1 (the telescope HPBW is ′′). In the 1 mm band, several hyperfine components of the transition of radicals 13CN (50 components with rest frequencies in between 217.0326 and 218.0311 GHz) and C15N (10 components with rest frequencies in between 219.38749 and 219.93482 GHz) were also observed with velocity resolution of km s-1 (the telescope HPBW is ′′).
3 Results
3.1 15NNH+ , N15NH+ , and N2H+
The 15NNH+ (1–0) has been detected in 14 cores: four HMSCs, six HMPOs and four UC HIIs. Because the separation between the hyperfine components is comparable to the line widths, the hyperfine structure is unresolved in almost all spectra. Therefore, the lines have been fit with single Gaussians, except in four cases (05358–mm3, 05358–mm1, ON1, 19410) in which the fit to the hyperfine structure has given reliable results despite the small separation of the components and the poor spectral resolution. This simplified approach could affect the determination of the line width, but will not affect the measurement of the column densities because they will be derived from the total integrated area, as we will describe below. The N15NH+ (1–0) has been detected in 11 cores: two HMSCs, five HMPOs and four UC HIIs. The hyperfine components in this case are only three, with a faint central one and two fainter satellites, but the faintness of the satellites has forced us to fit many of the lines with Gaussians in this case too. Finally, the N2H+(1–0) line is clearly detected in all sources and the fit to the hyperfine structure gives good results in all spectra, pointing out that no hyperfine anomalies are present. In Fig. 1 we show the spectra of the 15NNH+ , N15NH+ and N2H+ (1–0) lines in the representative core 05358–mm3.
The total column density of N2H+, averaged within the beam, has been evaluated from Eq. (A1) in Caselli et al. (2002). The formula assumes the same for all the hyperfine components. For sources with total opacity well-constrained, was computed from the output parameters obtained from the hyperfine fit procedure (in particular the total optical depth, , and ) following the approach described in the CLASS user manual111for details: http://iram.fr/IRAMFR/GILDAS/doc/html/class-html/class.html/. For the others, we have assumed the average derived from the lines with well-constrained opacity in each evolutionary stage (18, 43 and 57 K for HMSCs, HMPOs, and UC Hiis, respectively), and obtained the column density from Eq. (A4) of Caselli et al. (2002), valid for optically thin lines. The spectral parameters used in our calculations (, Einstein coefficients, rotational constants, energies and statistical weight of the levels) were taken from the Cologne Database for Molecular Spectroscopy (Müller et al. 2005).
The total column densities of both 15NNH+ and N15NH+ have been computed in all detected sources from the total line integrated intensity with Eq. (A4) of Caselli et al. (2002), assuming optically thin lines and LTE conditions. As excitation temperature, we have used that derived from the N2H+(1–0) line. All column densities and the parameters used to derive them (line integrated intensities and ), are given in Table 1.
3.2 13CN and C15N
Several hyperfine components of the transitions of both 13CN and C15N were detected towards 13 cores, which yields a detection rate of 50. As expected, most of the cores were detected in the hyperfine components with larger values of , which are: ; ; for 13CN , and ; for C15N. Representative spectra obtained towards core 05358–mm3 centred on these hyperfine components are shown in Fig. 1.
To compute the column densities of both radicals, we have derived first the integrated intensity of the group of hyperfine components (Table 2) mentioned above, and computed the total column densities from Eq.(A4) of Caselli et al. (2002), which assumes the same excitation temperature in the various rotational levels, and it is valid for optically thin lines. The formula has been adapted to take the hyperfine structure into account, namely we have adopted the spectroscopic parameters (Einstein coefficients, energies and statistical weight of the levels) of the hyperfine components considered only. All spectroscopic parameters, as well as the partition functions used to derive the total column density, have been taken from the Cologne Database for Molecular Spectroscopy (Müller et al. 2005). When the hyperfine components are not blended, their relative intensities are consistent with the assumption of optically thin lines and no hyperfine anomalies (within the calibration uncertainties). As excitation temperature, we have used the reported in Table 1, derived from N2H+. This assumption is critical, but the C15N/13CN column density ratio does not change by varying of even an order of magnitude, as it was already noted in other works dealing with isotopic ratios (see e.g. Sakai et al. 2012, Fontani et al. 2014a).
The CN column densities were then computed from the 13CN ones by applying the isotopic ratio 12C/13C derived from the relation between this ratio and the source galactocentric distance found for CN by Milam et al. (2005). Galactocentric distances have been taken from Fontani et al. (2014b). We have not corrected the column densities for a filling factor because we do not have any direct estimate of the size of the emitting region of both molecules, and we do not see any physical or chemical reason by which the emission of 13CN and C15N should arise from different regions.
In 19410+2336, and ON1, the 13CN hyperfine components mentioned above are barely detected, while in G5.89–0.39 they are heavily affected by a nearby CH3OH stronger line. Therefore, in these sources we have used the better detected hyperfine component . In G5.89–0.39 the blending problem affects also the C15N lines, so that we have used the isolated hyperfine component to compute the C15N column density. For I00117–MM1, I21307, I19035–VLA1, and 23033+5851, detected in 13CN but not in C15N, we have derived an upper limit for the column density of C15N. All column densities, and the line integrated intensities used to compute them, are listed in Table 2.
| source | 15NNH+(1–0) | N15NH+ (1–0) | N2H+(1–0) | ||||||
| (15NNH+ ) | (N15NH+ ) | (N2H+) | |||||||
| K km s-1 | (cm-2) | K km s-1 | (cm-2) | K km s-1 | (cm-2) | (K) | |||
| HMSC | |||||||||
| I00117–MM2 | 0.029(0.001)t | 5.68(0.09) | 0.04 | 3.966(0.007)a | 3.8(0.5) | 670(98) | 19 | ||
| AFGL5142–ECw | 0.040(0.002) | 24(1) | 0.04 | 8.81(0.01)a | 28(8) | 1100(360) | 76 | ||
| 05358–mm3w | 0.17(0.01) | 32(2) | 0.20(0.01) | 37(3) | 39.69(0.05) | 6.60(0.01) | 210(12) | 180(13) | 18 |
| G034–G2 | 0.04 | 0.04 | 4.314(0.001)a | 5.95(0.08) | 19 | ||||
| G034–F1 | 0.05 | 0.04 | 4.4(0.1)a | 3.9(0.3) | 11 | ||||
| G034–F2 | 0.04 | 0.04 | 9.20(0.03) | 1.53(0.01) | 18 | ||||
| G028–C1 | 0.04 | 0.04 | 5.735(0.006)a | 8.5(0.1) | 15 | ||||
| I20293–WC | 0.063(0.006) | 17(2) | 0.08(0.01) | 20(3) | 7.150(0.003)a | 11.0(0.8) | 65(69) | 550(98) | 29 |
| 22134–Gw | 0.03 | 0.04 | 7.80(0.03) | 1.30(0.01) | 18 | ||||
| 22134–B | 0.04 | 0.04 | 2.83(0.07)a | 1.8(0.3) | 14 | ||||
| HMPO | |||||||||
| I00117–MM1 | 0.05(0.01)t | 14(3) | 0.05 | 2.88(0.01)a | 3.0(0.3) | 220(60) | 27 | ||
| AFGL5142–MM | 0.072(0.009) | 32(4) | 0.042(0.003)t | 18(1) | 9.41(0.02)a | 23.5(1) | 740(97) | 1300(210) | 53 |
| 05358–mm1 | 0.17(0.02) | 61(6) | 0.18(0.02) | 65(8) | 36.63(0.05) | 11.78(0.02) | 190(20) | 180(23) | 43 |
| 18089–1732 | 0.08(0.09) | 22(9) | 0.10(0.01) | 27(3) | 9.312(0.002)a | 21(2) | 1000(400) | 800(100) | 31 |
| 18517+0437 | 0.058(0.008) | 21(3) | 0.089(0.005) | 32(2) | 25.98(0.03) | 8.35(0.01) | 390(53) | 260(20) | 43 |
| G75–core | 0.06 | 0.05 | 13.95(0.06) | 4.49(0.02) | 43 | ||||
| I20293–MM1 | 0.086(0.007) | 56(5) | 0.19(0.02) | 122(14) | 16.410(0.001)a | 44.62(0.05) | 790(67) | 370(42) | 82 |
| I21307 | 0.05 | 0.05 | 2.13(0.05)a | 2.2(0.3) | 10 | ||||
| I23385 | 0.05 | 0.06 | 4.74(0.03) | 1.53(0.01) | 43 | ||||
| UC Hii | |||||||||
| G5.89–0.39 | 0.18(0.01) | 84(6) | 0.13(0.01) | 61(6) | 66.3(0.5) | 27.3(0.3) | 320(25) | 450(51) | 57 |
| I19035–VLA1 | 0.06 | 0.05 | 3.820(0.008)a | 18(1) | 66 | ||||
| 19410+2336 | 0.18(0.02) | 96(8) | 0.16(0.01) | 82(8) | 21.27(0.01)a | 43(5) | 450(96) | 500(100) | 64 |
| ON1 | 0.21(0.01) | 72(3) | 0.29(0.02) | 94(8) | 12.795(0.001)a | 33(4) | 460(22) | 350(33) | 39 |
| I22134–VLA1 | 0.05 | 0.04 | 4.71(0.03) | 1.94(0.01) | 57 | ||||
| 23033+5951 | 0.048(0.007) | 23(3) | 0.065(0.006) | 30(3) | 7.660(0.001)a | 20(6) | 900(400) | 700(250) | 57 |
| NGC7538–IRS9 | 0.05 | 0.05 | 14.93(0.04) | 6.13(0.02) | 57 | ||||
a lines with well-constrained optical depth, for which we do not list
the integrated intensity but the parameter ,
from which we have derived the column density as explained in Sect. 3.1;
w ”warm” HMSC;
t tentative detection
| source | C15N(2–1) | 13CN(2–1) | ||||
| (C15N) | (CN) | |||||
| K km s-1 | (cm-2) | K km s-1 | kpc | (cm-2) | ||
| HMSC | ||||||
| I00117–MM2 | ||||||
| AFGL5142–ECw | 0.14(0.02)b | 1.6(0.2) | 0.35(0.02)a | 10.3 | 5.3(0.3) | 330(67) |
| 05358–mm3w | 0.12(0.02)b | 0.7(0.1) | 0.36(0.02)a | 10.3 | 2.7(0.1) | 400(90) |
| G034–G2 | ||||||
| G034–F1 | ||||||
| G034–F2 | ||||||
| G028–C1 | ||||||
| I20293–WC | ||||||
| 22134–Gw | 0.06(0.02)b | 0.3(0.1) | 0.16(0.02)a | 9.5 | 1.1(0.1) | 330(150) |
| 22134–B | ||||||
| HMPO | ||||||
| I00117–MM1 | 0.13(0.02)a | 9.5 | 1.0(0.1) | |||
| AFGL5142–MM | 0.28(0.02)b | 2.4(0.2) | 0.40(0.02)a | 10.3 | 4.7(0.2) | 190(23) |
| 05358–mm1 | 0.12(0.02)b | 1.5(0.2) | 0.36(0.02)a | 10.3 | 3.7(0.2) | 240(40) |
| 18089–1732 | 0.14(0.03)b | 0.9(0.2) | 0.80(0.02)a | 5.1 | 4.0(0.1) | 450(100) |
| 18517+0437 | 0.10(0.02)b | 0.8(0.2) | 0.34(0.02)a | 6.5 | 2.4(0.2) | 310(80) |
| G75–core | 0.19(0.03)b | 1.4(0.2) | 0.40(0.02)a | 8.4 | 3.4(0.2) | 240(50) |
| I20293–MM1 | ||||||
| I21307 | 0.09(0.02)a | 9.3 | 0.7(0.2) | |||
| I23385 | ||||||
| UC Hii | ||||||
| G5.89–0.39 | 0.14(0.03)d | 3.5(0.8) | 0.12(0.03)c | 7.2 | 12(3) | 350(160) |
| I19035–VLA1 | 0.16(0.02)a | 7.0 | 1.6(0.2) | |||
| 19410+2336 | 0.07(0.02)d | 1.9(0.5) | 0.07(0.02)c | 7.7 | 8(2) | 430(250) |
| ON1 | 0.07(0.02)d | 1.4(0.4) | 0.06(0.02)c | 8.0 | 5(2) | 350(220) |
| I22134–VLA1 | 0.09(0.02)b | 0.8(0.2) | 0.18(0.02)a | 9.5 | 2.1(0.2) | 250(84) |
| 23033+5951 | 0.21(0.02)a | 10.3 | 2.6(0.2) | |||
| NGC7538–IRS9 | 0.08(0.02)b | 0.7(0.2) | 0.14(0.02)a | 9.9 | 1.7(0.2) | 230(90) |
w ”warm” HMSC;
a from the hyperfine components
and ;
b from the hyperfine components and ;
c from the hyperfine component ;
d from the hyperfine component .
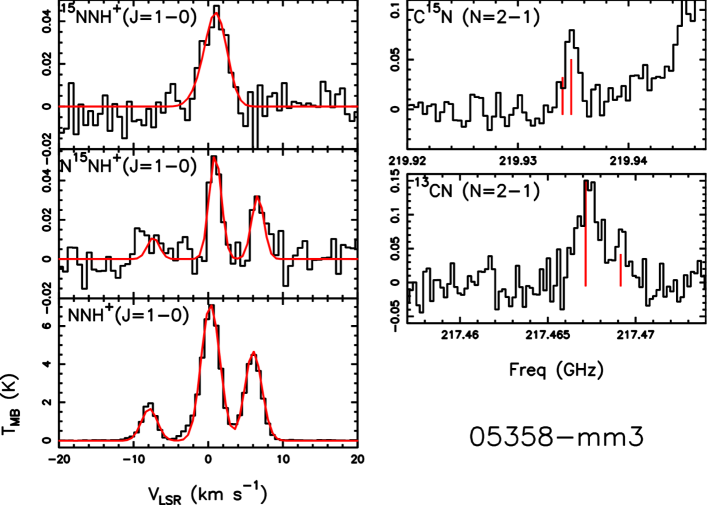
Right panels: spectra of C15N (, top) and 13CN (, bottom) towards 05358–mm3 centred on the hyperfine components mentioned in Sect. 3.2, and indicated by the red vertical lines, the length of which is proportional to their relative intensities.
4 Discussion
The comparison between the column densities of the 15N-containing species and those of their main isotopologues, derived as explained in Sects. 3.1 and 3.2, is shown in Fig. 2. The corresponding 14N/15N isotopic ratios are given in Tables 1 and 2. The first result emerging from these numbers and from Fig. 2 is that the NNH+/15NNH+ and NNH+/N15NH+ ratios vary between 180 and 1300, namely over a range much larger than observed so far towards low mass objects in any N-bearing species. Some values are, therefore, compatible with both those of the TA and PSN, but much larger values are also measured. In addition, there is no evidence of a trend of these ratios with the evolution, because Fig. 2 shows that the sources belonging to different evolutionary stages possess similar 14N/15N ratios, within the uncertainties. Consistently, we do not find any correlation with the line widths, which are thought to be good indicators of the evolutionary stage. Therefore, whatever is the reason for this different 15N enrichment, time does not seem to play a role.
The second result is that the CN/C15N ratio is within and , namely consistent within the errors with the 15N enrichment of both TA and PSN. Interestingly, when the NNH+/15NNH+ and CN/C15N ratios can be measured in the same object, they have the same 14N/15N ratio, within the error bars, only in nearly half of the sources detected in both N2H+ and CN isotopologues, as shown in Fig. 3. However, globally the lower range of variation of the CN/C15N could be a result biased by the fact that fewer sources were detected in C15N than in the N2H+ isotopologues. Follow-up higher sensitivity observations will be helpful to address this aspect.
Note that, since the CN/C15N has been derived by observations of 13CN, there is also the possibility that an error is introduced because of the variation of the 12C/13C introduced by depletion of 13C (see Sect. 1). However, the recent, very detailed study by Roueff et al. (2015) predicts variations up to (CN/13CN ratio from 67 to 80), namely within the errors of our measurements. Thus, we conclude that our estimates of the CN/C15N are substantially correct.
The measurements of both NNH+/15NNH+ and CN/C15N are at odds with the recent model by Roueff et al. (2015), which predicts that the 14N/15N should not vary in both species, unless the age of the condensation is shorter than 105 yrs. This possibility, however, seems to be ruled out by our observations, as the 14N/15N is not different in the three evolutionary groups. We conclude that some important routes of nitrogen fractionation are still missing in the models.
A hint of what they could be might be obtained considering the D-fractionation of NNH+ towards the same sources where we measured the N-fractionation. The bottom panels in Fig. 2 show NNH+/15NNH+ and NNH+/N15NH+ as a function of the NNH+/NND+, as previously measured by Fontani et al. (2011). Although not very strong, the data show a possible anti-correlation between the two parameters: the larger the 14N/15N, the lower the H/D. Non-parametric statistical tests confirm this trend: the Kendall’s rank correlation coefficient is when the 14N/15N is derived from either 15NNH+ and N15NH+ , and the Pearson’s correlation coefficient is and , respectively. Moreover, the probability for a chance correlation is below the 2 in both cases. Also, we have performed least square fits to the data, which provide slopes of and for the 14N/15N ratios derived from 15NNH+ and N15NH+, respectively. Based on this suggestive anti-correlation, we conclude that the N-fractionation does not seem to be linked to the parameters that are known to affect the D-fractionation (if not to obtain the inverse effect): temperature and CO depletion (or density). In other words, the reactions leading to N-fractionation of NNH+ and CN indeed do not have an energy barrier, as predicted by Roueff et al. (2015). Finally, and consistently with this last sentence, we do not find any correlation between the measured N-fractionation and the excitation temperature, contrary to the results of Wampfler et al. (2014), who claimed a tentative trend towards a temperature-dependent 14N/15N fractionation. However, because the anti-correlation found is not strong, care needs to be taken in the interpretation of this result.
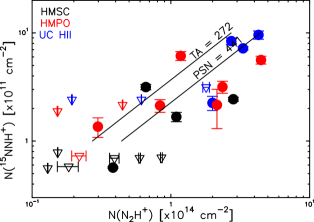
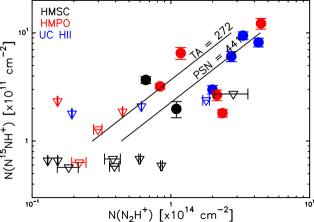
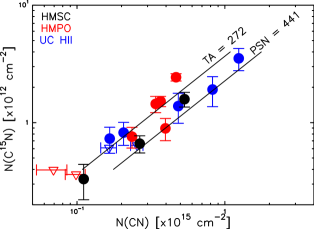
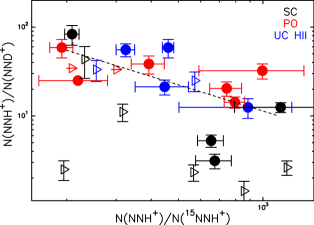
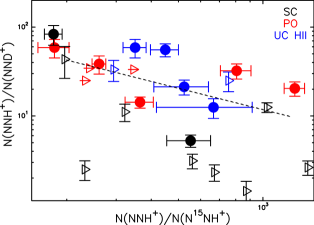
In all panels, the filled circles represent the detected sources (black = HMSCs; red = HMPOs; blue = UC HIIs). The open triangles in the top and middle panels correspond to the upper limits on (15NNH+ ), (N15NH+ ) or (C15N), repectively, while in the bottom panels indicate lower limits on either (N2H+)/(15NNH+ ) or (N2H+)/(N15NH+ ). The solid lines indicate the mean atomic composition as measured in the terrestrial atmosphere (TA) and in the protosolar nebula (PSN, see Hily-Blant et al. 2013a and references therein). The dashed lines in the bottom panels indicate least square fits.

5 Conclusions
We have observed the J = 1–0 rotational transitions of 15NNH+, N15NH+ and N2H+, together with = 2–1 transitions of 13CN and C15N, towards 26 massive star forming cores in different evolutionary stages, where the deuteration fraction has already been measured (Fontani et al. 2011). We find 14N/15N in CN between 190 and 450, and in N2H+ from 180 up to 1300. It is the first time that high 15N fractionations are found in N2H+. However, in the fractionation process, time does not seem to play a role because the 14N/15N ratio does not depend on the evolutionary stage of the source. We find a suggestive anticorrelation between D and 15N fractions, consistent with findings in Solar System material, where N isotope ratios largely vary and only in a few cases they have been found to correlate with D/H ratios (Mandt et al. 2014). This lack of correlation is also consistent with the prediction of chemical models, which rule out any link between fractionation of N and the causes of D enrichment, namely temperature and density (or CO depletion).
Acknowledgments
FF and AP thank the IRAM staff for the precious help during the observations. FF is grateful to Fabien Daniel for the careful and constructive reading of the paper. PC acknowledges the financial support of the European Research Council (ERC; project PALs 320620). AP acknowledges financial support from UNAM-DGAPA-PAPIIT IA102815 grant, México. This work has benefited from research funding from the European Community’s Seventh Framework Programme.
References
- Adams (2010) Adams, F.C. 2010, ARA&A, 48, 74
- Adande & Ziurys (2012) Adande, G. R., & Ziurys, L. M. 2012, ApJ, 744, 194
- Bizzocchi et al. (2013) Bizzocchi, L., Caselli, P., Leonardo, E., & Dore, L. 2013, A&A, 555, AA109
- Bockelée-Morvan et al. (2008) Bockelée-Morvan, D., Biver, N., Jehin, E. et al. 2008, ApJ, 679, 49
- Bonal et al. (2010) Bonal, L., Huss, G.R., Krot, A.N. et al. 2010, Geochim. Cosmochim. Acta, 74, 6590
- Briani et al. (2009) Briani, G., Gounelle, M., Marrocchi, Y., et al. 2009, in Lunar and Planetary Institute Science Conference Abstracts, 40, 1642
- Caselli et al. (2002) Caselli, P., Walmsley, C.M., Zucconi, A., et al. 2002a ApJ, 565, 344
- Caselli & Ceccarelli (2012) Caselli, P. & Ceccarelli, C. 2012, A&ARv, 20, 56
- Clayton (2003) Clayton, D. 2003, Handbook of Isotopes in the Cosmos, by Donald Clayton, pp. 326. ISBN 0521823811. Cambridge, UK: Cambridge University Press, October 2003
- Daniel et al. (2013) Daniel, F., Gerin, M., Roueff, E., Cernicharo, J., Marcelino, N., Lique, F., et al. 2013, A&A, 560, 3
- Fouchet et al. (2004) Fouchet, T., Irwin, P. G. J., Parrish, P., et al. 2004, Icarus, 172, 50
- Gerin et al. (2009) Gerin, M., Marcelino, N., Biver, N. et al. 2009, A&A, 498, L9
- Fontani et al. (2011) Fontani, F., Palau, A., Caselli, P. et al. 2011, A&A, 529, L7
- Fontani et al. (2015) Fontani, F., Busquet, G., Palau, A., Caselli, P. et al. 2015, A&A, 575, 87
- Fontani et al. (2014a) Fontani, F., Codella, Ceccarelli, C., Lefloch, B. et al. 2014a, ApJ, 788, L43
- Fontani et al. (2014b) Fontani, F., Sakai, T., Furuya, K., Sakai, N., Aikawa, Y., Yamamoto, S. 2014b, MNRAS, 440, 448
- Fontani et al. (2004) Fontani, F., Cesaroni, R., Testi, L., Walmsley, C.M., Molinari, S., Neri, R., Shepherd, D. et al. 2004, A&A, 414, 299
- Fouchet et al. (2004) Fouchet, T., Irwin, P.G.J., Parrish, P., Calcutt, S.B., Taylor, F.W., Nixon, C.A., Owen, T. 2004, Icarus, 172, 50
- Hily-Blant et al. (2013a) Hily-Blant, P., Bonal, L., Faure, A., Quirico, E. 2013, Icarus, 223, 582
- Hily-Blant et al. (2013b) Hily-Blant, P., Pineau des Forêts, G., Faure, A., Le Gal, R., & Padovani, M. 2013, A&A, 557, AA65
- Lis et al. (2010) Lis, D.C., Wootten, A., Gerin, M., Roueff, E. 2010, ApJ, 710, L49
- Mandt et al. (2014) Mandt, K. E., Mousis, O., Lunine, J. I., & Gautier, D. 2014, Lunar and Planetary Science Conference, 45, 1955
- Marty et al. (2011) Marty, B., Chaussidon, M, Wiens, R.C., Jurewicz, A.J.G, & Burnett, D.S. 2011, Science, 332, 1533
- Manfroid et al. (2009) Manfroid, J., Jehin, E., Hutsemékers, D., et al. 2009, A&A, 503, 613
- Milam et al. (2005) Milam, S.N., Savage, C., Brewster, M.A., Ziurys, L.M., Wyckoff, S. 2005, ApJ, 634, 1126
- Müller et al. (2005) Müller, H.S.P., Schlöder, F., Stutzki, J., Winnewisser, G. 2005, J. Mol. Struct., 742, 215
- Romano & Matteucci (2003) Romano, D., & Matteucci, F. 2003, MNRAS, 342, 185
- Roueff et al. (2015) Roueff, E., Loison, J.C., Hickson, K.M. 2015, arXiv:150101141
- Sakai et al. (2012) Sakai, T., Sakai, N., Furuya, K., Aikawa, Y. et al. 2012, ApJ, 747, 140
- Wampfler et al. (2014) Wampfler, S.F.; Jørgensen, J.K., Bizzarro, M., Bisschop, S.E. 2014, A&A, 572, 24
- Wirström et al. (2012) Wirström, E.S., Charnley, S.B., Cordiner, M.A., Milam, S.N. 2012, ApJ, 757, L11