Measuring and Managing Answer Quality
for Online Data-Intensive Services
Abstract
Online data-intensive services parallelize query execution across distributed software components. Interactive response time is a priority, so online query executions return answers without waiting for slow running components to finish. However, data from these slow components could lead to better answers. We propose Ubora, an approach to measure the effect of slow running components on the quality of answers. Ubora randomly samples online queries and executes them twice. The first execution elides data from slow components and provides fast online answers; the second execution waits for all components to complete. Ubora uses memoization to speed up mature executions by replaying network messages exchanged between components. Our systems-level implementation works for a wide range of platforms, including Hadoop/Yarn, Apache Lucene, the EasyRec Recommendation Engine, and the OpenEphyra question answering system. Ubora computes answer quality much faster than competing approaches that do not use memoization. With Ubora, we show that answer quality can and should be used to guide online admission control. Our adaptive controller processed 37% more queries than a competing controller guided by the rate of timeouts.
I Introduction
Online data-intensive (OLDI) services, such as search engines, product recommendation, sentiment analysis and Deep QA power many popular websites and enterprise products. Like traditional Internet services, OLDI services must answer queries quickly. For example, Microsoft Bing’s revenue would decrease by $316M if it answered search queries 500ms slower [12]. Similarly, IBM Watson would have lost to elite Jeopardy contestants if it waited too long to answer [25, 10]. However, OLDI and traditional services differ during query execution. Traditional services use structured databases to retrieve answers, but OLDI services use loosely structured or unstructured data. Extracting answers from loosely structured data can be complicated. Consider the OpenEphyra question answering system [1]. Each query execution reduces text documents to a few phrases by finding noun-verb answer templates within sentences.
OLDI services use large and growing data to improve the quality of their answers, but large data also increases processing demands. To keep response time low, OLDI query executions are parallelized across distributed software components. At Microsoft Bing, query execution invokes over 100–1000 components in parallel [20]. Each component contributes intermediate data that could improve answers. However, some query executions suffer from slow running components that take too long to complete. Since fast response time is essential, OLDI query executions cannot wait for slow components. Instead, they compute answers with whatever data is available within response time constraints.
OLDI services answer queries quickly even though performance anomalies, failed hardware and skewed partitioning schemes slow down some parallel components. However, eliding data from slow components could degrade answer quality [29, 9]. In this paper, answer quality is the similarity between answers produced with and without data from slow components. Queries achieve high answer quality when their execution does not suffer from slow components or when slow components do not affect answers. Low answer quality means that slow, elided components have important contributions that would affect final answers significantly. Prior work has shown the virtue of adaptive resource management with regard to response time. Adaptive management could also help OLDI services manage answer quality. For example, adaptive admission control could stabilize answer quality in the face of time-varying arrival rates.
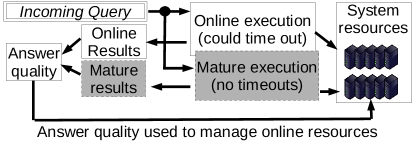
Answer quality is hard to measure online because it requires 2 query executions. Figure 1 depicts the process of computing answer quality. First, an online execution provides answers within response time constraints by eliding data from slow components. Second, a mature execution provides mature answers by waiting for all components before producing answers. Finally, a service-specific similarity function computes answer quality. This paper uses true positive rate as the similarity function, but other functions are permissible, e.g., normalized discounted cumulative gain [27].
We present Ubora111Ubora means quality in Swahili., an approach to speed up mature executions. Our key insight is that mature and online executions invoke many components with the same parameters. Memoization can speed up mature executions, i.e., a mature execution can complete faster by reusing data from its corresponding online execution instead of re-invoking components.
When a query arrives, Ubora conducts a normal online query execution except it records intermediate data provided by each component, including data from slow components that were elided from online answers. After the slow components finish, Ubora computes mature answers using data recorded during and after the online execution. Implementing memoization for multi-component OLDI services presents systems challenges. First, OLDI components span multiple platforms. It is challenging to coordinate mature and online executions across components without changing application-level source code. Ubora manages mature and online operating context. During mature executions, it uses network redirection to replay intermediate data stored in a shared key-value store. Second, memoization speeds up computationally intensive components but its increased bandwidth usage can also cause slowdown for some components. Ubora provides flexible settings for memoization, allowing each component to turn off memoization. We use offline profiling to determine which components benefit from memoization.
We have evaluated Ubora on Apache Lucene with Wikipedia data, OpenEphyra with New York Times data, EasyRec recommendation engine with Netflix data and Hadoop/Yarn with BigBench data. To be sure, Ubora’s systems-level implementation is able to support these applications without modification to their source code. We compared Ubora to a competing approach that eschews transparency for efficiency. Specifically, this competing approach changes application source code to tag query executions with custom online and mature timeout settings. A query executes until its online timeouts trigger, it returns an answer and then resumes for mature execution. Ubora completes mature executions nearly as quickly as this approach with slowdown ranging from 8–16%. We also compared Ubora to an alternative approach that does not require changing application source code. In this approach, each component’s local timeout settings are extended for a short period of time. Ubora finishes mature executions 7X faster. Finally, Ubora slows down normal, online query executions by less than 7%.
We also used Ubora to guide adaptive admission control. We adaptively shed low priority queries to our Apache Lucene and EasyRec systems. The goal was to maintain high answer quality for high priority queries. Ubora provided answer quality measurements quickly enough to detect shifts in the arrival rate and query mix. Specifically, Ubora responded quickly to changing arrival rates, keeping answer quality above 90% during most of the trace. The other transparent approach to measure answer quality, i.e., toggling timeouts, produced mature executions too slowly. This approach allowed answer quality to fall below 90% 12X much more often than Ubora. We also used component timeouts as a proxy for answer quality [20]. This metric is available after online executions without conducting additional mature executions. As a result, it has much lower overhead. However, component timeouts are a conservative approximation of answer quality because they do not assess the effect of timeouts on answers. While achieving the same answer quality on high priority queries, Ubora-driven admission control processed 37% more low priority queries than admission control powered by component timeouts.
This paper is organized as follows. We describe the structure of OLDI services in Section II. We present Ubora in Section III. Section IV presents our implementation of query context tracking and profiling for memoization. In Section V, we measure Ubora’s performance using a wide range of OLDI benchmarks. In Section VI, we show that Ubora computes answer quality quickly enough to guide online load shedding.
II Background on OLDI Services
Query executions differ fundamentally between online data-intensive (OLDI) and traditional Internet services. In traditional services, query executions process data retrieved from well structured databases, often via SQL. Correct query executions produce answers with well defined structure, i.e., answers are provably right or wrong. In contrast, OLDI queries execute on unstructured data. They produce answers by discovering correlations within data. OLDI services produce good answers if they process data relevant to query parameters.
Large datasets improve the quality of OLDI answers. For example, IBM Watson parsed 4TB of mostly public-domain data [10]. One of Watson’s data sources, Wikipedia, grew 116X from 2004–2011 [4]. However, it is challenging to analyze a large dataset within strict response time limits. This section provides background on the software structure of OLDI services that enables the following:
-
1.
Parallelized query executions for high throughput,
-
2.
Returning online answers based on partial, best-effort data to prevent slow software components from delaying response time.
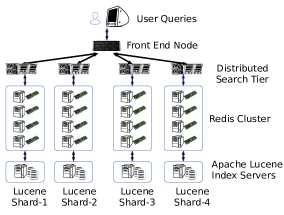
Parallelized Query Execution: Figure 2 depicts a query execution in an Apache Lucene system, a widely used open-source information retrieval library [26]. Query execution invokes 25 software components. Components in adjacent columns can execute in parallel. A front-end node manages network connections with clients, sorts results from nodes running Distributed Search logic and produces final answers. Distributed Search parses the query, requests a wide range of relevant data from storage nodes, and collects data returned within a given timeout. Data is retrieved from either 1) an in-memory Redis cluster that caches a subset of index entries and documents for a Lucene Index Server or 2) the Lucene Index Server itself, which stores the entire index and data on relatively slow disks.
The Lucene system in Figure 2 indexes 23.4 million Wikipedia and NY Times documents (pages + revisions) produced between 2001 and 2013. It parallelizes query execution via data parallelism, i.e., the Lucene Index Servers partition the index across multiple nodes. Each parallel sub-execution (i.e., a vertical column) computes intermediate data based on its underlying partition. Intermediate data is combined to produce a query response.
OLDI services also parallelize query executions via partial redundancy. In this approach, sub-executions compute intermediate data from overlapping data partitions. The query execution weights answers based on the degree of overlap and aggregate data processing per partition. Consider a product recommendation service. Its query execution may spawn two parallel sub-executions. The first finds relevant products from orders completed in the last hour. The second considers the last 3 days. The service prefers the product recommended by the larger (3-day) sub-execution. However, if the preferred recommendation is unavailable or otherwise degraded, the results from the smaller parallel sub-execution help.
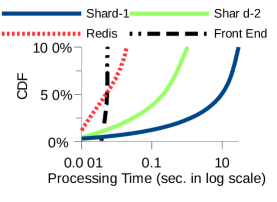
Online Answers Are Best Effort: In traditional Internet services, query execution invokes software components sequentially. Their response time depends on aggregate processing times of all components. In contrast, online data-intensive query executions invoke components in parallel. The processing time of the slowest components determines response time. Figure 3 quantifies component processing times in our Apache Lucene system. The query workload from Google Trends and hardware details are provided in Section V. Processing times vary significantly from query to query. Note, the X-axis is shown in log scale. Lucene Index servers can take several seconds on some queries even though their typical processing times are much faster. Further, processing time is not uniform across shards. For example, a query for “William Shakespeare” transferred 138KB from the shard 4 execution path but only 1KB from the shard 1 execution path. Shard 4 hosted more content related to this query even though the data was partitioned randomly.
Many OLDI services prevent slow components from delaying response time by returning answers prematurely—before slow components finish. Specifically, query executions trigger timeouts on slow components and produce answers that exclude some intermediate data. Timeouts effectively control response time. In our Apache system, we set a 2 second and a 4 second timeout in our front-end component. Average response time fell. Also, third quartile response times were consistently close to median times, showing that timeouts also reduced variance. Unfortunately, query executions that trigger timeouts use less data to compute answers. This degrades answer quality. For data-parallel queries answer quality degrades if the elided data is relevant to query parameters.
III Design
Ubora measures the answer quality of online query executions. By design, it directly computes answer quality by comparing answers produced with and without timeouts. It uses existing online resources and employs memoization to speed up query executions.
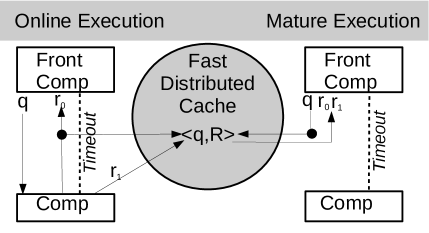
Figure 4 depicts memoization in Ubora. During online query execution, Ubora records inter-component communication. It allows only front-end components to time out. Components invoked by parallel sub-executions complete in the background. As shown on the left side of Figure 4, without Ubora, the front-end component invokes a component with query , receives message and then times out. The front-end component then triggers a timeout for the invoked component, stopping its execution prematurely. Ubora blocks the trigger from the front-end component, allowing the invoked component to complete a mature execution. It records output messages before and after the front-end times out, in this case . These messages are cached in fast, in-memory stores.
With Ubora, front-end components still answer online queries within strict response time limits. As shown in Figure 4, the front-end component uses to produce an online answer. After all sub-executions for a query complete, Ubora re-executes the front-end, as if a new query arrived. However, during this re-execution, Ubora intercepts messages to other components and serves from cache (i.e., memoization). The cache delivers messages with minimal processing or disk delays. During this mature execution, the front-end uses both to produce a mature answer.
IV Implementation
This section discusses the implementation of Ubora. First, we describe axiomatic choices, e.g., the user interface, target users and prerequisite infrastructure. Second, we discuss the impact of operating system support on the implementation of memoization. Finally, we provide details about our implementation, including our approach to determine which components constitute a front-end.
IV-A Interface and Users
Ubora targets system managers. It runs on a cluster of compute nodes. Each node runs a networked operating system. Many software components can map to each node, but each component runs on just 1 node. To be clear, a software component is a running binary that accepts invocations over the network. Software components have unique network addresses, e.g., IP address and TCP port.
System managers understand the query execution paths in their system (e.g., as depicted in Figure 2). They classify each component as front- or back-end. Front components receive queries, record inter-component messages and produce online and mature answers. They are re-executed to get mature answers. Back-end components propagate query context, record messages, and do not time out for sampled queries. Figure 2 labels the front-end component. The search tier, Redis and/or Lucene could be front-end or back-end components.
Ubora is started from the command line. Two shell scripts, startOnBack and startOnFront, are run from a front component. Managers can configure a number of parameters before starting Ubora, shown in Listing 1. The number of mature executions to produce per unit time controls the query sampling rate. When new queries arrive at front end TCP ports, a query sampler randomly decides how to execute the query. Sampled queries are executed under the record mode context shown on the left side of Figure 4. Queries not sampled are executed normally without intervention from Ubora. Record timeout duration sets the upper bound on processing time for a back-end component’s mature execution. Propagate timeout is used to set the upper bound on time to scan for newly contacted components to propagate the execution context. To get mature answers the query execution context is called replay mode. Finally, the callback function used to compute answer quality is service specific. The default is True Positive Rate.
IV-B Impact of Operating System Support
A key goal was to make Ubora as transparent as possible. Here, transparent means that 1) it should work with existing middleware and operating systems without changing them and 2) it should have small effects on response times for online queries. Transparency is hard to achieve, because Ubora must manage record and replay modes without changing the interaction between software components. In other words, the execution context of a query must pass between components unobtrusively. Some operating systems already support execution contexts. Therefore, we present two designs. The first design targets these operating systems. The second design targets commodity operating systems. Our designs exploit the following features of memoization:
-
1.
Queries produce valid output under record, replay, and normal modes. This property is achieved by maintaining a shadow connection to the invoked component during replay. Cache misses trigger direct communication with invoked components. As a result, replay, normal, and record modes have access to full data.
-
2.
Back-end components use more resources during record mode than they use during normal online execution because timeouts are disabled.
Design with OS Managed Contexts: Some operating systems track execution context by annotating network messages and thread-local memory with context and ID. Dapper [32] instruments Google’s threading libraries, Power Containers [31] tracks context switches between Linux processes and annotates TCP messages and Xtrace [11] instruments networked middleware.
OS-managed execution context simplifies our design. Ubora intercepts messages between components, acting as a middle box. Before delivering messages that initiate remote procedures, Ubora checks query ID and context and configures memoization-related context (i.e., record or replay mode). The same checks are performed on context switches. During record mode, when a component initiates a remote invocation, we use the message and query id as a key in the cache. Subsequent component interactions comprise the value associated with the key—provided the query context and ID are matched. We split the value and form a new key when the invoking component sends another message.
In replay mode, when an invocation message is intercepted, the message is used to look up values in the cache. On hits, the cache returns all values that are associated with the message. The cache results are turned into properly formatted messages to transparently provide the illusion of RPC. On misses, the message is delivered to the destination component as described above.
Design without OS Support: Most vanilla operating systems do not track execution context. Without such support, it is challenging to distinguish remote procedure calls between concurrent queries. However, Ubora’s memoization permits imperfect context management because record, replay and normal modes yield valid output. This feature allows us to execute concurrent queries under the same context. First, we describe a simple but broken idea that is highly transparent, and then we present an empirical insight that allows us to improve this design without sacrificing transparency.
In this simple idea, each component manages its current, global execution context that is applied to all concurrent queries. Also, it manages a context id that distinguishes concurrent record contexts. Ubora intercepts messages between components. When a component initiates a remote invocation in record mode, the message and context id are used to create a key. For the duration of record mode, inter-component messages are recorded as values for the key. If the context indicates replay mode, the message and context id are used to retrieve values from cache.
This simple idea is broken because all messages from the invoked component are recorded and cached, including concurrent messages from different queries. In replay mode, those messages can cause wrong output. Our key insight is that record mode should use replies from the invoked component only if they are from the same TCP connection as the initiating TCP connection. The approach works well as long as TCP connections are not shared by concurrent queries. Widely used paradigms like TCP connection pooling and thread pooling are ideal for use with Ubora. We studied the source code of 15 widely used open source components including: JBoss, LDAP, Terracotta, Thrift and Apache Solr. Only 2 (13%) of these platforms multiplexed concurrent queries across the same connection. This suggests that our transparent design can be applied across a wide range of services. We confirm this in Section V-D.
Next we describe how to propagate request context, which is necessary when the operating system does not support execution contexts. On a front component, we wait for queries to arrive on a designated TCP port. If a query is selected for mature execution, we change the front component context from normal to record and create a context id. Before sending any TCP message, we extract the destination component. If the destination has not been contacted since record mode was set, we send a UDP control message that tells that component to enter record mode and forwards the proper context id. Then we send the original message. Note, UDP messages can fail or arrive out of order. This causes the mature execution to fail. However, we accept lower throughput (i.e., mature executions per query) when this happens to avoid increased latency from TCP roundtrips. Middle components propagate state in the same way. Each component maintains its own local timers. After a propagation timeout is reached, the context id is not forwarded anymore. After the record timeout is reached, each component reverts back to normal mode independently. We require front components to wait slightly longer than record timeout to ensure the system has returned to normal.
Reducing Bandwidth Needs: Ubora reduces bandwidth required for context propagation. First, Ubora propagates context to only components used during online execution. Second, Ubora does not use bandwidth to return components to normal mode, only sending UDP messages when necessary to enable record or replay mode. Timeouts local to each component also increase robustness to network partitions and congestion, ensuring that components always return to normal mode.
IV-C Determining Front-End Components
Thus far, we have described the front-end as the software component at which queries initiate. Its internal timeout ensures fast response time, even as components that it invokes continue to execute in the background. To produce an online answer, the front-end must complete its execution. Ubora re-executes the front-end to get mature answers. Ubora can not apply memoization to the front-end component.
At first glance, re-execution seems slower than memoization. However, as shown in Figure 3, many components execute quickly. In some cases, execution is faster than transferring intermediate data to the key-value store. Our implementation allows for a third class of component: middle components. Like front-end components, middle components are allowed to time out. They are re-executed in replay mode without memoization. Unlike front-end components, middle components do not initiate queries. In Figure 2, Distributed Search or Redis components could be labeled middle components.
Given a trace of representative queries, Ubora determines which components to memoize by systematically measuring throughput with different combinations of front-, middle- and back-end components. We do the same to determine the best sampling rate.
IV-D Prototype
We implemented transparent context tracking as described above for the Linux 3.1 operating system. The implementation is installed as user-level package and requires the Linux Netfilter library to intercept and reroute TCP messages. It uses IPQueue to trigger context management processes. It assumes components communicate through remote procedure calls (RPC) implemented on TCP and that an IP address and TCP port uniquely identify each component. It also assumes timeouts are triggered by the RPC caller externally—not internally by the callee. It extends timeouts transparently by blocking FIN packets sent to the callee and spoofing ACKs to the caller. Messages from the callee that arrive after a blocked FIN are cached but not delivered to the caller. For workloads that use connection pooling, we block application-specific termination payloads. Service managers can specify this in the configuration file.
We use a distributed Redis cache for in-memory key value storage. Redis allows us to set a maximum memory footprint per node. The aggregate memory across all nodes must exceed the footprint of a query. Our default setting is 1 GB. Also, Redis can run as a user-level process even if another Redis instance runs concurrently, providing high transparency.
We want to minimize the overhead in terms of response time and cache miss rate. Each key value pair expires after a set amount of time. Assuming a set request rate, cache capacity will stabilize over time. A small amount of state is kept in local in-memory storage on the Ubora control unit node (a front node). Such state includes sampled queries, online and mature results and answer quality computations.
V Experimental Evaluation
| Code- | Platform | Parallelism | Parallel | Data | Nodes | Online resp. | Mature resp. |
|---|---|---|---|---|---|---|---|
| name | Paths | (GB) | time (sec) | time (sec) | |||
| YN.bdb | Apache Yarn | Partial Rep. | 2 | 1 | 8 | 178.00 | 185.00 |
| LC.lit | Lucene | Data | 1 | 4 | 4 | 1.00 | 1.22 |
| LC.wik | Lucene | Data | 4 | 128 | 31 | 3.00 | 8.97 |
| LC.big | Lucene | Data | 4 | 4096 | 31 | 5.00 | 23.52 |
| ER.fst | EasyRec | Partial Rep. | 2 | 2 | 7 | 0.50 | 0.60 |
| OE.jep | OpenEphyra | Data | 4 | 4 | 8 | 3.00 | 23.43 |
In this section, we compare Ubora to alternative designs and implementations across a wide range of OLDI workloads. First, we discuss the chosen metrics of merit. Then, we describe the competing designs and implementations. Then, we present the software and hardware architecture for the OLDI services used. Finally, we present experimental results.
V-A Metrics of Merit
Ubora speeds up mature query executions needed to compute answer quality. The research challenge is to complete mature query executions while processing other queries online at the same time. The primary metric used to evaluate Ubora’s performance (throughput) is mature executions completed per online execution.
Mature executions use resources otherwise reserved for online query executions, slowing down response times. Online queries that Ubora does not select for mature execution (i.e., unsampled queries) are slowed down by queuing delays. We report slowdown as the relative increase in response time. In addition to queuing delay, online queries sampled for mature execution are also slowed down by context tracking and memoization.
Finally, we used true positive rate, i.e., the percentage of mature results represented in online results, to compute answer quality.
V-B Competing Designs and Implementations
Ubora achieves several axiomatic design goals. Specifically, it (1) speeds up mature executions via memoization, (2) uses a systems approach that works for a wide range of OLDI services, (3) supports adjustable query sampling rate and (4) implements optimizations that reduce network bandwidth. Collectively, these goals make Ubora usable. Our evaluation compares competing designs that sacrifice one or more of these goals. They are listed below with an associated codename that will be used to reference them in the rest of the paper.
-
Ubora implements our full design and implementation. The sampling rate is set to maximize mature query executions per online query.
-
Ubora-LowSamples implements our full design and implementation, but lowers the sampling rate to reduce slowdown.
-
Ubora-NoOpt disables Ubora’s optimizations. Specifically, this implementation disables node-local timeouts that reduce network bandwidth.
-
Query tagging and caching essentially implements Ubora at the application level. Here, we implement context tracking by changing the OLDI service’s source code so that each query accepts a timeout parameter. Further, we set up a query cache to reuse computation from online execution. This approach is efficient but requires invasive changes.
-
Query tagging implements context tracking at the application level but disables memoization.
-
Timeout toggling eschews both context tracking and memoization. This implementation increases each component’s global timeout settings by 4X for mature executions. All concurrent query executions also have increased timeout settings. This is non-invasive because most OLDI components support configurable timeout policies. However, extending timeouts for all queries is costly.
V-C OLDI Services
Table I describes each OLDI service used in our evaluation. In the rest of this paper, we will refer to these services using their codename. The setup shown in Figure 2 depicts LC.all, a 31 node cluster that supports 16 GB DRAM cache per TB stored on disk. Each component runs on a dedicated node comparable to an EC2 medium instance, providing access to an Intel Xeon E5-2670 VCPU, 4GB DRAM, 30 GB local storage and (up to) 2 TB block storage.
-
YN.bdb uses Hadoop/Yarn for sentiment analysis. Specifically, it runs query 18 in BigBench, a data analytics benchmark [15]. Each query spawns two parallel executions. The first sub-execution extracts sentiments from customer reviews over 2 months. The second covers 9 months. The 9-month execution returns the correct answer, but the 1-month answer is used after a 3-minute timeout. Each sub-execution flushes prior cached data in HDFS, restores a directory structures and compresses its output. As a result, query execution takes minutes, even though customer reviews are smaller than 1 GB. The average response time without timeout is 3 minutes. 44% of queries get the 9-month answer within timeout. We mainly include YN.bdb to show that Ubora can capture answer quality for longer running services too.
-
LC.big, LC.wik and LC.lit use Apache Lucene for bag-of-words search. All of these workloads replay popular query traces taken from Google Trends. LC.lit hosts 4GB of news articles and books on cluster with 16GB DRAM. LC.lit implements one parallel path shown in Figure 2. It returns the best answer produced within 1 second. Without timeouts, the average response time is 1.22 seconds. Over 83% of LC.lit queries complete within the timeout.
LC.wik hosts 128GB of data from Wikipedia, New York Times and TREC NLP [3]. After executing warm-up queries, the data mostly fits in memory. We set a 3-second timeout. Without the timeout, response time was 8.9 seconds. 39% of the LC.wik queries complete within the timeout. LC.big hosts 4TB. Most queries access disk. Average response time without timeout is 23 seconds. The timeout is 5-seconds.
-
ER.fst uses the EasyRec platform to recommend Netflix movies. It compiles two recommendation databases from Netflix movie ratings [2]: A 256MB version and a 2GB version. Each query provides a set of movie IDs that seed the recommendation engine. The engine with more ratings normally takes longer to respond but provides better recommendations. Query execution times out after 500 milliseconds. 80% of query executions produce the 2GB answer.
-
OE.jep uses OpenEphyra, a question answering framework [1]. OpenEphyra uses bag-of-words search to extract sentences in NLP data related to a query. It then compares each sentence to a large catalog of noun-verb templates, looking for specific answers. The workload is computationally intensive. The average response time in our setup was 23 seconds. Motivated by the responses times for IBM Watson, we set a timeout of 3 seconds [10]. Fewer than 15% of queries completed within timeout.
We set up a workload generator that replayed trace workloads at a set arrival rate. Our workload generator kept CPU utilization between 15–35%.
V-D Results
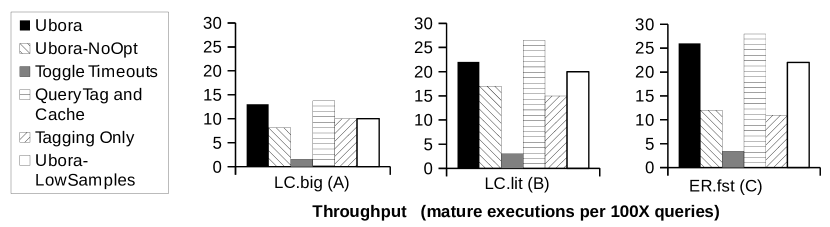
Comparison to Competing Approaches: Figure 5 compares competing approaches in terms of mature executions completed per query. Ubora-NoOpt reveals that node-local timeouts and just-in-time query propagation collectively improve throughput by 1.6X, 1.3X and 2.1X respectively. ER.fst has relatively fast response times which require messages to turn off record and replay modes. Node-local timeouts reduce these costs. Internal component communications in LC.big and LC.wik also benefit from node-local timeouts.
Excluding Ubora, the other competing approach that can be implemented for a wide range of services is toggling timeouts. Unfortunately, this approach performs poorly, lowering throughput by 7-8X. To explain this result, we use a concrete example of a search for “Mandy Moore” in LC.big. First, we confirm that both Ubora and toggling timeouts produce the same results. They produce the same top-5 results and 90% of the top-20 results overlap. Under 5-second timeout, the query times out prematurely, outputting only 60% of top-20 results. Ubora completes mature executions faster because it maintains execution context. This allows concurrent queries to use different timeout settings. Queries operating under normal timeouts free resources for the mature execution. Further, per-component processing times vary within mature executions (recall, Figure 3). By maintaining execution context, Ubora avoids overusing system resources. For the “Mandy Moore” query, Ubora’s mature execution took 21 seconds in record mode and 4 seconds in replay mode. Conversely, under the toggle timeouts approach, service times for all concurrent queries increased by 4X, exceeding system capacity and taking 589 seconds.
We also compared Ubora, a systems level approach that strives to transparently support a wide range of services, to application-level approaches. Application-level approaches can track query context efficiently by tagging queries as they traverse the system [11]. Specifically, we modified LC.big, LC.lit and ER.fst to pass query context on each component interaction. Further, we implemented a query cache for targeted query interactions [6, 17, 28]. Our cache uses the Ubora’s mechanism for memoization but tailors it to specific inter-component interactions and context ids. As such, our application-level approach is expected to outperform Ubora, and it does. However, Ubora is competitive, achieving performance within 16% on all applications. We also compared to a simple application-level approach that disables query caching. This approach shows that memoization improves throughput by 1.3X on LC.big, 1.7X on LC.lit and 2.5X on ER.fst. The benefit provided by memoization is correlated with the ratio of mature execution times to online execution times. In ER.fst, mature executions are mostly repeating online executions.
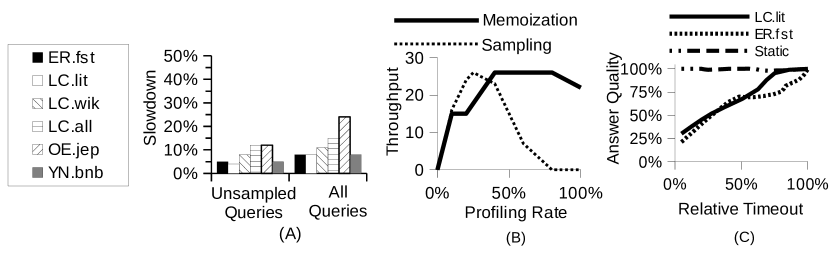
Impact on Response Time: Ubora allows system managers to control the query sampling rate. As shown in Figure 5, a slight reduction in the sampling rate can still achieve high throughput. However, this approach significantly reduces Ubora’s effect on response time. Figure 6(A) shows the slowdown caused by the Ubora-LowSamples approach across all tested workloads. By executing mature executions in the background and staying within processing capacity, we achieve slowdown below 13% on all workloads for unsampled queries and below 10% on 4 of 6 workloads for sampled queries. OpenEphyra and LC.all incur the largest overhead because just-in-time context interposes on many inter-component interactions due to cluster size. For such workloads, OS-level context tracking would improve response time for sampled queries.
Impact of Profiling: Figure 6(B) studies our approach to determine sampling rate and front-end components (i.e., memoization). We studied the ER.fst workload. Along the x-axis, we vary the sampling rate and the percentage of components included as front-end of middle components. The y-axis shows the achieved throughput. For the ER.fst workload it is better to apply memoization to many components. The ideal sampling rate was 20%.
Studying Answer Quality: Figure 6(C) shows answer quality (i.e., the true positive rate) as we increase timeout settings. For LC.lit and ER.fst, we increase timeouts at front-end components. We also validate our results by increasing timeouts in an unrelated component in ER.fst (Static). We observe that answer quality is stable in the static setting. Further, answer quality curves differ between applications. After timeout settings reach 600 milliseconds for LC.lit and 300 milliseconds for ER.fst, the curves diverge and answer quality increase slowly for ER.fst. Finally, answer quality curves have 2 phases in LC.lit and 3 phases in ER.fst. It is challenging to use timeouts to predict answer quality.
VI Online Management
OLDI services are provisioned to provide target response times. In addition to classic metrics like response time, these services could use answer quality to manage resources. We show here that Ubora enables better resource management through answer quality.
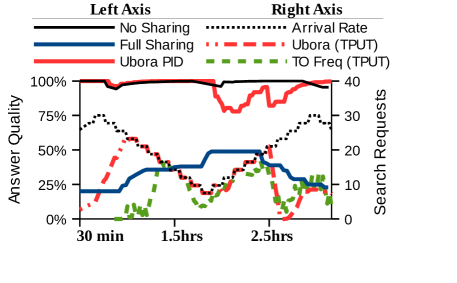
Control Theory with Answer Quality: We studied load shedding on the LC.big workload. Using diurnal traces from previous studies [34], we issued two classes of queries: high and low priority. The queries were directed to two different TCP ports. At the peak workload, low and high priority arrival rates saturate system resources (i.e., utilization is 90%). Figure 7 shows the Arrival Rate over time (on the right axis). At the 45 minute and 2 hour mark, the query mix shifts toward multiple word queries that take longer to process fully.
We used Ubora to track answer quality for high priority queries. When quality dipped, we increased the load shedding rate on low priority queries. Specifically, we used a proportional-integral-derivative (PID) controller. Every 100 requests, we computed answer quality from 20 sampled queries (20% sample rate).
The left axis of Figure 7 shows answer quality of competing load shedding approaches. When all low priority queries are shed, the No Sharing approach maintains answer quality above 90% throughout the trace. When shedding is disabled, the Full Sharing approach sees answer quality drop as low as 20%, corresponding with peak arrival rates. The PID controller powered by Ubora manages the shed rate well, keeping answer quality above 90% in over 90% of the trace. It maintains throughput (Ubora TPUT) of almost 60% of low priority queries (shown on the right axis).
The state of the art for online management in OLDI services is to use proxies for the answer quality metric. Metrics like the frequency of timeouts provide a rough indication of answer quality and are easier to compute online [20]. For comparison, we implemented a PID controller that used frequency of timeouts instead of answer quality. We tuned the controller to achieve answer quality similar to the controller based on answer quality. However, timeout frequency is a conservative indicator of answer quality for Lucene workloads. It assumes that partial results caused by timeouts are dissimilar to mature results. Figure 7 also shows that the controller based on timeout frequency (TO Freq) sheds requests too aggressively. Our approach improved throughput on low priority queries by 37%.
Sampling Rate and Representativeness: Ubora allows reducing the overhead of mature executions by sampling online executions. This lowers mature results per query, but how many mature results are needed for online management? We observed that sampling 5% of online queries significantly increased outlier errors on answer quality, but our adaptive load shedding remained effective—it still achieved over 90% quality over 90% of the trace. In contrast, a 2% sampling produced many quality violations.
VII Related Work
Ubora focuses on online systems, which trade answer quality for fast response times. Zilberstein first characterized similar applications as anytime algorithms [36]. Like the online, data-intensive workloads used with Ubora, anytime algorithms increase in quality of result as they increase in computation time. Zilberstein uses three metrics, certainty, accuracy, and specificity; accuracy is closest to our answer quality metric, but does not indicate how the exact answer is to be reached for comparison. His work indicates that anytime algorithms should have measurable quality, monotonically increase in quality as computation time increases, provide diminishing returns, and produce a correct answer when interrupted. Properties of anytime algorithms that Ubora does not need to work correctly include recognizable quality and being able to suspend and resume application processing at any point in time. Recognizable quality refers to ability to determine the optimal answer in constant time for online processing; Ubora decreases the total time to acquire a mature execution by reducing data access times, but does not interfere with the processing of this data by software components.
Recent work has focused on introducing approximation into existing systems in order to increase performance [16, 21, 20]. Goiri et al. created ApproxHadoop [16] to integrate sampling of input data, user-defined approximate code versions, and execution of only a subset of tasks into Hadoop. The authors allow users to set error bounds within a confidence interval, set a specific data sampling ratio, or specify the percentage of tasks to drop in order to increase performance. ApproxHadoop uses extreme value theory and multi-stage sampling theory to compute error bounds and confidence intervals depending on type of aggregation query. Our work with Ubora uses mature executions to compute answer quality, and enables users to similarly manage resources based on the online answer quality trace. Jeon et al. worked on intra-query parallel index search within a Bing server [21]. Sequential search may terminate early on a server if the processing of the ranked documents goes below a certain relevance. Since parallel search over the same index will generally result in more processing per query, the authors reduce this wasted work by keeping the order in which documents are processed sequential. While this is not necessary under low load, higher loads are more impacted by wasted work. The authors adaptively change the amount of parallelism per query based on the current system load. Jalaparti et al. introduced Kwiken, their optimization framework for lowering tail latency in Bing [20]. Techniques the authors used within Kwiken include allowing return of incomplete results, reissuing queries that lag on different servers, and increasing apportioned resources. They calculate incompleteness as utility loss based on whether the answer returned contains the highest ranked document for certain stages, and in other stages this is the percentage of parallel components that had not responded. In order to apportion utility loss as a resource, the authors use a budget constraint of 0.1% average utility loss across the cluster. Our work differs from their solution in that we focus on speeding up the mature execution with which to produce answer quality. Additionally, our framework provides for provisioning of other resources based on answer quality.
Work has also been done to reduce energy cost using approximate computing [30, 7]. At the application and compiler level, EnerJ [30] extends Java to include support for typed, approximate computing. Baek and Chilimbi created Green [7] specifically to replace loops and functions with approximate versions, but do so cautiously—they require the programmer to supply the approximate versions of the loops and functions, as well as the quality-of-service where they would prefer to run their application. Baek and Chilimbi expose an interface to the programmer to replace loops and functions with approximations of the same [7]. Green offers statistical guarantees that the Quality of Service desired by the programmer will be met. However, it is left up to the programmer to provide approximate functions as replacements. In the case of loops, it is left up to the programmer to provide a quality-of-service function for early termination. Green uses the output of a function compared to the output of the corresponding non-approximate function to determine the loss in quality-of-service, unless told otherwise. Using the programmer-specified inputs and functions, Green does a first-pass run of the application to determine expected loss in quality-of-service. Before processing the full application, Green uses the information gathered from this first pass to generate a version which only uses approximation when doing so is not expected to violate the user-specified quality-of-service request [7]. The authors of EnerJ [30] combine approximate storage, approximate algorithms, and approximate computation into an easy to program interface, which separates data that requires precision from data that is allowed to be approximate. EnerJ is an extension to Java that uses approximate computing to reduce the energy consumed by a user program. The mechanism they use to keep precise data distinct from approximate data is a system of type qualifiers that allows the programmer to specify portions of their code which can be approximated without damaging quality of service. Data can be identified as permissively approximate by using a specific type identifier. It is then impossible to assign approximate values to the default precisely typed variables without endorsing these assignments explicitly. Operations are made approximate by overloading operators, and specifying that only approximately typed variables may use said approximate operators. As with overloaded operators, programmers can also specify two different algorithms for any function, one precise and one approximate, and use typing to force use of the approximate algorithm when the function results are assigned to an approximate variable. EnerJ seeks to directly reduce energy cost using approximate computing, but neither directly quantifies the effect of its approximate computing mechanisms on overall application answer quality. EnerJ computes application-specific quality-of-service error offline for its results section [30]. Ubora can be used to reduce energy use of an application while keeping the answer quality at a target level. This is possible because the online answer quality trace can be used to trigger modifications to system variables such as timeouts, load shedding, reduction in auto-scaling, and DVFS scaling, all based on preset target answer quality levels.
Approximate computing is also used to tailor content for specific clients [22, 13, 8, 23]. DICE [22] focuses on the challenges of distributed system building for exploring data cubes interactively. Ad-hoc analytics have been growing in popularity with end users, but the delays involved are heightened when directed at data represented as a CUBE. The framework the authors built uses speculative execution, data subsets, and faceted data cube exploration. The authors aim to deliver sub-second latencies on queries which access distributed data from billion-tuple cubes, without keeping the entire data cube in fast cached memory or using offline data sampling, which does not update in real time. This work takes advantage of the observation that queries seldom happen in a vacuum, and tend to instead be one of several related queries. In between executing queries, the authors use wait time to speculatively execute the queries most likely to be asked next, and cache these results. This work also implements timeouts on total query execution, so that even if only one of the data shards is assembled in post processing, some answer will be available. Thirdly, the work in this paper used sampling, increasing the data sampling rates for the most likely speculative queries found [22]. This paper is very similar in two ways to Ubora, in that we also uses cached data from queries hidden from the user. CUBE uses this cached data to improve the latencies of further queries within a user session. In our work, we have explored the possibility of improving user latency using cached results of mature executions, but our primary focus has been on using this data to measure answer quality. CUBE is optimized to use sampled data to reduce the amount of resources spent running speculative queries. In contrast, Ubora uses complete data for the queries it hides from the user, but only performs such mature executions for sampled queries. Fox et al. show how a proxy-based approach could dynamically scale quality of web results across different end platforms [13]. Their work uses lossy compression to distil specifically typed information down to the portions with semantic value. Their proxy adapts on demand to fit the needs of a client. A high end desktop machine can support downloading a larger number of bytes over the network than a smart phone; reducing the number of bytes necessary to download in order to view the page benefits such mobile devices. In contrast to our work, Fox et al. accesses a mature execution from a web server and approximates this data to meet the needs of a range of client platforms. We instead focus on services that provide online results, and measure the amount of approximation present. Chen et al. use a thumbnail sized image of each web page as a table of contents for simplified browsing [8]. For pages in which splitting content into blocks is not feasible, the authors use the table of contents image to enable automatic positioning of the full-size web page on the mobile screen. Their methods introduce error in 10% of tested web pages in order to simplify the viewing of all on mobile screens. As in our work, Kephart and Lenchner focus on online data-intensive computations occurring across multiple components working together [23]. While we measure the answer quality of online system responses, their work displays interpreted system responses to the user and corrects computations when the user indicates incorrect analysis.
Our work focuses on data-intensive applications, and uses application-specific similarity metrics to study answer quality. SocialTrove also focuses on data-intensive applications. Instead of measuring answer quality, SocialTrove uses application-specific similarity metrics to automatically cluster and summarize social media data [5].
Other works have focused on scheduling to increase answer quality and throughput [19, 18, 29, 35]. He et al. use a budget consisting of total execution time for current queries to determine whether and how long to schedule a query [19]. Their work uses a feedback mechanism to help ensure the desired response times are being met, and an optimization procedure to schedule based on request service demands and response quality profiles. Their algorithm takes advantage of prior knowledge regarding the overall concave quality profile of Microsoft Bing to estimate the individual request quality profile, rather than attempting to measure request quality with a mature execution. Zeta [18] was designed to better schedule requests in online servers for high response quality and low response quality variance [18]. Zeta focuses on online services that produce partial results under a deadline, where additional computation time produces diminishing returns in additional response quality. Their response quality, like our answer quality, uses an application-specific metric to compare a partially executed request to a full execution. They measure their response quality offline. Ren et al. explored how heterogeneous processors can execute long requests on faster cores and shorter requests on slow cores to achieve high throughput and high quality [29]. The authors implemented a new algorithm, FOF, which focuses on requests where service demands are unknown. These new requests are scheduled on the fastest idle core. Then, requests are migrated from slow cores to faster cores as necessary. This algorithm can improve answer quality and throughput in heterogeneous processors as compared to homogeneous processors with the same power budget. The authors used Bing without deadlines in a controlled setting to produce mature executions, and then used this data in their simulation study. We also improve metrics using adaptive resource management based on answer quality, but Ubora produces mature executions online. Zheng et al. wrote a deadline-agnostic scheduler ISPEED for anytime algorithm workloads [35]. Their scheduler focuses on maximizing total utility over all jobs in the cluster, and ignores concerns regarding individual query deadlines. In addition to the utility functions used in [19, 18], Zheng et al. also performed a user study for the Google search engine to find its average utility function [35].
Also highly related to Ubora is the area of adaptive resource allocation [33, 14, 24]. Spinner et al. present their library for estimating resource demands with seven different approaches [33]. Using their library, it is possible to control how often the resource use is sampled, when and for how long to perform the estimate. In general terms, Ubora also supports estimation of resource demand for mature executions. Gandhi et al. show that their new autoscaling cloud service, DC2, can learn an application’s system parameters and scale based on its understanding of resource requirements [14]. The authors’ solution attempts autoscaling applications without direct knowledge of their needs, instead relying on user-specified SLA information, virtual cpu statistics, and knowledge of request URLs. Like Ubora, DC2 is mostly transparent, with key information provided by the user. However, DC2 focuses directly on autoscaling rather than providing a solution for processing mature executions online. Lama and Zhou describe their implementation of an automated resource provisioning system [24]. Their system, AROMA, targets quality of service while minimizing cost, using allocation of resources in a heterogeneous cloud and Hadoop parameter configurations. However, instead of directly profiling each workload and regulating resources based on answer quality, AROMA profiles each workload for a short time on a staging cluster before matching the workload’s signature to a cluster of workloads with a set of associated resources.
VIII Conclusion
OLDI queries have complex and data-parallel execution paths that must produce results quickly. Data used by each query is skewed across data partitions, causing some queries to time out and return premature results. Answer quality is a metric that assesses the impact of timeouts on the quality of results. It is challenging to compute online because it require results from mature executions that are unaffected by timeouts. This paper describes Ubora, an approach to speed up mature executions by reusing intermediate computations from online queries, i.e., memoization. Ubora adopts a challenging systems-level approach that allows us to measure answer quality for a wide range of services. Our implementation includes novel context tracking for commodity operating systems and bandwidth optimizations. The evaluation shows that Ubora produces mature results faster than competing transparent approaches and nearly as fast as less flexible, application-specific approach. Most importantly, Ubora produces answer quality quickly enough to enhance online system management.
IX Addendum
Availability: An extended version of this paper, Ubora’s source code and executable images of our OLDI workloads are available at: http://www.cse.ohio-state.edu/~kelleyj/ubora.html.
Acknowledgements: This work was supported by NSF grants CAREER CNS-1350941 and CNS-1320071, and also by the Oak Ridge Leadership Computing Facility managed by UT Battelle, LLC for the U.S. DOE (contract No. DE-AC05-00OR22725).
References
- [1] The ephyra question answering system. http://www.ephyra.info/.
- [2] Netflix prize. http://www.netflixprize.com//index.
- [3] Technology laboratory’s (itl) retrieval group. http://trec.nist.gov/data.html, 2014.
- [4] Wikipedia:modelling wikipedia’s growth. http://en.wikipedia.org/wiki/Wikipedia:Modelling_Wikipedias_growth, 2014.
- [5] M. Amin, S. Li, M. R. Rahman, P. T. Seetharamu, S. Wang, T. Abdelzaher, I. Gupta, M. Srivatsa, R. Ganti, R. Ahmed, and H. Le. Socialtrove: A self-summarizing storage service for social sensing. In International Conference on Autonomic Computing, 2015.
- [6] C. Amza, G. Soundararajan, and E. Cecchet. Transparent caching with strong consistency in dynamic content web sites. In Proceedings of the 19th annual international conference on Supercomputing, pages 264–273. ACM, 2005.
- [7] W. Baek and T. M. Chilimbi. Green: A framework for supporting energy-conscious programming using controlled approximation. In PLDI, 2010.
- [8] Y. Chen. Detecting web page structure for adaptive viewing on small form factor devices. In WWW, 2003.
- [9] R. Falsett, R. Seyer, and C. Siemers. Limitation of the response time of a software process, Dec. 29 2004. WO Patent App. PCT/EP2003/000,721.
- [10] D. Ferrucci, E. Brown, J. Chu-Carroll, J. Fan, D. Gondek, A. Kalyanpur, A. Lally, J. Murdock, E. Hyberg, J. Prager, N. Schlaerfer, and C. Welty. The ai behind watson—the technical article. In The AI Magazine, 2010.
- [11] R. Fonseca, G. Porter, R. H. Katz, S. Shenker, and I. Stoica. X-trace: A pervasive network tracing framework. In USENIX NSDI, 2007.
- [12] B. Forrest. Bing and google agree: Slow pages lose users. radar.oreilly.com, 2009.
- [13] A. Fox, S. D. Gribble, Y. Chawathe, and E. A. Brewer. Adapting to network and client variation using infrastructural process proxies: lessons and perspectives. Personal Communications, 5:10–19, 1998.
- [14] A. Gandhi, P. Dube, A. Karve, A. Kochut, , and L. Zhang. Adaptive, model-driven autoscaling for cloud applications. In International Conference on Autonomic Computing, 2014.
- [15] A. Ghazal, T. Rabl, M. Hu, F. Raab, M. Poess, A. Crolotte, and H. Jacobsen. Bigbench: Towards an industry standard benchmark for big data analytics. In ACM SIGMOD, 2013.
- [16] I. Goiri, R. Bianchini, S. Nagarakatte, and T. Nguyen. Approxhadoop: Bringing approximations to mapreduce frameworks. In ACM ASPLOS, 2015.
- [17] Y. Guo, P. Lama, J. Rao, and X. Zhou. V-cache: Towards flexible resource provisioning for multi-tier applications in iaas clouds. In International Symposium on Parallel and Distributed Processing, 2013.
- [18] Y. He, S. Elnikety, J. Larus, and C. Yan. Zeta: scheduling interactive services with partial execution. In SOCC, 2012.
- [19] Y. He, Z. Ye, Q. Fu, and S. Elnikety. Budget-based control for interactive services with adaptive execution. In International Conference on Autonomic Computing, 2012.
- [20] V. Jalaparti, P. Bodik, S. Kandula, I. Menache, M. Rybalkin, and C. Yan. Speeding up distributed request-response workflows. In SIGCOMM, 2013.
- [21] M. Jeon, Y. He, S. Elnikety, A. Cox, and S. Rixner. Adaptive parallelization of web search. In EuroSys Conf., 2013.
- [22] N. Kamat, P. Jayachandran, K. Tunga, and A. Nandi. Distributed interactive cube exploration. In ICDE, 2014.
- [23] J. Kephart and J. Lenchner. A symbiotic cognitive computing perspective on autonomic computing. In International Conference on Autonomic Computing, 2015.
- [24] P. Lama and X. Zhou. Aroma: Automated resource allocation and configuration of mapreduce environment in the cloud. In Proceedings of the 9th International Conference on Autonomic Computing, International Conference on Autonomic Computing, 2012.
- [25] J. Lenchner. Knowing what it knows: selected nuances of watson’s strategy. http://ibmresearchnews.blogspot.com.
- [26] Lucid Imagination. The case for lucene/solr: Real world search applications. White Paper, 2008.
- [27] C. Manning, P. Raghavan, and H. Schütze. Introduction to Information Retrieval. Cambridge University Press, 2008.
- [28] J. Paiva, P. Ruivo, P. Romano, and L. Rodrigues. Autoplacer: Scalable self-tuning data placement in distributed key-value stores. In International Conference on Autonomic Computing, 2013.
- [29] S. Ren, Y. He, S. Elnikety, and K. McKinley. Exploiting processor heterogeneity in interactive services. In International Conference on Autonomic Computing, 2013.
- [30] A. Sampson, L. Ceze, and D. Grossman. Enerj, the language of good-enough computing, 2013.
- [31] K. Shen, A. Shriraman, S. Dwarkadas, X. Zhang, and Z. Chen. Power containers: An os facility for fine-grained power and energy management on multicore servers. In ACM ASPLOS, 2012.
- [32] B. Sigelman, L. Barroso, M. Burrows, P. Stephenson, M. Plakal, D. Beaver, S. Jaspan, and C. Shanbag. Dapper, a large-scale distributed systems tracing infrastructure. In Google Technical Report, 2010.
- [33] S. Spinner, G. Casale, X. Zhu, and S. Kounev. Librede: A library for resource demand estimation. In Proceedings of the 5th ACM/SPEC International Conference on Performance Engineering, 2014.
- [34] C. Stewart, T. Kelly, and A. Zhang. Exploiting nonstationarity for performance prediction. In EuroSys Conf., Mar. 2007.
- [35] Y. Zheng, B. Ji, N. Shroff, and P. Sinha. Forget the deadline: Scheduling interactive applications in data centers. In CLOUD, 2015.
- [36] S. Zilberstein. Using anytime algorithms in intelligent systems. AI Magazine, 17(3), 1996.