NuSTAR Reveals Extreme Absorption in Type 2 Quasars
Abstract
The intrinsic column density () distribution of quasars is poorly known. At the high obscuration end of the quasar population and for redshifts , the X-ray spectra can only be reliably characterized using broad-band measurements which extend to energies above keV. Using the hard X-ray observatory NuSTAR, along with archival Chandra and XMM-Newton data, we study the broad-band X-ray spectra of nine optically selected (from the SDSS), candidate Compton-thick ( cm-2) type 2 quasars (CTQSO2s); five new NuSTAR observations are reported herein, and four have been previously published. The candidate CTQSO2s lie at , have observed [O III] luminosities in the range , and show evidence for extreme, Compton-thick absorption when indirect absorption diagnostics are considered. Amongst the nine candidate CTQSO2s, five are detected by NuSTAR in the high energy (– keV) band: two are weakly detected at the confidence level and three are strongly detected with sufficient counts for spectral modeling ( net source counts at – keV). For these NuSTAR-detected sources direct (i.e., X-ray spectral) constraints on the intrinsic AGN properties are feasible, and we measure column densities – times higher and intrinsic (unabsorbed) X-ray luminosities – times higher than pre-NuSTAR constraints from Chandra and XMM-Newton. Assuming the NuSTAR-detected type 2 quasars are representative of other Compton-thick candidates, we make a correction to the distribution for optically selected type 2 quasars as measured by Chandra and XMM-Newton for objects. With this approach, we predict a Compton-thick fraction of , although higher fractions (up to ) are possible if indirect absorption diagnostics are assumed to be reliable.
Subject headings:
galaxies: active – galaxies: nuclei – quasars – X-rays1. Introduction
Much of the cosmic growth of supermassive black holes is thought to occur during a phase of luminous, heavily obscured accretion: an obscured quasar phase (e.g., Fabian, 1999; Gilli et al., 2007; Treister et al., 2009). However, our current census of obscured quasars appears highly incomplete. While unobscured quasars were first discovered over 50 years ago (Schmidt, 1963; Hazard et al., 1963), it is only in the last decade that (radio-quiet) obscured quasars have been discovered in large numbers (e.g., Zakamska et al., 2003; Hickox et al., 2007; Reyes et al., 2008; Stern et al., 2012; Assef et al., 2013; Donoso et al., 2013). Furthermore, it is only very recently that the most heavily obscured Compton-thick (with absorbing column densities of cm-2; hereafter CT) quasars have begun to be robustly identified at X-ray energies (e.g., Comastri et al., 2011; Gilli et al., 2011; Gandhi et al., 2014; Lanzuisi et al., 2015a).
Identifying and characterizing heavily obscured quasars is important for various reasons. Firstly, many less luminous AGNs in the local Universe appear to be CT (– of the total population; e.g., Risaliti et al. 1999; Burlon et al. 2011). While observational constraints are challenging for distant quasars, a significant population of luminous CT AGNs are expected from models of the cosmic X-ray background (CXB) spectrum (e.g., Comastri et al., 1995; Gilli et al., 2007; Treister et al., 2009; Draper & Ballantyne, 2010; Akylas et al., 2012; Ueda et al., 2014). Secondly, while the orientation-based unified model (e.g., Antonucci, 1993; Urry & Padovani, 1995) can account for the relative fractions of unobscured, obscured and CT AGNs observed in the local Universe, it is unclear whether a unified model or some evolutionary scenario (e.g., Sanders et al., 1988; Hopkins et al., 2008) is more appropriate at higher luminosities and redshifts. Indeed, the observed dependence of AGN obscuration on luminosity suggests a departure from the unified model (e.g., Ueda et al. 2003; Simpson 2005; Treister et al. 2010; Iwasawa et al. 2012; Assef et al. 2014; Buchner et al. 2015; Lacy et al. 2015). The above issues can be addressed using X-ray studies which aim to measure the column density () distribution and CT fraction of obscured quasars, important components of CXB models and important tools for understanding AGN models (e.g., Fabian et al., 2009; Draper & Ballantyne, 2010).
X-ray studies of heavily obscured quasars are extremely challenging. For instance, to-date very few optically selected obscured quasars (i.e., “type 2” quasars or “QSO2s”; the definition of this term is provided in Section 2.1) have been unambiguously confirmed as CT using broad-band X-ray measurements extending to high energies ( keV; e.g., Gandhi et al. 2014). Including the high-energy data is crucial. Firstly, the number of counts is inherently low at keV, due to photoelectric absorption of the X-ray continuum, which restricts the accuracy of X-ray spectral modeling and may lead to an underestimate of the absorbing column density and intrinsic luminosity. Secondly, important diagnostic features can be missed if the observed X-ray energy window is narrow. Such features include the photoelectric absorption cut-off (e.g., at keV for a AGN absorbed by cm-2 gas), and features of Compton reflection/scattering from cold, dense gas. The latter become prominent when CT levels of photoelectric absorption deeply suppress the primary continuum, revealing strong Fe K fluorescent line emission at keV and a Compton reflection “hump” at keV (e.g., George & Fabian, 1991), and may arise from an extended structure such as the torus of the unified model (e.g., Ghisellini et al., 1994).
NuSTAR (Harrison et al., 2013), launched in June 2012, has further opened our window on the X-ray spectra of obscured AGNs, with sensitivity up to keV. As the first orbiting observatory to focus high-energy ( keV) X-rays, it provides a two orders of magnitude improvement in sensitivity and over an order of magnitude improvement in angular resolution relative to the previous-generation keV observatories. Recent studies have demonstrated that, in the case of heavily obscured quasars, the most accurate constraints on the absorbing column density and intrinsic X-ray luminosity come from a combination of both NuSTAR and XMM-Newton/Chandra data, which provide the broadest possible energy band pass for X-ray spectral modeling (e.g., Luo et al., 2013; Baloković et al., 2014; Del Moro et al., 2014; Lansbury et al., 2014; Gandhi et al., 2014).
In this paper, we extend the work of Lansbury et al. (2014; hereafter L14) and Gandhi et al. (2014; hereafter G14), using NuSTAR to study the high-energy emission of SDSS-selected QSO2s which are candidates for being CT (i.e., candidate “CTQSO2s”). The targets were initially selected based on [O III] 5007 line emission (Zakamska et al., 2003; Reyes et al., 2008), thought to be an unbiased indicator of intrinsic AGN power (e.g., Heckman et al. 2005; LaMassa et al. 2010; but see also Hainline et al. 2013), and subsequently identified as CT candidates within the detection capabilities of NuSTAR using the low-energy X-ray data available (e.g., Jia et al., 2013). L14 looked at an exploratory sample of three – candidate CTQSO2s: one was weakly detected and shown to have a high column density of cm-2; the remaining two were undetected but shown to have suppressed X-ray luminosities in the high-energy regime, suggestive of CT absorption. G14 showed the lower redshift object SDSS J1034+6001 (also known as Mrk 34; ) to have a column density and intrinsic power an order of magnitude greater than those measured with the pre-NuSTAR X-ray data, unambiguously revealing the object to be a CTQSO2.
We present new results for a further five targets, bringing the NuSTAR-observed SDSS-selected candidate CTQSO2 sample to a total size of nine objects. For the brightest two sources we model the broad-band X-ray spectra, for one weakly detected source we characterize the spectrum using the X-ray band ratio, and for all targets (including non-detections) we use the X-ray:mid-IR ratio to infer the intrinsic AGN properties. The paper is organised as follows: Section 2 details the sample selection; Section 3 describes the X-ray and multiwavelength data, along with data reduction and analysis procedures; Section 4 presents the results of X-ray spectral and multiwavelength analyses; and Section 5 discusses the results for the full sample of nine NuSTAR-observed candidate CTQSO2s in the context of the parent QSO2 population, including an estimation of the distribution and CT fraction for . The cosmology adopted is (, , ) = (0.27, 0.73, 0.71). Uncertainties and limits quoted throughout the paper correspond to the confidence levels (CL), unless otherwise stated.
2. The QSO2 Sample
2.1. Definitions
Quasars are rapidly accreting black holes which emit large amounts of radiation, and have luminosities which typically place them above the knee of AGN luminosity function. Multiple thresholds exist in the literature for separating quasars from less luminous AGNs (e.g., “Seyferts”). According to the classical threshold of Schmidt & Green (1983), quasars are those objects with absolute –band magnitudes of . Thus far we have used the term “obscured” rather loosely, since it has different implications depending on the wavelength regime in question. In the optical band, objects are identified as obscured if they show narrow line emission without broad (e.g., H or H) components, a result of the central broad line region being hidden from the observer. These objects are classed as type 2s, or QSO2s if the luminosity is at quasar levels (in type 1s the broad line components are visible). At X-ray energies, objects are identified as obscured or “absorbed” if their X-ray continua show evidence for being absorbed by gas along the line-of-sight, with column densities of cm-2. The objects in this work originate from a sample of optically-identified QSO2s (Zakamska et al., 2003; Reyes et al., 2008). Several X-ray studies at keV have now provided evidence that these optically-identified QSO2s are also absorbed at X-ray energies, with many objects showing indirect evidence for being absorbed by column densities in excess of cm-2 (i.e., CT columns; Vignali et al. 2006, 2010; Jia et al. 2013). In this paper we look at the direct evidence for CT absorption in these optically-identified QSO2s, from X-ray analyses which incorporate spectral information at keV.
2.2. Sample Selection
When selecting a sample of obscured quasars to observe at X-ray energies, it is important to select based on an indicator of the intrinsic AGN luminosity such that the sample is unbiased and as representative of the general population as possible. The [O III] 5007 line, one of the strongest emission lines readily visible in the optical, is a suitable choice since such emission arises from gas on large ( pc) scales, minimizing the effect of nuclear obscuration. Reyes et al. (2008, hereafter R08; see also Zakamska et al. 2003) presented the largest sample of [O III]-selected QSO2s, consisting of objects selected from the SDSS. R08 defined quasars as having observed (i.e., not corrected for extinction) [O III] luminosities of , and identified the quasars as type 2s (i.e., QSO2s) following the standard optical definition. For comparison, the classical absolute magnitude cut of Schmidt & Green (1983, ) corresponds approximately to for type 1 sources (Zakamska et al., 2003). Subsequent Chandra and XMM-Newton studies (e.g., Ptak et al., 2006; Vignali et al., 2006, 2010; Jia et al., 2013; LaMassa et al., 2014) have investigated the soft X-ray ( keV) properties of subsamples of the R08 sample, with the largest subsample ( objects) investigated by Jia et al. (2013, hereafter J13). Figure 1 shows redshift versus for the R08 and J13 samples.
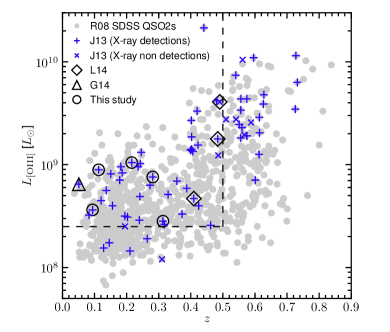
For our study, we select from the J13 sample. In order to infer information about the overall optically selected QSO2 population, we desire a parameter space for which the J13 sample is broadly representative of the R08 sample. As such we apply redshift and luminosity cuts of and , respectively (see Figure 1). For these and ranges: (1) the and distributions of the J13 sample and the R08 sample are consistent according to the Kolmogorov-Smirnov (KS) test ( and for and , respectively); (2) the majority () of the J13 sample are either serendipitous sources in the soft X-ray (Chandra and XMM-Newton) data or were targeted based on their [O III] properties, and should therefore be relatively unbiased with respect to the X-ray properties of the R08 sample. We exclude SDSS J0913+4056 (; ), since this infrared bright AGN is an extreme outlier and has been targeted for NuSTAR separately (D. Farrah et al., in preparation). The above cuts leave QSO2s from J13, of which are detected at keV (according to J13 and Vignali et al. 2006, 2010).
From the J13 subsample above, we first targeted an initial three candidate CTQSO2s at – (this subselection is described in L14). Since these three objects were weakly or not detected with NuSTAR, for the succeeding targets described herein greater consideration was given to the predicted NuSTAR – keV count rate.111The – keV band is the standard hard band defined for the NuSTAR extragalactic surveys (Alexander et al., 2013). The predictions were achieved by extrapolating from the keV data, assuming a variety of physically motivated torus models which cover a range of column densities ( cm-2). To the remainder of the J13 subsample above, we applied a cut in observed X-ray:[O III] luminosity ratio of (a conservative threshold for targeting the most obscured candidates; see section 4.5 in J13), which leaves CT candidates. From this selection, six objects were observed with NuSTAR, with preference being given to the objects with high – keV count rate predictions. These include the one object presented in G14 and the five presented in this paper, bringing the NuSTAR-observed SDSS-selected candidate CTQSO2 sample to a total size of nine objects.
In this work we present results for the five recently observed candidate CTQSO2s SDSS J0758+3923, 0840+3838, 1218+4706, 1243–0232 and 1713+5729. For the other four previously-studied objects (SDSS J0011+0056, 0056+0032, 1034+6001 and 1157+6003) the detailed reductions and data analyses are presented in L14 and G14. Redshifts and [O III] luminosities for the five new objects are listed in Table 1.
| NuSTAR Observations | Soft X-ray Observations | |||||||||
|---|---|---|---|---|---|---|---|---|---|---|
| Object Name | Observation ID | UT Date | Observatory | Observation ID | UT Date | |||||
| (1) | (2) | (3) | (4) | (5) | (6) | (7) | (8) | (9) | (10) | (11) |
| SDSS J075820.98+392336.0 | 0.216 | 9.02 | 60001131002 | 2014:255 | 48.3 | 41.2 | XMM-Newton | 0305990101 | 2006:108 | 9.1 |
| 0406740101 | 2006:295 | 14.2 | ||||||||
| SDSS J084041.08+383819.8 | 0.313 | 8.45 | 60001132002 | 2014:121 | 50.5 | 38.4 | XMM-Newton | 0502060201 | 2007:289 | 19.0 |
| SDSS J121839.40+470627.7 | 0.094 | 8.56 | 60001135002 | 2014:145 | 41.8 | 34.0 | XMM-Newton | 0203270201 | 2004:153 | 40.8 |
| 0400560301 | 2006:321 | 43.2 | ||||||||
| SDSS J124337.34–023200.2 | 0.281 | 8.88 | 60001136002 | 2014:211 | 55.5 | 46.0 | Chandra | 6805 | 2006:115 | 10.0 |
| SDSS J171350.32+572954.9 | 0.113 | 8.95 | 60001137002 | 2014:120 | 54.5 | 45.3 | XMM-Newton | 0305750401 | 2005:174 | 4.4 |
NOTE. – (1): Full SDSS object name. (2): Redshift. (3): Gaussian fit [O III] 5007 line luminosity [], as reported in R08. (4) and (5): NuSTAR observation ID and start date (YYYY:DDD), respectively. (6): Total on-source time (ks). (7): Effective on-axis exposure time (ks). This is the net value for the – keV band, and at the celestial coordinates of the target, after data cleaning. We have accounted for vignetting; despite the sources being “on-axis”, there is a small loss of exposure due to the natural dither of the observatory. (8), (9) and (10): Soft X-ray observatory with available data, corresponding observation ID(s) and start date(s) (YYYY:DDD), respectively. (11): Net on-axis, flaring-corrected exposure time(s) (ks). For XMM-Newton, the quoted value corresponds to the EPIC detector used with the longest net exposure time.
The low-energy ( keV) X-ray spectra have previously been characterized by J13, who fit the existing Chandra and XMM-Newton data with absorbed power law models. For SDSS J1218+4706, the column density constrained by J13 using this direct (i.e., X-ray spectral) approach is high, but less than CT ( cm-2). In the other four cases, the directly constrained column densities are comparatively low ( cm-2). This is in strong disagreement with the extremely low X-ray:[O III] ratios, which imply CT absorption. J13 recognised this, and thus used indirect diagnostics to estimate the absorption levels. The low measurements from direct spectral fitting can be explained as due to a combination of the limited energy ranges of Chandra and XMM-Newton, low source counts, and (especially in the case of SDSS J1713+5729; see Section 4.1.3 for further details) strong contamination at lower energies from other processes such as star formation, AGN photoionization, or scattered AGN emission. In the Appendix we give individual object information for the five candidate CTQSO2s presented in this paper, including relevant multiwavelength properties and indicators of heavy absorption. In addition, we comment on the single NuSTAR-detected candidate CTQSO2 from the exploratory study of L14 (SDSS J0011+0056), for which a close inspection of the soft X-ray data reveals strong Fe K emission.
3. Data
This section details the pointed NuSTAR observations and data analysis procedures for the five newly observed SDSS-selected candidate CTQSO2s (Section 3.1), which bring the NuSTAR-observed sample to a total of nine such objects. We also detail the archival Chandra and XMM-Newton data (Section 3.2), which facilitate a broad-band X-ray analysis when combined with the NuSTAR data. In addition, near-UV to mid-IR data from large-area surveys are presented in order to characterize the spectral energy distributions (SEDs) of the objects and disentangle AGN and host galaxy emission in the mid-IR (Section 3.3).
3.1. NuSTAR Data
The NuSTAR observatory is sensitive at – keV (Harrison et al. 2013). The combination of the instrumental background and decrease in effective area with increasing energy means that – keV is the most useful energy band for faint sources. NuSTAR consists of two telescopes (A and B), identical in design, the respective focal plane modules of which are referred to as FPMA and FPMB. The point-spread function (PSF) has a tight “core” of and a half-power diameter of .
Table 1 provides details, including dates and exposure times, for the most recent five NuSTAR observations of SDSS-selected candidate CTQSO2s. The data were processed as for the L14 sample, using the NuSTAR Data Analysis Software (NuSTARDAS) version 1.3.0. For the detected sources, the nuproducts task was used to extract spectra and response files. Following other recent NuSTAR studies (Alexander et al. 2013; L14; Luo et al. 2014), we perform photometry in the – keV, – keV, and – keV bands. The photometry is performed for each FPM separately and also for combined FPMA+FPMB data (referred to hereafter as “FPMA+B”), to increase sensitivity. For source detection, we use prior knowledge of the SDSS coordinates and calculate no-source probabilities assuming binomial statistics (), defining non detections as (i.e., ). For non detections we calculate upper limits on the net source counts using the Bayesian approach outlined in Kraft et al. (1991). For a detailed description of the source detection and aperture photometry procedures, we refer the reader to L14.
Table 2 summarizes the NuSTAR photometry.
| Object Name | Net Counts (– keV) | Net Counts (– keV) | Net Counts (– keV) | ||||||
|---|---|---|---|---|---|---|---|---|---|
| SDSS J | FPMA | FPMB | FPMA+B | FPMA | FPMB | FPMA+B | FPMA | FPMB | FPMA+B |
| 0758+3923 | |||||||||
| 0840+3838 | |||||||||
| 1218+4706 | |||||||||
| 1243-0232 | |||||||||
| 1713+5729 | |||||||||
NOTE. – NuSTAR net source counts for the candidate CTQSO2s. FPMA and FPMB are the individual focal plane modules belonging to the two telescopes which comprise NuSTAR. “FPMA+B” refers to the combined FPMA+FPMB data.
Two of the quasars, SDSS J1218+4706 and 1243–0232, are strongly detected; the net source counts for FPMA+B in the – keV band are and , respectively. Figure 2 shows the – keV no-source probabilities for the three fainter sources, SDSS J0758+3923, 0840+3838 and 1713+5729.
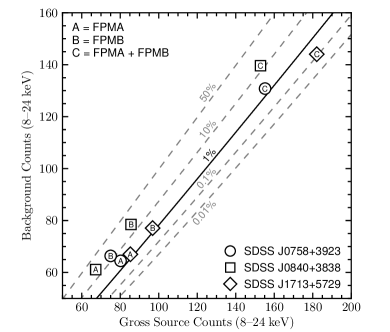
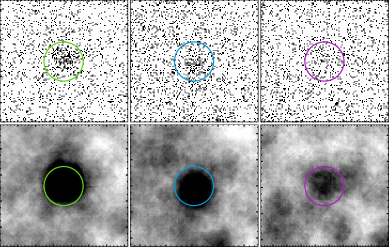
Poisson, rather than binomial, no-source probabilities have been adopted for the purposes of the figure only, to aid inter-object comparison; these provide a good approximation of the binomial no-source probabilities () since the background counts are large (Weisskopf et al., 2007). Although SDSS J0758+3923 is formally undetected at – keV, it is only just below the adopted detection threshold for this band and is weakly detected in the broader – keV energy band, but for FPMA only (). SDSS J0840+3838 is a non detection. SDSS J1713+5729 is weakly detected with FPMA+B for the – keV band only (). In general, the detected sources have more net source counts in the – keV band, where the focusing soft X-ray observatories (e.g., Chandra and XMM-Newton) have little to no sensitivity, than in the – keV band, where NuSTAR and the soft X-ray observatories overlap. This can occur for heavily obscured AGNs, which have extremely flat X-ray spectra and are therefore brighter at keV. Indeed, the single candidate CTQSO2 to be detected with NuSTAR in L14, SDSS J0011+0056, was only detected in the – keV band. NuSTAR FPMA+B – keV image cutouts for the three new targets detected in this energy band are shown in Figure 3.
None of these three sources are detected in the most sensitive Swift BAT all-sky catalogs (e.g., Baumgartner et al., 2013), and direct examination of the 104 month Swift BAT maps shows no excess above (for details of the maps and procedures, see Koss et al. 2013). Therefore, NuSTAR has provided the first real detections of these targets at high energies ( keV).
For the NuSTAR-detected sources, it is important to rule out confusion with and contamination from other nearby X-ray sources. Both of these are extremely unlikely: in the soft X-ray (Chandra and XMM-Newton) imaging of the NuSTAR-detected sources, the only neighbouring source detected within (i.e., the radial distance containing an encircled-energy fraction of for the NuSTAR PSF) of the SDSS positions lies at an angular separation of from SDSS J1218+4706 (i.e., outside our adopted source aperture radius) and is a factor of fainter in the XMM-Newton energy band.
Table 3 lists the aperture-corrected NuSTAR fluxes and rest-frame – keV luminosities (; uncorrected for absorption). The fluxes were obtained using photometry, assuming an effective photon index (i.e., for an unabsorbed power law model) of and using count rate to flux conversion factors which account for the NuSTAR response and effective area. Often (a typical value for the – keV emission of AGNs; e.g., Alexander et al. 2013) is assumed for such extrapolations, but the NuSTAR-detected candidate CTQSO2s have extremely flat observed spectral slopes at – keV (see Section 4), in agreement with in all cases. For each object our measured NuSTAR flux is in agreement with the soft X-ray observatory (Chandra or XMM-Newton) measurement at – keV, the energy band for which the observatories overlap. For the three faint or undetected sources (SDSS J0758+3923, 0840+3838 and 1713+5729), the values were obtained by extrapolating from the observed-frame – keV fluxes assuming . For the two sources with good NuSTAR photon statistics (SDSS J1218+4706 and 1243–0232) the values were calculated using the best-fitting spectral models (Section 4.1).
| Object | Observed-frame Flux ( erg s-1 cm-2) | Rest-frame Luminosity ( erg s-1) | |||||||
|---|---|---|---|---|---|---|---|---|---|
| Chandra / XMM | NuSTAR | Chandra / XMM | NuSTAR | SED Modeling | |||||
| SDSS J | – keV | – keV | – keV | – keV | – keV | – keV | – | ||
| (1) | (2) | (3) | (4) | (5) | (6) | (7) | (8) | (9) | (10) |
| 0758+3923 | |||||||||
| 0840+3838 | |||||||||
| 1218+4706 | |||||||||
| 1243–0232 | |||||||||
| 1713+5729 | |||||||||
NOTE. – Columns () to (): Hard X-ray (NuSTAR) and soft X-ray (Chandra or XMM-Newton) fluxes and luminosities. The rest-frame X-ray luminosities are observed values, i.e. uncorrected for absorption, and are in units of erg s-1. The NuSTAR fluxes are from photometry in three observed-frame energy bands, assuming . The rest-frame – keV luminosities are determined from the best-fitting spectral models (Section 4.1) for SDSS J1218+4706 and 1243–0232, and by extrapolating from the observed-frame – keV band (assuming ) for SDSS J0758+3923, 0840+3838 and 1713+5729. The Chandra and XMM-Newton fluxes and luminosities are determined from spectroscopy for SDSS J0758+3923, 1218+4706 and 1243–0232, and from aperture photometry in the observed-frame – keV and rest-frame – keV bands for SDSS J0840+3838 and 1713+5729 (assuming ). Columns () to (): Best-fit parameters from the near-UV to mid-IR SED modeling in Section 3.3. The errors shown correspond to standard deviations from a Monte Carlo re-sampling of the photometric data. Column (): rest-frame m luminosity for the AGN only, (), in units of erg s-1. This value is intrinsic (i.e., corrected for dust extinction). Column (): The fractional contribution of the AGN to the total integrated intrinsic luminosity between and m. Column (): The fractional contribution of the AGN to the observed (i.e., uncorrected for dust extinction) monochromatic rest-frame m flux.
3.2. Lower Energy X-ray Data
To incorporate lower energy ( keV; or “soft”) X-ray data in our study, we use archival Chandra and XMM-Newton observations, limiting the analysis to the – keV and – keV bands, respectively. Table 1 provides details of the archival soft X-ray observations, including dates and net exposure times. For the sources with poor photon statistics, we perform photometry using identical procedures to those for the NuSTAR photometry (see Section 3.1). For the sources with good photon statistics, we model the X-ray spectra with Xspec (see Section 4.1). As mentioned in Section 3.1, source confusion is extremely unlikely: there are no neighbouring sources detected within of the QSO2 positions. Measurements of the observed-frame – keV fluxes and rest-frame – keV luminosities (uncorrected for absorption) are listed in Table 3.
For the source with Chandra coverage (SDSS J1243–0232), we process the data using chandra_repro.222http://cxc.harvard.edu/ciao/ahelp/chandra_repro.html The source events are extracted from a circular radius aperture. The background events are extracted from a background source-free annulus centered on the source coordinates, with an inner radius of ″ and an outer radius of ″. Since SDSS J1243–0232 is on-axis, a large fraction () of the source counts lie within the source aperture. Given this, and the extremely low net source counts measured (), contamination of the background region by source counts is negligible.
For the sources with XMM-Newton coverage, we analyze data products from the Pipeline Processing System (PPS) using the Science Analysis Software (SAS v.13.5.0). To determine appropriate count rate thresholds for background flare subtraction, we visually examine the light curves. In all cases the fraction of exposure time removed is , except in the case of obsID 0305750401 where the fraction is . The exposure times in Table 1 are flaring-corrected. The source events are extracted from circular regions of –″ radius (depending on source brightness and off-axis angle). The background events are extracted from regions of area ″ to ″, using either an annulus centered on the source position or an offset region if it is necessary to avoid chip-gaps or nearby sources. We combine the MOS1 and MOS2 data using the SAS task epicspeccombine, and simultaneously fit the PN and MOS data when performing spectral analyses.
In the case of SDSS J1218+4706, we use the two archival XMM-Newton observations with the longest exposures and most recent start dates (obsIDs 0203270201 and 0400560301). For obsID 0203270201, SDSS J1218+4706 lies close to the on-axis position. In this instance we only use the MOS data, since the source lies on a chip-gap for PN. For obsid 0400560301, SDSS J1218+4706 lies far off-axis. In this case we only use the PN data, since the source lies on a chip-edge in MOS1, and there are relatively low net counts with MOS2 ().
3.3. Near-UV to Mid-IR SED Analysis
Here we analyse near-UV to mid-IR (– m) spectral energy distributions (SEDs) for the five candidate CTQSO2s presented in this work, and the one presented in G14 (SDSS J1034+6001), with the primary aim of reliably measuring the AGN emission at mid-IR wavelengths. The photometric data (shown in Figure 4) are collated from the SDSS (Data Release 7; York et al., 2000), the WISE All-Sky source catalog (Wright et al., 2010), and the Spitzer (Werner et al., 2004) Enhanced Imaging Products Source List (for SDSS J1243–0232 only).
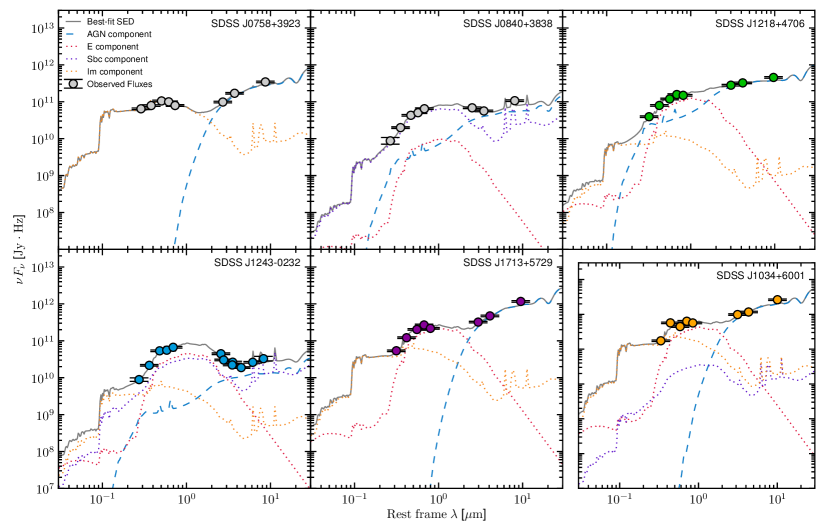
The SDSS fluxes are corrected for Galactic extinction. The photometric data adopted are provided in the Appendix. In order to provide a consistent SED analysis across the full sample of nine NuSTAR-observed candidate CTQSO2s, we use the same SED decomposition procedure as that applied in L14 to the initial three objects. Following the methodology detailed in Assef et al. (2008, 2010, 2013), each SED is modeled as the best-fit, non-negative, linear combination of four empirical templates (Assef et al., 2010), including one AGN template and three galaxy templates for: an old stellar population (“elliptical” or E), ongoing star formation (“spiral” or Sbc), and a starburst population (“irregular” or Im). The internal dust extinction of the AGN component is included as a free parameter in the modeling. The model solutions are shown in Figure 4, and the following best-fitting parameters are listed in Table 3: , the fractional contribution of the AGN to the total intrinsic (i.e., corrected for the dust extinction of the AGN component) integrated – m luminosity; , the fractional contribution of the AGN to the total observed (i.e., uncorrected for the dust extinction of the AGN component) monochromatic rest-frame m flux; and , the intrinsic AGN luminosity at rest-frame m (). The errors represent standard deviations from a Monte Carlo re-sampling of the photometric data over iterations, and thus account for possible model degeneracies. In all cases the integrated light properties (i.e., the total galaxy and AGN contributions) are well constrained, which is required to accurately determine , and . Since the primary goal of the SED modeling was to reliably measure these parameters, we do not make inferences about the host galaxy properties from the best-fit combination of host galaxy templates. SDSS J1034+6001, not shown in Table 3 since the X-ray analysis is presented in G14, has erg s-1, , and .
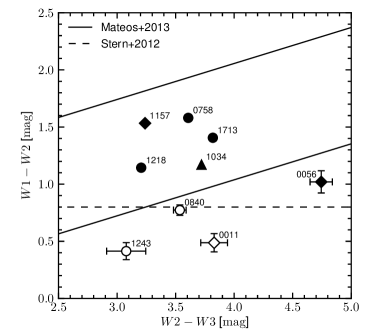
The constraints demonstrate that the candidate CTQSO2s in Figure 4 require an AGN component at a very high confidence level, and that in general the AGN contributes strongly to the intrinsic emission across the broad – m wavelength range (all but one object have ). The high values (all but one have ) indicate that the observed monochromatic m fluxes are AGN-dominated. The presence of an AGN at mid-IR wavelengths may also be inferred using WISE color diagnostics. In Figure 5 we show the six objects from Figure 4, and the three from L14, on the WISE – (i.e., [ ]–[ ]) versus – (i.e., [ ]–[ ]) plane. Generally, sources with larger – values have stronger AGN contributions. We compare with the AGN ‘wedge’ of Mateos et al. (2013) and the – color cut of Stern et al. (2012), which may be used to identify AGN-dominated systems. Out of the total sample of nine candidate CTQSO2s, five are AGN-dominated according to both criteria, and one (SDSS J0056+0032) falls below the Mateos et al. (2013) wedge but lies above the Stern et al. (2012) cut. This is in good agreement with the SED modeling for these sources, where in all cases. The remaining three sources (SDSS J0011+0056, 0840+3838 and 1243–0232) fall below both of the selection regions, although SDSS J0840+3838 is consistent with satisfying the Stern et al. (2012) AGN selection criterion given the errors. This supports the SED modeling, from which it is concluded that these three sources are the least AGN dominated (–, and –). The WISE colors of the objects agree with the expectations; in general, the CTQSO2 population appears to follow the WISE color distribution of the total QSO2 population, with a fraction of objects () lying within the AGN wedge (Mateos et al., 2013). In the local Universe, of the currently known bona fide CT AGNs lie within the wedge (Gandhi et al., 2015).
In addition to the near-UV to mid-IR SED, one of the candidate CTQSO2s presented in this work (SDSS J1713+5729) has a detection at far-IR wavelengths with IRAS which allows us to assess the extent to which star formation could contribute to the soft X-ray emission (Section 4.1.3).
4. Results
To summarise the NuSTAR source detection for the five SDSS-selected candidate CTQSO2s presented in this work: two are strongly detected, one is weakly detected, and two are undetected by NuSTAR in the high energy band (– keV). In Section 4.1 we present the results of X-ray spectral fitting with Xspec for the three brightest objects. In Section 4.2 we present the X-ray band ratios of all of the NuSTAR-detected candidate CTQSO2s, comparing to model predictions. For the weakly detected source SDSS J1713+5729, this is an appropriate method for characterizing the broad-band X-ray spectrum. These two sections give direct (i.e., X-ray spectral) constraints on absorbing column densities (). In Section 4.3, we present indirect constraints from a multiwavelength diagnostic for the entire sample, including NuSTAR non-detections.
First we take a brief look at the overall X-ray spectral shapes for the full sample of nine NuSTAR-observed candidate CTQSO2s. Figure 6 shows the effective photon indices (), measured through unabsorbed power law fits to the individual Chandra or XMM-Newton (– keV) and NuSTAR (– keV) spectra.
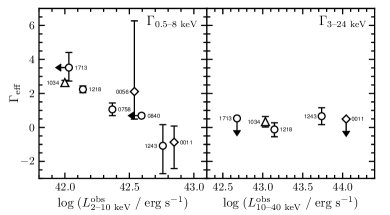
The spectral shapes observed by Chandra and XMM-Newton vary significantly over an order of magnitude in (non absorption corrected) rest-frame – keV luminosity. The increase in (– keV) toward lower luminosities may reflect an increase in the relative contribution to the low-energy spectra from processes unrelated to the direct AGN emission, such as thermal plasma emission due to star formation or AGN-powered photoionization. In contrast, the spectra seen by NuSTAR are consistent with having the same effective photon index: excluding upper limits, the mean is (– keV) .
4.1. X-ray Spectral Analysis: Best-fit Modeling
Here we use broad-band X-ray spectral modeling for the two brightest NuSTAR-detected sources presented in this paper (SDSS J1218+4706 and SDSS J1243–0232) to measure intrinsic properties: the intrinsic absorbing column density (), the intrinsic photon index (), and the intrinsic X-ray luminosity (). Additionally, we investigate the low energy X-ray spectrum of SDSS J1713+5729. The X-ray spectral fitting is performed using Xspec version 12.8.1j (Arnaud, 1996). In all cases we account for Galactic absorption using a multiplicative component, with column densities fixed at values from Kalberla et al. (2005).
4.1.1 SDSS J121839.40+470627.7
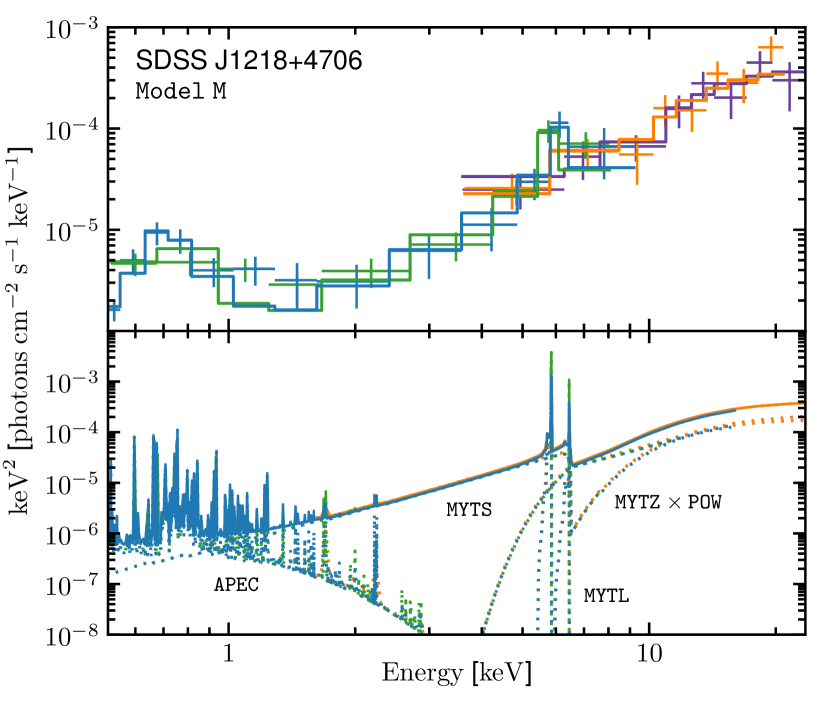
SDSS J1218+4706 has the strongest NuSTAR detection in the – keV band, with net source counts of for FPMA+B. The NuSTAR data are complemented by relatively high quality soft X-ray data, with two long XMM-Newton exposures (obsIDs 0203270201 and 0400560301; see Table 1). Below we analyze the broad-band (– keV) NuSTAR plus XMM-Newton dataset (shown in Figure 7). The modeling approach taken is similar to that adopted by G14 for SDSS J1034+6001, the other brightest source in the NuSTAR-observed QSO2 sample, which has comparable photon statistics (). We group the data by a minimum of counts per bin, and use minimisation ( in Xspec) to constrain parameters. We note that using, instead, (applying the statistic approach; e.g., see Section 4.1.2) results in essentially unchanged values for the key best-fit parameters ( and change by less than and cm-2, respectively, for the models tested). The XMM-Newton:NuSTAR cross-normalization factor, when left as a free parameter, converges to slightly different values depending on the model being tested, but is always broadly consistent (given the uncertainties) with the current best calibration measurements of Madsen et al. (2015) of . We therefore fix the cross-normalization factor to this value throughout.
As shown in Figure 6, SDSS J1218+4706 has an extremely flat effective photon index over the NuSTAR band, . This is indicative of a spectrum dominated by Compton reflection, as a result of the primary continuum being heavily suppressed by CT levels of photoelectric absorption (e.g., George & Fabian, 1991). Another important diagnostic feature of reflection is fluorescent Fe K line emission, which occurs at rest-frame keV and becomes increasingly prominent as the level of absorption increases (e.g., Risaliti, 2002). An equivalent width threshold of keV is commonly used to identify CT AGNs; such high values are difficult to explain for less than CT columns (e.g., Maiolino et al., 1998; Comastri, 2004), and suggest a heavily reflection-dominated or pure reflection spectrum, where little to none of the directly transmitted AGN emission is visible.
For SDSS J1218+4706, there is a clear excess of emission at observed frame keV, which has previously been interpreted as Fe K line emission (J13; LaMassa et al. 2012). To model this, we fit to the keV NuSTAR plus XMM-Newton dataset an unobscured power law and Gaussian component, fixing the line energy at keV and the line width at keV. We measure an observed-frame equivalent width of keV using the XMM-Newton spectra. This value is similar to but more tightly constrained than that published by J13, since they only use one of the archival XMM-Newton observations, while we use two here. The Fe K line equivalent width is above the commonly adopted threshold for CT AGNs ( keV), with a comparable value to that of the CT quasar SDSS J1034+6001 (Mrk 34; G14). Freeing the Gaussian line energy parameter, we obtain a best-fit value of keV (rest frame), which adds further confidence that the excess emission is due to Fe K.
For the X-ray spectral modeling of SDSS J1218+4706, we first conduct a simple test to assess the nature of the AGN continuum; we fit the – keV NuSTAR data with two extreme models, one reflection-only spectrum and one transmission-only spectrum. Fitting the high energy data above keV allows a clean measurement of the AGN continuum independent of how the potentially complex lower energy emission is chosen to be modeled; low energy X-ray emitting processes other than the reflected or directly transmitted AGN continuum can dominate up to energies of keV (e.g., Gandhi et al., 2014, 2015), and fluorescent line emission (e.g., Fe K) can also strongly contribute at energies up to keV. For the reflection-only model we use (Magdziarz & Zdziarski, 1995), with the reflection scaling factor set to to produce a reflection-only spectrum (i.e., no directly transmitted component), and set all other parameters to the default values. This model provides a statistically acceptable fit to the NuSTAR data (; here, is the number of degrees of freedom), and the intrinsic photon index is constrained to be . For the transmission-only model we use (in Xspec formalism).333The model (Yaqoob, 1997) is generally a preferable transmission model to use (over ) for column densities of few cm-2. However, in our case is not appropriate, since the energy range for which the model is valid depends on source column density ( keV for cm-2; keV for cm-2; Yaqoob 1997), which means not utilising the high energy NuSTAR data. It is not possible to simultaneously constrain and in this case, so we fix the intrinsic photon index at (a typical value for AGNs detected by NuSTAR at – keV; e.g., Alexander et al., 2013). Again, there is a statistically acceptable fit to the data (), for a best-fit column density of cm-2.
The above tests support the empirical evidence (from and ) that extremely large, CT column densities are required to explain the X-ray spectrum of SDSS J1218+4706. In the most extreme case, the source is consistent with being fully reflection-dominated (no directly transmitted component), which would imply cm-2. In the least extreme case, the source is consistent with lying close to the CT threshold ( cm-2). However, the latter model assumes a transmission-only spectrum (no Compton reflection), which is unlikely given the large measured equivalent width of Fe K. The reflection-only model tested () is also limited in that the geometry (a slab of material) and infinite optical depth assumed are not well motivated for obscured AGNs. Ideally, in the CT regime, any absorbed continuum, reflected continuum and fluorescent lines should be modeled in a self-consistent way, and assuming a well-motivated geometry. This is possible using the physical models MYTorus (Murphy & Yaqoob, 2009) and BNTorus (Brightman & Nandra, 2011), which were produced using Monte Carlo simulations of X-ray radiative transfer through toroidal distributions of gas, with the two models assuming different toroidal geometries. We proceed to analyse the broad-band (– keV) XMM-Newton plus NuSTAR spectrum of SDSS J1218+4706 using these two models.
| ( ) | ||
|---|---|---|
| (∘) | [] | [] |
| (∘) | [] | |
| (keV) | ||
| ( erg s-1) | ||
| ( erg s-1) | ||
| ( erg s-1) | ||
| ( erg s-1) | ||
| ( erg s-1) |
NOTE. – Best-fitting model parameters for the – keV spectrum of SDSS J1218+4706. The individual models are detailed in Section 4.1.1. The column densities () quoted are defined along the line-of-sight of the observer.
Our MYTorus-based model ( hereafter) has the following form:
.
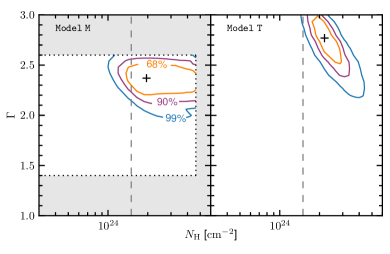
Here, reprocesses the zeroth-order transmitted continuum () through photoelectric absorption and the Compton scattering of X-ray photons out of the line-of-sight, is the scattered/reflected continuum produced by scattering X-ray photons into the line of sight, and is the fluorescent emission line spectrum (Murphy & Yaqoob, 2009). We use MYTorus in the simplest form possible, tying the common parameters of , and ( and ) together. The intrinsic (unprocessed) photon indices and normalizations are tied to those of the zeroth-order continuum (). The torus opening angle () is fixed at ∘ in the current version of MYTorus. is a thermal plasma component (Smith et al., 2001) which we use to parameterize the low energy excess, fixing the abundance parameter at solar. This component is motivated by the steep spectral slope at low energies (, measured using an unabsorbed power law model), which suggests contributions from processes such as star formation or AGN photoionization, although we lack the spectral detail required to distinguish between these processes. The best-fit model has (see Table 4 for the model parameters and Figure 7 for the model spectrum). Since and are known to be degenerate, we compute their uncertainties from contours in the – plane. Contours showing the , and confidence regions for this parameter space are shown in Figure 8. These were computed with left free to vary. Hereafter, the quoted uncertainties for and are taken from the CL contours. The best-fit intrinsic photon index and line-of-sight column density are and cm-2 [corresponding to an equatorial column density of cm-2] for the best-fit inclination angle of ∘. The modeling will not allow inclination angles of ∘, since for these angles the observer has a direct, unobscured view of the central X-ray emitting source. The upper error on is not constrained, which is in part due to the limited range of MYTorus (– cm-2). The best-fit model spectrum is reflection-dominated, with the component dominating at – keV, and the and components contributing equally to the normalization and spectral shape at keV. To assess whether the NuSTAR plus XMM-Newton spectrum is in agreement with being fully reflection dominated, we test two modifications of where the component is removed and the inclination angle of the component is set to ∘ and ∘, corresponding to face-on and edge-on reflection. Both models provide statistically acceptable fits to the spectrum ( and , respectively), with flat residuals, reasonable best-fit intrinsic photon indices ( and , respectively) and large column densities for the reflecting material [ and cm-2, respectively]. The broad-band X-ray spectrum of SDSS J1218+4706 is therefore in agreement with being fully reflection dominated. Since no transmission component is required in these models, we may infer that the line-of-sight column density is consistent with having a value of cm-2.
Our BNTorus-based model ( hereafter) has the following form:
.
In the BNTorus model, is defined along the line of sight, and is independent of . Initially, we fix the inclination at the maximum value of ∘, corresponding to an edge-on view of the torus. Since the opening angle for is poorly constrained when left as a free parameter (∘), we fix it to ∘. The best-fit model has (the model parameters are listed in Table 4, and the – contours are shown in Figure 8). is well constrained at the CL, with a best-fit value of cm-2, and the intrinsic photon index has a relatively high value of . The upper error on is not constrained due to the parameter limits of the BNTorus model. Fixing the intrinsic photon index at a more reasonable value of , which is consistent with the contours and is at the upper end of the range typically observed for unobscured AGNs (e.g., Mateos et al., 2010; Scott et al., 2011), results in a higher column density of cm-2 and a reduced value close to unity (). If the intrinsic photon index is fixed at , an extremely high column density of cm-2 is required. We note that the modeling (with left free) allows a large range of inclination angles (∘), and re-modeling with fixed at a lower value of ∘ results in a similarly good fit () with no significant change in but a flatter photon index of . Furthermore, the statistical quality of the fit and the best-fit parameters are relatively unchanged when is left as a free parameter.
To summarize, CT line-of-sight column densities are preferred for all of the models tested for SDSS J1218+4706. The broad-band X-ray spectrum shows evidence for having a dominant contribution from Compton reflection, with the primary continuum being heavily suppressed due to photoelectric absorption. This is in agreement with the expectations from the observation of strong fluorescent Fe K line emission ( keV). The lowest limit allowed by the modeling for the line-of-sight column density is cm-2, and there is no constraint at the upper end. The , and constraints and data quality for SDSS J1218+4706 () are remarkably similar to those for the other low redshift QSO2 strongly detected by NuSTAR, SDSS J1034+6001 (; also known as Mrk 34), which was identified by G14 as a bona fide CT AGN. More complex models are possible (such as a clumpy torus; e.g., Bauer et al. 2014), but testing these is beyond the X-ray data quality.
4.1.2 SDSS J124337.34–023200.2
SDSS J1243–0232 is the third brightest NuSTAR detection in the SDSS-selected candidate CTQSO2 sample, after SDSS J1218+4706 (Section 4.1.1) and SDSS J1034+6001 (G14), but still has relatively low photon counts: and with NuSTAR, and with Chandra. This emphasizes the challenge involved in studying these inherently faint X-ray sources. Due to the low photon statistics, we use in Xspec, which is more appropriate than in the case of Poisson distributed data (Nousek & Shue, 1989). In the case of unmodeled background spectra, applies the statistic (Wachter et al., 1979).444See also http://heasarc.gsfc.nasa.gov/docs/xanadu/xspec/wstat.ps While the statistic is intended for unbinned data, bins containing zero counts can lead to erroneous results,555See https://heasarc.gsfc.nasa.gov/xanadu/xspec/manual/XSappendixStatistics.html so we group the Chandra and NuSTAR data by a minimum of count and counts per bin, respectively (e.g., Wik et al., 2014). We fix the Chandra:NuSTAR cross-normalization factor at , consistent with the value obtained when the cross-normalization factor is left as a free parameter in the modeling.
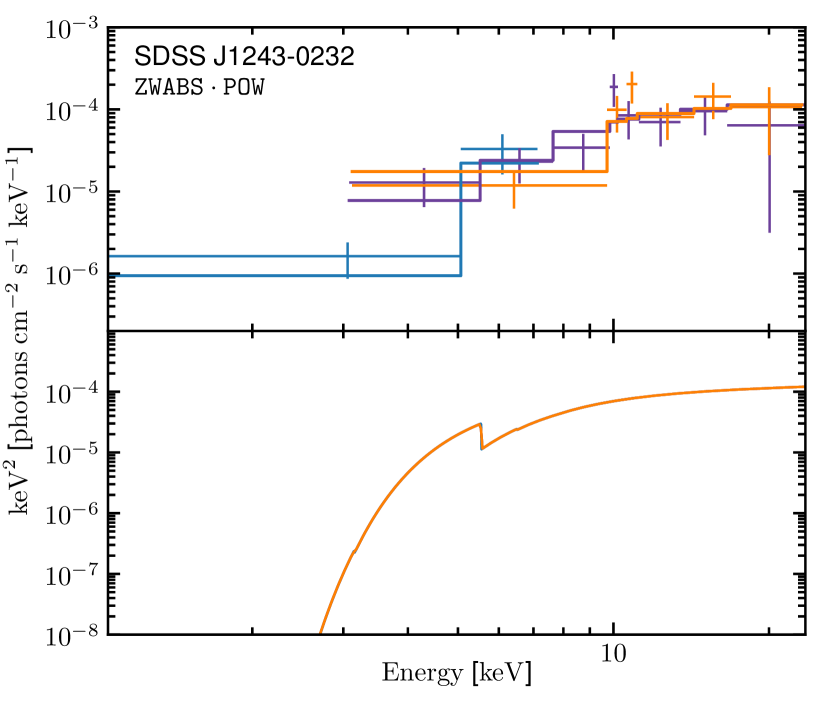
The NuSTAR spectrum of SDSS J1243–0232 has a flat effective photon index of , indicative of heavy absorption. Fitting the broad-band (– keV) NuSTAR plus Chandra spectrum with a simple absorbed power law () model, we obtain cm-2 and . This intrinsic photon index is discrepant with the expected range for AGNs, and the parameter is poorly constrained. We therefore fix the parameter to (typical value in the – keV energy band for AGNs; e.g., Alexander et al. 2013). The best-fitting model has and a C-statistic value of , for . The unfolded spectrum and best-fitting model are shown in Figure 9. The column density, cm-2, is close to CT. The intrinsic luminosities in the low and high energy X-ray bands are erg s-1 and erg s-1, respectively. The higher quality NuSTAR data dominate the fit, with similar results [ cm-2] being obtained when the Chandra data are excluded. We note that may also be used to model the unbinned, gross (i.e., combined source plus background) spectrum, in which case the Cash statistic ( statistic; Cash 1979) is applied. Characterizing the background spectra using double power law models ( in Xspec), and including these as fixed components in the spectral modeling of the NuSTAR data, this statistic approach yields very similar results to the statistic approach, with cm-2.
Given the extremely flat effective photon index measured for this source, it is reasonable to test whether the spectrum is in agreement with a pure reflection continuum. As in Section 4.1.1, we use with the reflection scaling factor set to to produce a reflection-only spectrum. The model produces a similarly good fit to the data as for the absorbed power law model above, with and , for . We infer that the line-of-sight column density is consistent with being CT, with cm-2. Unlike for the absorbed power law model, the intrinsic photon index is well constrained by the reflection-only model, with . To summarize, the NuSTAR data unambiguously reveal heavy absorption in this QSO2, with a column density lower limit of cm-2 and no constraint at the high, CT absorption end. Higher quality X-ray data than those currently available, especially at keV, are required to reliably distinguish between less than CT, and reflection-dominated CT models. For instance, the current data are unable to provide informative constraints on Fe K line emission (see the Appendix).
4.1.3 SDSS J171350.32+572954.9
For SDSS J1713+5729 there are too few NuSTAR counts for broad-band X-ray spectral modeling (see Table 2). Here we investigate the low energy ( keV) spectrum observed with XMM-Newton. The object appears to have an extremely steep spectrum at low energies, with PN (MOS) source counts of () at – keV and () at – keV, implying a photon index of in the – keV energy band; J13 measure a slightly flatter, but consistent (within the uncertainties), value of . The steep spectral slope is not typical of an AGN, and would be inconsistent with the NuSTAR detection if produced as a result of direct AGN emission. To test whether the soft X-ray emission could be powered by star formation, we compare the – keV luminosity, erg s-1, with the far-infrared (FIR) luminosity, erg s-1, measured using IRAS fluxes following Lonsdale Persson & Helou (1987). The relatively high soft X-ray:FIR luminosity ratio of , which is a conservative lower limit due to the poorly constrained IRAS flux, rules out star formation as the driver of the soft X-ray emission (e.g., see Figure 8 of Alexander et al. 2005). We deduce that the soft X-rays detected with XMM-Newton are indirectly powered by the AGN (e.g., via photoionization or scattered AGN emission), and NuSTAR may have provided the first identification of the directly transmitted (or reflected) AGN continuum of this QSO2.
4.2. X-ray Spectral Analysis: Band Ratios
X-ray band ratios provide a basic description of the X-ray spectrum, and are useful when there are insufficient counts for detailed spectral modeling. We define the NuSTAR band ratio () as the ratio of net source counts in the hard-band to those in the soft-band, . Figure 10 shows against redshift () for the five (of the total nine) NuSTAR-observed candidate CTQSO2s which are detected at – keV, including the three presented in this paper (SDSS J1218+4706, 1243–0232 and 1713+5729) and the two presented in L14 and G14 (SDSS J0011+0056 and 1034+6001, respectively). The tracks show the expected evolution of with for four different fixed column densities (), computed using a MYTorus model with an intrinsic photon index of .
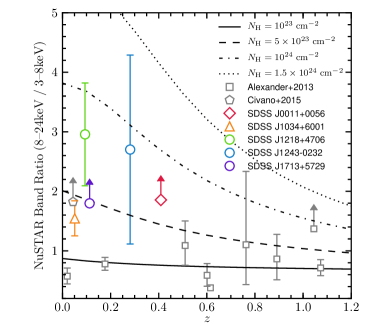
We compare the measured values for the candidate CTQSO2s with these tracks in order to infer . We note that producing the tracks with, instead, a simple model results in higher values for the same . The NuSTAR-detected candidate CTQSO2s, in general, have high band ratios compared to AGNs detected in the NuSTAR extragalactic surveys (squares in Figure 10). In all cases the values suggest cm-2.
For SDSS J1713+5729, a NuSTAR-detected object with too few counts for broad-band spectral modeling of the direct AGN continuum (see Section 4.1.3), the lower limit in suggests heavy absorption with cm-2. Our most direct measurement for the intrinsic X-ray luminosity of this QSO2 comes from using this constraint. Taking the observed – keV luminosity constraint from Table 3, and assuming that the X-ray spectrum is an absorbed power law with , the lower limits obtained are erg s-1 and erg s-1. As an alternative to the approach, can be constrained using the NuSTAR/XMM-Newton band ratio (following L14). However, in this case the constraint ( cm-2) is less stringent than that from , due to the comparatively poor quality of the available XMM-Newton data.
The estimates made from using Figure 10 are relatively crude, since the individual X-ray spectra may have additional spectral complexities (e.g., line emission around keV, a scattered power law, or a complex absorber geometry) not incorporated in our model predictions. To illustrate this, for the two sources with comparatively high quality NuSTAR spectra (SDSS J1034+6001 and 1218+4706), the less than CT column densities inferred from the analysis ( cm-2 and cm-2, respectively) are an underestimate of the column densities determined from X-ray spectral fitting ( cm-2; see G14 and Section 4.1.1 of this paper, respectively). Similarly, using the NuSTAR results for three CT reflection-dominated Seyfert 2s, Baloković et al. (2014) demonstrate that the above approach underestimates for reflection-dominated AGNs. Nevertheless, provides first-order constraints for weakly detected sources.
4.3. Indirect Constraints on X-ray Absorption
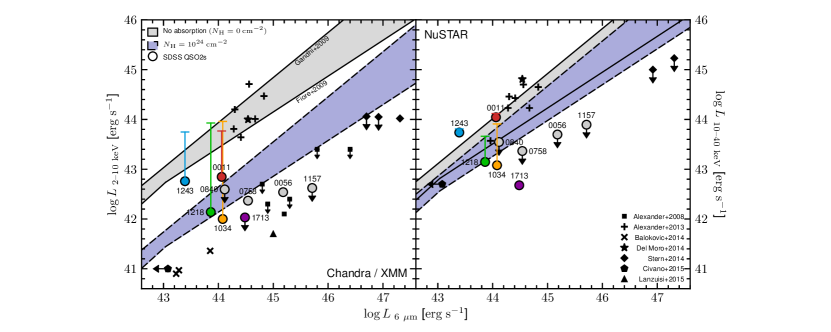
It is well-established that there is a tight relation between the mid-IR and intrinsic X-ray luminosities of AGNs (e.g., Lutz et al., 2004; Fiore et al., 2009; Gandhi et al., 2009; Lanzuisi et al., 2009; Mateos et al., 2015; Stern, 2015). Mid-IR emission can therefore provide an indirect estimate of the intrinsic AGN power, especially useful when heavy absorption in the X-rays makes this information challenging to obtain (e.g., Vignali et al., 2010; Alexander et al., 2008; LaMassa et al., 2009, 2011; Goulding et al., 2011; Lanzuisi et al., 2015b). Following the approach used for other NuSTAR studies of faint, obscured AGNs (L14; Stern et al. 2014), in Figure 11 we compare the observed X-ray:mid-IR luminosity ratios with intrinsic ratios for unobscured AGNs and those corresponding to X-ray absorption due to dense obscuring material ( cm-2), for both the low (– keV) and high (– keV) energy X-ray regimes. We show the full sample of nine NuSTAR-observed SDSS-selected candidate CTQSO2s, including the five presented in this work, the three from L14 and the one in G14. The X-ray luminosities () are observed values (i.e., uncorrected for absorption), and the m luminosities (, in units) are intrinsic values (i.e., corrected for dust extinction occuring in the system) for the AGN determined through SED modeling (Section 3.3), and both correspond to the values provided in Table 3. We note that for a large fraction of CT AGNs, potentially in the case of local CT AGNs, we expect significant absorption in the mid-IR (e.g., Bauer et al., 2010; Goulding et al., 2012). We have partially addressed this through dust corrections which are included in the SED modeling (Section 3.3). These corrections are small, however, with the luminosities changing by factors ranging from to (with a median of ). For the four candidate CTQSO2s with constrained intrinsic X-ray luminosities (), we plot the values obtained from X-ray spectral analyses (see L14, G14, and Sections 4.1.1 and 4.1.2 of this work). We conservatively adopt intrinsic X-ray luminosities from the models with lower best-fit column densities (e.g., in the case of SDSS J1218+4706 and the absorbed power law model in the case of SDSS J1243–0232).
The two intrinsic relations utilized for comparison are those of Fiore et al. (2009) and Gandhi et al. (2009), which were both computed at – keV. In the case of the Gandhi et al. (2009) relation, we adjust the m (the mid-IR wavelength at which the relation was computed) luminosities downwards by to obtain m luminosities, based on the Assef et al. (2010) AGN template. The two relations predict slightly different X-ray:mid-IR ratios at low luminosities and diverge further towards higher luminosities, which is partly due to the different luminosity ranges over which the two relations were calibrated, but also reflects the uncertainty in such relations. Comparison to both allows us to account for systematic effects in the derivation of these relations. We extrapolate the relations to the – keV band assuming (typical value for AGNs; e.g., Alexander et al. 2013). An advantage of using – keV X-ray luminosities (), as opposed to – keV luminosities (), is that contamination from processes other than AGN continuum emission is negligible in this high-energy band. However, the suppression of the X-ray emission by absorbing gas is less dramatic in the – keV band, as demonstrated by the relative normalization of the cm-2 lines in the left and right hand panels of Figure 11, which were computed assuming a MYTorus model with and (following L14). Absorption by cm-2 gas results in a suppression of the X-ray emission by factors of and in the – keV and – keV bands, respectively. We note that for the four candidate CTQSO2s with values constrained using X-ray spectral analyses, the intrinsic luminosities agree more closely with the Gandhi et al. (2009) relation than with the Fiore et al. (2009) relation.
In general, the overall sample of candidate CTQSO2s have extremely low – keV:mid-IR ratios, with the observed – keV luminosities a factor of lower than the intrinsic relations, suggesting CT absorption. This was already apparent from – keV luminosities published in the literature, but here we have demonstrated the – keV suppression using our own soft X-ray analysis. A similar conclusion is reached in the high-energy – keV band, where six out of nine of the objects have X-ray luminosities a factor of lower than the intrinsic relations, consistent with CT obscuration. Our sample of SDSS-selected candidate CTQSO2s lies below the majority of the AGNs detected in the NuSTAR extragalactic surveys (Alexander et al., 2013), including a heavily obscured quasar detected in ECDFS (NuSTAR J033202–2746.8; ; Del Moro et al. 2014).
Of the five new objects presented in this work, there is one, SDSS J1243–0232, which does not appear compatible with CT absorption based on this indirect analysis. For this object, the low implied by the relatively high X-ray:mid-IR ratios is incongruous with the direct constraints from X-ray spectral modeling (Section 4.1.2), which suggest cm-2. A similar case where the values inferred from X-ray spectral modeling and the X-ray:mid-IR ratio do not agree is that of NuSTAR J033202–2746.8 (star symbol in Figure 11; Del Moro et al. 2014). Despite the large column density measured for this source ( cm-2; Del Moro et al. 2014), it lies high with respect to the relations, which may in part be due to its significant Compton reflection component. It is possible that a strong reflection component also contributes to the high X-ray:mid-IR ratio observed for SDSS J1243–0232, especially given that a pure reflection spectrum well describes the data (see Section 4.1.2).
Of the NuSTAR targets detected at high energies ( keV), SDSS J1713+5729 has the most extreme – keV:mid-IR ratio, with a value suppressed by a factor of with respect to the intrinsic relations (on average). The fact that the source lies even lower than the CTQSO2 SDSS J1034+6001 (G14) may be due to some combination of a heavily CT absorbing column ( cm-2) and a less prominent reflection component. For the non detections, SDSS J0758+3923 and SDSS J0840+3838, the upper limits suggest that if the X-ray faintness is due to absorption, these sources are likely CT (for SDSS J0840+3838 this only applies for the Gandhi et al. 2009 relation). While heavy absorption seems the most likely explanation for the X-ray faintness of these non detections, we do not have broad-band X-ray spectral constraints and therefore cannot rule out the possibility of intrinsic X-ray weakness (e.g., Gallagher et al., 2001; Wu et al., 2011; Luo et al., 2014; Teng et al., 2014). However, intrinsic X-ray weakness is a phenomenon observed for type 1 sources where there is an unobscured view of the central nucleus, unlike for our QSO2s.
5. Discussion
In the following sections, we discuss the possible implications of the extremely high column densities and corresponding intrinsic luminosities measured for the NuSTAR-detected heavily obscured QSO2s presented in this paper (SDSS J1218+4706, 1243–0232 and 1713+5729), L14 (SDSS J0011+0056), and G14 (SDSS J1034+6001), in the context of the overall quasar population.
5.1. Heavy Absorption and Powerful X-ray Luminosities
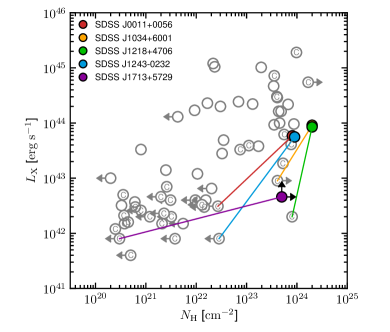
Figure 7 shows versus intrinsic (i.e., absorption-corrected) X-ray luminosity for all SDSS-selected QSO2s that have been studied at low energies ( keV) with Chandra and XMM-Newton, and have direct constraints from X-ray spectral analyses. The intrinsic X-ray luminosities shown are for the rest-frame – keV band (), and are hereafter referred to as . The data are compiled from J13 and LaMassa et al. (2014). Since these two studies have different approaches, with the former limiting the spectral analysis to absorbed power law models and the latter using physically motivated models, we adopt the LaMassa et al. (2014) values where multiple measurements exist. Overlaid are the five sources which have – keV detections with NuSTAR, for which it is therefore possible to remeasure and with the addition of the high-energy ( keV) data. In each case, there is a range of column densities consistent with the data. To be conservative, we adopt measured values at the lower end of these ranges: e.g., for SDSS J1218+4706 we adopt the results ( cm-2; Section 4.1.1) and for SDSS J1243–0232 we adopt the absorbed power law model results ( cm-2; Section 4.1.2). The improvements made with NuSTAR are illustrated by the colored lines, which connect the literature constraints prior to NuSTAR and the broad-band, NuSTAR plus soft X-ray constraints.
Our and measurements for these five objects are significantly higher than the constraints in the literature from spectral modeling of the soft X-ray (Chandra or XMM-Newton) data alone. For the fainter quasars which have net Chandra (– keV) or XMM-Newton PN (– keV) source counts of (SDSS J0011+0056, 1243–0232 and 1713+5729) the soft X-ray constraints underpredict by factors of –, while for the brighter sources with (SDSS J1034+6001 and 1218+4706) is underpredicted by factors of –. In general, the intrinsic X-ray luminosities () measured are – orders of magnitude higher with the addition of NuSTAR data, which is largely due to the increased absorption correction. These results have implications for X-ray studies of AGNs at that lack sensitive high-energy ( keV) coverage. For example, on the basis of our results we infer that X-ray data at keV may not reliably identify heavily obscured to CT ( cm-2) AGNs if the photon counts are low, and the intrinsic luminosities will be underestimated. A similar conclusion was reached by Wilkes et al. (2013), who used Chandra and multiwavelength data to investigate the intrinsic X-ray properties of quasars selected at low radio frequencies.
The intrinsic X-ray luminosities of our objects (close to erg s-1, which roughly agrees with the value for unobscured AGNs; e.g., Hasinger et al. 2005) makes them important for population synthesis models of the CXB, since AGNs around this luminosity produce most of the CXB at its high energy peak (e.g., Treister & Urry, 2005).888While the NuSTAR-detected objects all satisfy the classical optical quasar luminosity definition (see Sections 2.1 and 2.2), based on Figure 7 they are just below the standard ‘X-ray quasar’ luminosity threshold ( erg s-1), although SDSS J1034+6001, 1218+4706 and 1243–0232 are consistent with lying above the threshold for some of the X-ray spectral model solutions. It is thus useful to consider the distribution and CT fraction for this class of optically selected QSO2s.
5.2. The Distribution
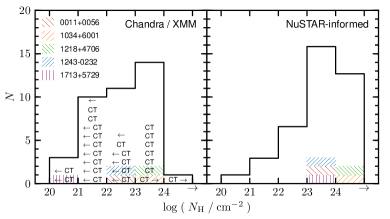
In the left panel of Figure 13 we show the observed distribution for SDSS-selected QSO2s that are detected with Chandra and XMM-Newton, and have direct constraints at keV from X-ray spectral fitting (J13; LaMassa et al. 2014). The objects included have and , and should therefore be broadly representative of the overall optically selected QSO2 population (for further details, see Section 2.2). The exclusion of QSO2s undetected by Chandra and XMM-Newton has a negligible impact since, for the adopted and ranges, there are only three such objects. On the basis of these data, the column density distribution is relatively flat at – cm-2, and there is only one object above cm-2. The absorber for this object (SDSS J0939+3553) appears different in nature to those presented in this paper, possibly taking the rare form of a geometrically thin toroidal ring (LaMassa et al., 2014).
In this work, we have demonstrated that soft X-ray (Chandra and XMM-Newton) studies can underpredict the and values of quasars with evidence for CT absorption based on multiwavelength diagnostics (CT candidates; see Section 5.1 and Figure 7). The severity of the and underpredictions is related to the observed soft X-ray source photon counts (), with the faintly detected sources suffering larger underpredictions than the more strongly detected sources. To understand the consequences of this for the true distribution of QSO2s, our result for the NuSTAR-detected objects can be extrapolated to the remaining CT candidates in Figure 13, which were identified as such primarily based on the X-ray:[O III] luminosity ratio (J13; LaMassa et al. 2014). This extrapolation relies on assuming that the NuSTAR-detected subsample of five objects are representative of the remaining subsample of CT candidates in terms of their absorption properties. This is a reasonable assumption; the distributions of the two subsamples are in agreement (KS test: ), using the X-ray luminosities from J13 (except for SDSS J1243–0232, for which we use our measured luminosity; see footnote 7) and estimating the m luminosities from an interpolation between the WISE photometric bands.
To make a prediction for the true distribution of optically selected QSO2s, we apply an correction factor () to each of the CT candidates in Figure 13 not observed/detected with NuSTAR, informed by our NuSTAR-measured values (Section 5.1). For sources with low () and high () soft X-ray source counts (using PN counts only in the case of XMM-Newton data) we draw correction factors at random from flat distributions between and between , respectively. In determining these correction factors we assumed column densities which are at the lower end of the range that is consistent with the data (Section 5.1): for the three most strongly detected sources (SDSS J1034+6001, 1218+4706, 1243–0232), the lowest best-fit values of – cm-2 are adopted, although the sources are consistent with having much larger columns ( cm-2); and we assume the lower limit for SDSS J1713+5729 ( cm-2). As such, the distribution prediction below may provide a lower limit on the CT fraction. However, this discussion is ultimately limited by the small number of sources detected above keV with NuSTAR.
The predicted distribution (averaged over many iterations) is shown in the right hand panel of Figure 13. This “NuSTAR-informed” distribution for optically selected QSO2s is strongly skewed towards high columns of cm-2. Our predicted CT fraction (), defined here as the ratio of the number of objects with cm-2 to those with cm-2, is , where the errors represent binomial uncertainties only. The full uncertainties are likely to be larger; considering extreme distributions, where the values assumed are all set equal to either the highest or lowest values of the ranges measured with NuSTAR, the uncertainties on may be larger by a factor of .
The CT fraction is an important parameter in population synthesis models of the CXB. In many such models, is treated as a fixed, global quantity; the Treister et al. (2009) model assumes a relatively low value of , while others assume (Gilli et al. 2007, Ueda et al. 2014; the quoted fractions have been adjusted from the original published values to our adopted definition of ). It is possible to estimate using this class of CXB synthesis model, although meaningful constraints are challenging to obtain due to degeneracies with other parameters (e.g., Akylas et al. 2012). Fixing the Compton-reflection strength parameter, Ueda et al. (2014) constrain –, which is compatible with our result. In other CXB synthesis models, the CT fraction is dependent on physical properties of the AGN population; according to the Draper & Ballantyne (2010) model, high CT fractions are associated (beyond the local Universe) specifically with black holes accreting at a large fraction of their Eddington rate, in broad consistency with our findings.
With the distribution in Figure 13 we have attempted to provide a prediction using only directly measured column densities since analysis of the X-ray spectrum should provide the “purest” measurement of the line-of-sight column density, without the need to make assumptions in comparing emission across very different wavelength regimes (i.e., using indirect absorption diagnostics such as the X-ray:mid-IR, X-ray:[O III] or X-ray:[Ne V] luminosity ratios). However, it is worthwhile considering an extreme scenario in which all of the candidate CTQSO2s in Figure 13 (labelled “CT”) are truly CT; i.e., in which the indirect absorption diagnostics are assumed to be accurate. Applying this assumption, the predicted CT fraction is . For comparison, Vignali et al. (2010) make similar assumptions using the X-ray:[O III] and X-ray:mid-IR luminosity ratios for a complete sample of SDSS-selected QSO2s at , and determine . Additionally, Vignali et al. (2014) utilize the X-ray:[Ne V] ratio for a sample of type 2 AGNs and find . In the case of Seyfert 2s in the local Universe, distributions have been constructed for optically selected samples using indirect absorption diagnostics (primarily the X-ray:[O III] ratio), predicting a fraction of for this lower luminosity AGN population (e.g., Bassani et al., 1999; Risaliti et al., 1999; LaMassa et al., 2011).
Indirect absorption diagnostics predict a larger CT fraction for QSO2s than our NuSTAR-informed distribution. The apparent discrepancy may well be due to indirect diagnostics overpredicting the number of CT AGNs. Another reconciling factor could be that the quasars unobserved/undetected with NuSTAR, in general, suffer even heavier absorption than our detected objects. Deeper observations at both low (e.g., with Athena; Nandra et al. 2013) and high (e.g., with NuSTAR or Astro-H; Takahashi et al. 2012) X-ray energies are needed to reliably distinguish between the above scenarios, and thus achieve tighter constraints on for the quasar population.
6. Summary
Sensitive high-energy ( keV) NuSTAR observations of five optically selected candidate CTQSO2s have been presented, along with broad-band X-ray spectral and multiwavelength analyses. Similar studies for a further four such objects have already been presented in the literature (L14; G14). The overall sample of nine candidate CTQSO2s was selected primarily on the basis of multiwavelength evidence for absorption by CT ( cm-2) material along the line-of-sight (see Section 2.2). Our results are summarized as follows:
-
•
Of the five recently observed objects, two are undetected by NuSTAR at – keV (SDSS J0758+3923 and 0840+3838), one is weakly detected (net source counts ; SDSS J1713+5729), and two are strongly detected (; SDSS J1218+4706 and 1243–0232). These represent the first detections of these sources at high X-ray energies; see Section 3.1.
-
•
For the two strongly detected targets, spectral modeling of the NuSTAR plus archival soft X-ray data suggests that the primary transmitted AGN continua are suppressed by extreme levels of photoelectric absorption, with cm-2; see Section 4.1. For the brightest source, SDSS J1218+4706, the relatively high quality spectral analysis using physically motivated models provides strong evidence for CT absorption, with a contribution from Compton reflection; see Section 4.1.1.
-
•
For SDSS J1713+5729, the NuSTAR detection likely represents the first identification of directly transmitted emission from the AGN; see Section 4.1.3. We characterize the – keV spectrum using the NuSTAR band ratio () and estimate a high absorbing column density of cm-2; see Section 4.2. Notably, the observed – keV luminosity appears to be extremely suppressed, by a factor of , with respect to the intrinsic luminosity, suggesting cm-2 if purely due to absorption; see Section 4.3.
-
•
For the non detections, column densities of cm-2 are inferred by comparing the upper limits in observed X-ray luminosity (at rest-frame – keV and – keV) with the intrinsic luminosities expected from the mid-IR emission. The majority of NuSTAR-observed candidate CTQSO2s have X-ray:mid-IR ratios suggesting CT absorption; see Section 4.3.
-
•
For the five objects in the overall NuSTAR-observed candidate CTQSO2 sample that are detected at high energies, the column densities and intrinsic luminosities measured from spectral analyses are factors of – and – higher, respectively, than soft X-ray constraints in the literature; see Section 5.1.
-
•
Using direct constraints on absorption for QSO2s studied at X-ray wavelengths, and assuming that the NuSTAR-detected QSO2s are representative of the larger sample with evidence for CT absorption, we make a prediction for the distribution of optically selected QSO2s. The distribution is highly skewed toward large column densities ( cm-2) and the predicted CT fraction of is broadly consistent with CXB models. A higher fraction of up to is possible if indirect absorption diagnostics are assumed to be accurate; see Section 5.2.
Acknowledgements
We thank the referee for their careful review, which has improved this work. We acknowledge financial support from: the Science and Technology Facilities Council (STFC) grants ST/K501979/1 (G.B.L.), ST/J003697/1 (P.G.), ST/I001573/1 (D.M.A. and A.D.M.); the Leverhulme Trust (D.M.A.); Gemini-CONICYT grant 32120009 (R.J.A.); the ERC Advanced Grant FEEDBACK at the University of Cambridge (J.A.); NSF AST award 1008067 (D.R.B.); the NASA Earth and Space Science Fellowship Program, grant NNX14AQ07H (M.B.); CONICYT-Chile grants Basal-CATA PFB-06/2007 (F.E.B.), FONDECYT 1141218 (F.E.B.), and “EMBIGGEN” Anillo ACT1101 (F.E.B.); the Ministry of Economy, Development, and Tourism’s Millennium Science Initiative grant IC120009, awarded to The Millennium Institute of Astrophysics, MAS (F.E.B.); Caltech NuSTAR subcontract 44A-1092750 (W.N.B. and B.L.); NASA ADP grant NNX10AC99G (W.N.B. and B.L.); the Caltech Kingsley visitor program (A.C.); ASI/INAF grant I/037/12/0–011/13 (A.C., S.P., C.V.); NASA ADAP award NNX12AE38G (R.C.H.); National Science Foundation grant 1211096 (R.C.H.); and Swiss National Science Foundation grant PP00P2_138979/1 (M.K.). We thank Andrew Ptak and Jianjun Jia for the useful correspondence. This work was supported under NASA Contract No. NNG08FD60C, and made use of data from the NuSTAR mission, a project led by the California Institute of Technology, managed by the Jet Propulsion Laboratory, and funded by the National Aeronautics and Space Administration. We thank the NuSTAR Operations, Software and Calibration teams for support with the execution and analysis of these observations. This research has made use of the NuSTAR Data Analysis Software (NuSTARDAS) jointly developed by the ASI Science Data Center (ASDC, Italy) and the California Institute of Technology (USA).
Facilities: Chandra, IRAS, NuSTAR, SDSS, Spitzer, Swift, WISE, XMM-Newton.
References
- Akylas et al. (2012) Akylas, A., Georgakakis, A., Georgantopoulos, I., Brightman, M., & Nandra, K. 2012, A&A, 546, A98
- Alexander et al. (2005) Alexander, D. M., Bauer, F. E., Chapman, S. C., et al. 2005, ApJ, 632, 736
- Alexander et al. (2008) Alexander, D. M., Chary, R.-R., Pope, A., et al. 2008, ApJ, 687, 835
- Alexander et al. (2013) Alexander, D. M., Stern, D., Del Moro, A., et al. 2013, ApJ, 773, 125
- Antonucci (1993) Antonucci, R. 1993, ARA&A, 31, 473
- Arnaud (1996) Arnaud, K. A. 1996, in Astronomical Society of the Pacific Conference Series, Vol. 101, Astronomical Data Analysis Software and Systems V, ed. G. H. Jacoby & J. Barnes, 17
- Assef et al. (2008) Assef, R. J., Kochanek, C. S., Brodwin, M., et al. 2008, ApJ, 676, 286
- Assef et al. (2010) —. 2010, ApJ, 713, 970
- Assef et al. (2013) Assef, R. J., Stern, D., Kochanek, C. S., et al. 2013, ApJ, 772, 26
- Assef et al. (2014) Assef, R. J., Eisenhardt, P. R. M., Stern, D., et al. 2014, ArXiv e-prints, arXiv:1408.1092
- Baloković et al. (2014) Baloković, M., Comastri, A., Harrison, F. A., et al. 2014, ApJ, 794, 111
- Bassani et al. (1999) Bassani, L., Dadina, M., Maiolino, R., et al. 1999, ApJS, 121, 473
- Bauer et al. (2010) Bauer, F. E., Yan, L., Sajina, A., & Alexander, D. M. 2010, ApJ, 710, 212
- Bauer et al. (2014) Bauer, F. E., Arevalo, P., Walton, D. J., et al. 2014, ArXiv e-prints, arXiv:1411.0670
- Baumgartner et al. (2013) Baumgartner, W. H., Tueller, J., Markwardt, C. B., et al. 2013, ApJS, 207, 19
- Brightman & Nandra (2011) Brightman, M., & Nandra, K. 2011, MNRAS, 413, 1206
- Buchner et al. (2015) Buchner, J., Georgakakis, A., Nandra, K., et al. 2015, ApJ, 802, 89
- Burlon et al. (2011) Burlon, D., Ajello, M., Greiner, J., et al. 2011, ApJ, 728, 58
- Cash (1979) Cash, W. 1979, ApJ, 228, 939
- Comastri (2004) Comastri, A. 2004, in Astrophysics and Space Science Library, Vol. 308, Supermassive Black Holes in the Distant Universe, ed. A. J. Barger, 245
- Comastri et al. (1995) Comastri, A., Setti, G., Zamorani, G., & Hasinger, G. 1995, A&A, 296, 1
- Comastri et al. (2011) Comastri, A., Ranalli, P., Iwasawa, K., et al. 2011, A&A, 526, L9
- Del Moro et al. (2014) Del Moro, A., Mullaney, J. R., Alexander, D. M., et al. 2014, ApJ, 786, 16
- Donoso et al. (2013) Donoso, E., Yan, L., Stern, D., & Assef, R. J. 2013, ArXiv e-prints, arXiv:1309.2277
- Draper & Ballantyne (2010) Draper, A. R., & Ballantyne, D. R. 2010, ApJ, 715, L99
- Fabian (1999) Fabian, A. C. 1999, MNRAS, 308, L39
- Fabian et al. (2009) Fabian, A. C., Vasudevan, R. V., Mushotzky, R. F., Winter, L. M., & Reynolds, C. S. 2009, MNRAS, 394, L89
- Fiore et al. (2009) Fiore, F., Puccetti, S., Brusa, M., et al. 2009, ApJ, 693, 447
- Gallagher et al. (2001) Gallagher, S. C., Brandt, W. N., Laor, A., et al. 2001, ApJ, 546, 795
- Gandhi et al. (2009) Gandhi, P., Horst, H., Smette, A., et al. 2009, A&A, 502, 457
- Gandhi et al. (2015) Gandhi, P., Yamada, S., Ricci, C., et al. 2015, MNRAS, 449, 1845
- Gandhi et al. (2014) Gandhi, P., Lansbury, G. B., Alexander, D. M., et al. 2014, ApJ, 792, 117
- George & Fabian (1991) George, I. M., & Fabian, A. C. 1991, MNRAS, 249, 352
- Ghisellini et al. (1994) Ghisellini, G., Haardt, F., & Matt, G. 1994, MNRAS, 267, 743
- Gilli et al. (2007) Gilli, R., Comastri, A., & Hasinger, G. 2007, A&A, 463, 79
- Gilli et al. (2011) Gilli, R., Su, J., Norman, C., et al. 2011, ApJ, 730, L28
- Goulding et al. (2012) Goulding, A. D., Alexander, D. M., Bauer, F. E., et al. 2012, ApJ, 755, 5
- Goulding et al. (2011) Goulding, A. D., Alexander, D. M., Mullaney, J. R., et al. 2011, MNRAS, 411, 1231
- Hainline et al. (2013) Hainline, K. N., Hickox, R., Greene, J. E., Myers, A. D., & Zakamska, N. L. 2013, ApJ, 774, 145
- Harrison et al. (2013) Harrison, F. A., Craig, W. W., Christensen, F. E., et al. 2013, ApJ, 770, 103
- Hasinger et al. (2005) Hasinger, G., Miyaji, T., & Schmidt, M. 2005, A&A, 441, 417
- Hazard et al. (1963) Hazard, C., Mackey, M. B., & Shimmins, A. J. 1963, Nature, 197, 1037
- Heckman et al. (2005) Heckman, T. M., Ptak, A., Hornschemeier, A., & Kauffmann, G. 2005, ApJ, 634, 161
- Hickox et al. (2007) Hickox, R. C., Jones, C., Forman, W. R., et al. 2007, ApJ, 671, 1365
- Hopkins et al. (2008) Hopkins, P. F., Hernquist, L., Cox, T. J., & Kereš, D. 2008, ApJS, 175, 356
- Humphrey et al. (2010) Humphrey, A., Villar-Martín, M., Sánchez, S. F., et al. 2010, MNRAS, 408, L1
- Iwasawa et al. (2012) Iwasawa, K., Gilli, R., Vignali, C., et al. 2012, A&A, 546, A84
- Jia et al. (2013) Jia, J., Ptak, A., Heckman, T., & Zakamska, N. L. 2013, ApJ, 777, 27
- Kalberla et al. (2005) Kalberla, P. M. W., Burton, W. B., Hartmann, D., et al. 2005, A&A, 440, 775
- Koss et al. (2013) Koss, M., Mushotzky, R., Baumgartner, W., et al. 2013, ApJ, 765, L26
- Kraft et al. (1991) Kraft, R. P., Burrows, D. N., & Nousek, J. A. 1991, ApJ, 374, 344
- Lacy et al. (2015) Lacy, M., Ridgway, S. E., Sajina, A., et al. 2015, ArXiv e-prints, arXiv:1501.04118
- LaMassa et al. (2012) LaMassa, S. M., Heckman, T. M., & Ptak, A. 2012, ApJ, 758, 82
- LaMassa et al. (2009) LaMassa, S. M., Heckman, T. M., Ptak, A., et al. 2009, ApJ, 705, 568
- LaMassa et al. (2010) —. 2010, ApJ, 720, 786
- LaMassa et al. (2011) —. 2011, ApJ, 729, 52
- LaMassa et al. (2014) LaMassa, S. M., Yaqoob, T., Ptak, A. F., et al. 2014, ApJ, 787, 61
- Lansbury et al. (2014) Lansbury, G. B., Alexander, D. M., Del Moro, A., et al. 2014, ApJ, 785, 17
- Lanzuisi et al. (2009) Lanzuisi, G., Piconcelli, E., Fiore, F., et al. 2009, A&A, 498, 67
- Lanzuisi et al. (2015a) Lanzuisi, G., Ranalli, P., Georgantopoulos, I., et al. 2015a, A&A, 573, A137
- Lanzuisi et al. (2015b) Lanzuisi, G., Perna, M., Delvecchio, I., et al. 2015b, ArXiv e-prints, arXiv:1505.01153
- Lonsdale Persson & Helou (1987) Lonsdale Persson, C. J., & Helou, G. 1987, ApJ, 314, 513
- Luo et al. (2013) Luo, B., Brandt, W. N., Alexander, D. M., et al. 2013, ApJ, 772, 153
- Luo et al. (2014) —. 2014, ApJ, 794, 70
- Lutz et al. (2004) Lutz, D., Maiolino, R., Spoon, H. W. W., & Moorwood, A. F. M. 2004, A&A, 418, 465
- Madsen et al. (2015) Madsen, K. K., Harrison, F. A., Markwardt, C., et al. 2015, ArXiv e-prints, arXiv:1504.01672
- Magdziarz & Zdziarski (1995) Magdziarz, P., & Zdziarski, A. A. 1995, MNRAS, 273, 837
- Maiolino et al. (1998) Maiolino, R., Salvati, M., Bassani, L., et al. 1998, A&A, 338, 781
- Mateos et al. (2013) Mateos, S., Alonso-Herrero, A., Carrera, F. J., et al. 2013, MNRAS, 434, 941
- Mateos et al. (2010) Mateos, S., Carrera, F. J., Page, M. J., et al. 2010, A&A, 510, A35
- Mateos et al. (2015) Mateos, S., Carrera, F. J., Alonso-Herrero, A., et al. 2015, ArXiv e-prints, arXiv:1501.04335
- Murphy & Yaqoob (2009) Murphy, K. D., & Yaqoob, T. 2009, MNRAS, 397, 1549
- Nandra et al. (2013) Nandra, K., Barret, D., Barcons, X., et al. 2013, ArXiv e-prints, arXiv:1306.2307
- Nousek & Shue (1989) Nousek, J. A., & Shue, D. R. 1989, ApJ, 342, 1207
- Ptak et al. (2006) Ptak, A., Zakamska, N. L., Strauss, M. A., et al. 2006, ApJ, 637, 147
- Reyes et al. (2008) Reyes, R., Zakamska, N. L., Strauss, M. A., et al. 2008, AJ, 136, 2373
- Risaliti (2002) Risaliti, G. 2002, A&A, 386, 379
- Risaliti et al. (1999) Risaliti, G., Maiolino, R., & Salvati, M. 1999, ApJ, 522, 157
- Sanders et al. (1988) Sanders, D. B., Soifer, B. T., Elias, J. H., et al. 1988, ApJ, 325, 74
- Sargsyan et al. (2011) Sargsyan, L., Weedman, D., Lebouteiller, V., et al. 2011, ApJ, 730, 19
- Schmidt (1963) Schmidt, M. 1963, Nature, 197, 1040
- Schmidt & Green (1983) Schmidt, M., & Green, R. F. 1983, ApJ, 269, 352
- Scott et al. (2011) Scott, A. E., Stewart, G. C., Mateos, S., et al. 2011, MNRAS, 417, 992
- Simpson (2005) Simpson, C. 2005, MNRAS, 360, 565
- Smith et al. (2001) Smith, R. K., Brickhouse, N. S., Liedahl, D. A., & Raymond, J. C. 2001, ApJ, 556, L91
- Stern (2015) Stern, D. 2015, ArXiv e-prints, arXiv:1506.00162
- Stern et al. (2012) Stern, D., Assef, R. J., Benford, D. J., et al. 2012, ApJ, 753, 30
- Stern et al. (2014) Stern, D., Lansbury, G. B., Assef, R. J., et al. 2014, ApJ, 794, 102
- Takahashi et al. (2012) Takahashi, T., Mitsuda, K., Kelley, R., et al. 2012, in Society of Photo-Optical Instrumentation Engineers (SPIE) Conference Series, Vol. 8443, Society of Photo-Optical Instrumentation Engineers (SPIE) Conference Series, 1
- Teng et al. (2014) Teng, S. H., Brandt, W. N., Harrison, F. A., et al. 2014, ApJ, 785, 19
- Treister & Urry (2005) Treister, E., & Urry, C. M. 2005, ApJ, 630, 115
- Treister et al. (2010) Treister, E., Urry, C. M., Schawinski, K., Cardamone, C. N., & Sanders, D. B. 2010, ApJ, 722, L238
- Treister et al. (2009) Treister, E., Urry, C. M., & Virani, S. 2009, ApJ, 696, 110
- Ueda et al. (2014) Ueda, Y., Akiyama, M., Hasinger, G., Miyaji, T., & Watson, M. G. 2014, ApJ, 786, 104
- Ueda et al. (2003) Ueda, Y., Akiyama, M., Ohta, K., & Miyaji, T. 2003, ApJ, 598, 886
- Urry & Padovani (1995) Urry, C. M., & Padovani, P. 1995, PASP, 107, 803
- Vignali et al. (2006) Vignali, C., Alexander, D. M., & Comastri, A. 2006, MNRAS, 373, 321
- Vignali et al. (2010) Vignali, C., Alexander, D. M., Gilli, R., & Pozzi, F. 2010, MNRAS, 404, 48
- Vignali et al. (2014) Vignali, C., Mignoli, M., Gilli, R., et al. 2014, A&A, 571, A34
- Villar-Martín et al. (2012) Villar-Martín, M., Cabrera Lavers, A., Bessiere, P., et al. 2012, MNRAS, 423, 80
- Wachter et al. (1979) Wachter, K., Leach, R., & Kellogg, E. 1979, ApJ, 230, 274
- Weisskopf et al. (2007) Weisskopf, M. C., Wu, K., Trimble, V., et al. 2007, ApJ, 657, 1026
- Werner et al. (2004) Werner, M. W., Roellig, T. L., Low, F. J., et al. 2004, ApJS, 154, 1
- Wik et al. (2014) Wik, D. R., Hornstrup, A., Molendi, S., et al. 2014, ApJ, 792, 48
- Wilkes et al. (2013) Wilkes, B. J., Kuraszkiewicz, J., Haas, M., et al. 2013, ApJ, 773, 15
- Wright et al. (2010) Wright, E. L., Eisenhardt, P. R. M., Mainzer, A. K., et al. 2010, AJ, 140, 1868
- Wu et al. (2011) Wu, J., Brandt, W. N., Hall, P. B., et al. 2011, ApJ, 736, 28
- Yaqoob (1997) Yaqoob, T. 1997, ApJ, 479, 184
- York et al. (2000) York, D. G., Adelman, J., Anderson, Jr., J. E., et al. 2000, AJ, 120, 1579
- Zakamska et al. (2003) Zakamska, N. L., Strauss, M. A., Krolik, J. H., et al. 2003, AJ, 126, 2125
- Zakamska et al. (2006) —. 2006, AJ, 132, 1496
Here we give further information on the individual NuSTAR-observed candidate CTQSO2s
presented in this paper, namely relevant multiwavelength properties
and features which provide evidence for CT material (Section A.1). In the case of X-ray
properties, this Section focuses on the low energy ( keV)
Chandra and XMM-Newton data which was
available prior to the NuSTAR observations. For the broad-band X-ray
constraints incorporating high energy ( keV) NuSTAR data, which
generally suggest extreme absorption, see
Section 4.
In addition, we discuss the
identification of a strong Fe K line in the XMM-Newton spectrum
of SDSS J0011+0056, the single NuSTAR-detection in the exploratory candidate
CTQSO2 sample presented by L14 (Section A.2). Lastly, we
provide the near-UV to mid-IR photometric data used in the SED
modeling (Section A.3).
Appendix A A.1. Additional Information for Individual Objects
A.1. SDSS J075820.98+392336.0 (z=0.216)
Fitting an unabsorbed power law model to the XMM-Newton – keV data, we measure a flat effective photon index of , indicative of photoelectric absorption in the X-ray spectrum. This source is not detected (above the confidence level) with NuSTAR at – keV; see Section 3.1.
A.2. SDSS J084041.08+383819.8 (z=0.313)
From HST WFPC2 (F814W) imaging (Villar-Martín et al., 2012), the host has a spiral morphology, with evidence for a tidal feature. Humphrey et al. (2010) included this object in their integral-field observations of six SDSS-QSO2s and found spatially extended [O III] and [O II] emission on scales of up to kpc, consistent with being powered by AGN activity (e.g., via shocks or radiation). Using the available XMM-Newton – keV data for this object we measure , a low value suggestive of heavy absorption. This source is a non detection in the NuSTAR – keV data; see Section 3.1.
A.3. SDSS J121839.40+470627.7 (z=0.094)
The – keV XMM-Newton (obsID 0203270201) spectrum is modeled in J13 and LaMassa et al. (2012), who measure high column densities of cm-2 and cm-2, respectively. J13 measure a strong Fe K feature at keV with keV, consistent with CT absorption. This target is strongly detected with NuSTAR at – keV, allowing relatively detailed, broad-band spectral modeling which extends to high energies ( keV); see Section 4.1.1.
A.4. SDSS J124337.34–023200.2 (z=0.281)
Using HST ACS imaging, Zakamska et al. (2006) find that the host galaxy light profile is well fit by a de Vaucouleurs profile, implying an elliptical morphology. The host morphology is notably asymmetric. Zakamska et al. (2006) find no evidence for extinction in the host galaxy, suggesting that kpc-scale dust is not obscuring the AGN, and measure a blue excess in the nucleus which may be due to scattering or starburst emission.
Studying the existing Chandra data, we find an excess of emission at observed-frame keV (i.e., rest-frame keV). When fitting the continuum emission with a power law and the excess with a Gaussian component, we measure a rest-frame centroid energy compatible with Fe K ( keV), and a rest-frame equivalent width of keV. Although the emission is consistent with keV, which would suggest the presence of CT material, there are too few photon counts to rule out low equivalent widths. The object appears to have an extremely flat spectrum, with for the – keV energy band, indicating strong photoelectric absorption. This target is strongly detected at – keV with NuSTAR, allowing broad-band X-ray spectral modeling; see Section 4.1.2.
A.5. SDSS J171350.32+572954.9 (z=0.113)
The mid-IR spectrum, as measured with Spitzer-IRS (Sargsyan et al., 2011), is AGN-dominated and has evidence for shallow silicate (Si) absorption at m. The low energy X-ray properties of this source are detailed in Section 4.1.3. To summarise, an extremely steep spectral shape at – keV () suggests that the weak NuSTAR detection at – keV is the first identification of directly transmitted AGN emission from this system.
Appendix B A.2. An Iron Line in the X-ray Spectrum of SDSS J001111.97+005626.3
The keV X-ray spectrum of SDSS J0011+0056 was first presented in J13. L14 extended the X-ray analysis to high energies and used the NuSTAR/XMM-Newton band ratio to identify heavy, close to CT, absorption ( cm-2). L14 did not perform detailed spectral modeling, due to the low source counts ( net source counts). However, studying the XMM-Newton – keV spectrum we find evidence for an excess at observed-frame keV (i.e., rest-frame keV). Modeling the continuum emission with a power law and the excess with a Gaussian component, the rest-frame line centroid energy is in good agreement with that expected for Fe K line emission ( keV), and the rest-frame equivalent width is large ( keV). This strong Fe K emission suggests CT absorption, and it adds confidence to the high column density measured by L14.
Appendix C A.3. Near-ultraviolet to Mid-infrared Photometry
In Table 5 we provide the near-UV to mid-IR photometric data set for the five NuSTAR-observed QSO2s presented in this work, and the one presented in G14 (SDSS J1034+6001). This data set is adopted for the SED modeling in Section 3.3.
| SDSS J | 0758+3923 | 0840+3838 | 1034+6001 | 1218+4706 | 1243-0232 | 1713+5729 |
|---|---|---|---|---|---|---|
| (0.355 m)a | ||||||
| (0.468 m)a | ||||||
| (0.616 m)a | ||||||
| (0.748 m)a | ||||||
| (0.892 m)a | ||||||
| WISE (3.4 m)b | ||||||
| WISE (4.6 m)b | ||||||
| WISE (12 m)b | ||||||
| Spitzer (3.6 m)c | ||||||
| Spitzer (4.5 m)c | ||||||
| Spitzer (5.8 m)c | ||||||
| Spitzer (8.0 m)c |
Notes.
a SDSS DR7 model magnitudes in the AB sinh system, corrected for Galactic extinction.
b WISE magnitudes in the Vega system. We use the gmag
magnitude for SDSS J1713+5729, and profile-fit magnitudes for the remainder.
c Spitzer 3.8″ diameter aperture flux densities in
units of Jy.