Version dated: March 2, 2024
RH: Bayesian total-evidence dating
Bayesian total-evidence dating reveals the recent crown radiation of penguins
Alexandra Gavryushkina1,2, Tracy A. Heath3, Daniel T. Ksepka4, Tanja
Stadler5, David Welch1,2 and Alexei J. Drummond1,2
1Centre for Computational Evolution, University of Auckland, Auckland, New Zealand;
2Department of Computer Science, University of Auckland, Auckland, 1010, New Zealand;
3Department of Ecology, Evolution, & Organismal Biology, Iowa State University, Ames, IA, 50011, USA;
4Bruce Museum, Greenwich, CT, 06830, USA;
5Department of Biosystems Science & Engineering, Eidgenössische Technische Hochschule Zürich, 4058 Basel, Switzerland
Corresponding authors: Alexandra Gavryushkina and Alexei Drummond, Centre for Computational Evolution, University of
Auckland, Auckland, New Zealand; E-mail: sasha.gavryushkina@auckland.ac.nz, alexei@cs.auckland.ac.nz
Abstract
The total-evidence approach to divergence-time dating uses molecular and morphological data from
extant and fossil species to infer phylogenetic relationships, species divergence times, and macroevolutionary parameters in a single
coherent framework. Current model-based implementations of this approach lack an appropriate model for the
tree describing the diversification and fossilization process and can produce estimates that lead to erroneous conclusions. We address this shortcoming by providing a total-evidence
method implemented in a Bayesian framework.
This approach uses a mechanistic tree prior to describe the underlying diversification process that generated the tree of extant and fossil taxa.
Previous attempts to apply the total-evidence approach have used tree priors that do not
account for the possibility that fossil samples may be direct ancestors of other samples, that is, ancestors of fossil or extant species or of clades. The fossilized birth-death process explicitly
models the diversification, fossilization, and sampling processes and naturally allows for sampled ancestors. This model was recently applied to estimate divergence times based on
molecular data and fossil occurrence dates. We incorporate the fossilized birth-death model and a model of
morphological trait evolution into a Bayesian total-evidence approach to dating species phylogenies. We apply this method to extant
and fossil penguins and show that the modern penguins radiated much more recently than
has been previously estimated, with the basal divergence in the crown clade occurring at 12.7 Ma
and most splits leading to extant species occurring in the last 2 million years. Our results demonstrate that including stem-fossil diversity can greatly improve
the estimates of the divergence times of crown taxa. The method is available in BEAST2 (version 2.4) software www.beast2.org with
packages SA (version at least 1.1.4) and morph-models (version at least 1.0.4) installed.
Keywords: phylogenetics, MCMC, calibration, divergence times, birth-death process
Establishing the timing of evolutionary events is a major challenge in biology. Advances in molecular biology and computer science have enabled increasingly sophisticated methods for inferring phylogenetic trees. While the molecular data used to build these phylogenies are rich in information about the topological aspects of trees, these data only inform the relative timing of events in units of expected numbers of substitutions per site. The fossil record is frequently used to convert the timescale of inferred phylogenies to absolute time (Zuckerkandl and Pauling 1962, 1965). Exactly how to incorporate information from the fossil record into a phylogenetic analysis remains an active area of research.
Bayesian Markov chain Monte Carlo (MCMC) methods are now the major tool in phylogenetic inference (Yang and Rannala 1997; Mau et al. 1999; Huelsenbeck and Ronquist 2001) and are implemented in several widely used software packages (Lartillot et al. 2009; Drummond et al. 2012; Ronquist et al. 2012b; Bouckaert et al. 2014). To date species divergences on an absolute time scale, Bayesian approaches must include three important components to decouple the confounded rate and time parameters: (1) a model describing how substitution rates are distributed across lineages, (2) a tree prior characterizing the distribution of speciation events over time and the tree topology, and (3) a way to incorporate information from the fossil or geological record to scale the relative times and rates to absolute values. Relaxed molecular clock models act as prior distributions on lineage-specific substitution rates and their introduction has greatly improved divergence-dating methods (Thorne et al. 1998; Drummond et al. 2006; Rannala and Yang 2007; Drummond and Suchard 2010; Heath et al. 2012; Li and Drummond 2012). These models do not assume a strict molecular clock, instead they allow each branch in the tree to have its own rate of molecular evolution drawn from a prior distribution of rates across branches. Stochastic branching models describing the diversification process that generated the tree are typically used as prior distributions for the tree topology and branching times (Yule 1924; Kendall 1948; Nee et al. 1994; Rannala and Yang 1996; Yang and Rannala 1997; Gernhard 2008; Stadler 2009). When diversification models and relaxed-clock models are combined in a Bayesian analysis, it is possible to estimate divergence times on a relative time scale. External evidence, however, is needed to estimate absolute node ages.
Various approaches have been developed to incorporate information from the fossil record or biogeographical dates into a Bayesian framework to calibrate divergence-time estimates (Rannala and Yang 2003; Thorne and Kishino 2005; Yang and Rannala 2006; Ho and Phillips 2009; Heath 2012; Heled and Drummond 2012; Parham et al. 2012; Silvestro et al. 2014; Heled and Drummond 2015). Calibration methods (also called ‘node dating’) are the most widely used approaches for dating trees (Ho and Phillips 2009) where absolute branch times are estimated using prior densities for the ages of a subset of divergences in the tree. The placement of fossil-based calibration priors in the tree is ideally determined from prior phylogenetic analyses that include fossil and extant species, which could be based on analysis of morphological data alone, analysis of morphological data incorporating a backbone constraint topology based on molecular trees, or simultaneous analysis of combined morphological and molecular datasets. In practice, however, fossil calibrations are often based on identifications of apomorphies in fossil material or simple morphological similarity.
Node calibration using fossil constraints has two main drawbacks. First, having identified fossils as belonging to a clade, a researcher needs to specify a prior distribution on the age of the common ancestor of the clade. Typically the oldest fossil in the clade is chosen as the minimum clade age but there is no agreed upon method of specifying the prior density beyond that. One way to specify a prior calibration density is through using the fossil sampling rate that can be estimated from fossil occurrence data (Foote and Raup 1996). However, this approach must be executed with caution and attention to the quality of the fossil record for the clade of interest, as posterior estimates of divergence times are very sensitive to prior calibration densities of selected nodes (Warnock et al. 2012; Dos Reis and Yang 2013; Zhu et al. 2015; Warnock et al. 2015) meaning that erroneous calibrations lead to erroneous results (Heads 2012).
The second major concern about node calibration is that the fossilization process is modeled only indirectly and in isolation from other forms of data. A typical node-dating analysis is sequential: it first uses morphological data from fossil and extant species to identify the topological location of the fossils within a given extant species tree topology, then uses fossil ages to construct calibration densities, and finally uses molecular data to estimate the dated phylogeny. Treating the different types of data in this sequential manner implies an independence between the processes that produce the different types of data, which is statistically inaccurate and errors at any step can propagate to subsequent analyses. Furthermore, at the last step in the sequential analysis, multiple different prior distributions are applied to estimate the dated phylogeny: a tree prior distribution and calibration distributions. Since these distributions all apply to the same object, they interact and careful consideration must be given to their specification so as to encode only the intended prior information (Heled and Drummond 2012; Warnock et al. 2015). There is currently no efficient general method available to coherently specify standard tree priors jointly with calibration distributions (Heled and Drummond 2015).
In the total-evidence approach to dating (Lee et al. 2009; Pyron 2011; Ronquist et al. 2012a), one specifies a probabilistic model that encompasses the fossil data, molecular data and morphological data and then jointly estimates parameters of that model, including a dated phylogeny, in a single analysis using all available data. It builds on previously described methods for combining molecular and morphological data to infer phylogenies (Nylander et al. 2004) using a probabilistic model of trait evolution (the Mk model of Lewis 2001). The total-evidence approach to dating can be applied by employing a clock model and a tree prior distribution to calibrate the divergence times. The tree prior distribution describes the diversification process where fossil and extant species are treated as samples from this process. The placement of fossils and absolute branch times are determined in one joint inference rather than in separate analyses. The combination of clock models and substitution models for molecular and morphological data and a model of the process that generates dated phylogenetic trees with fossils comprises a full probabilistic model that generates all data used in the analysis.
This approach can utilize all available fossils as individual data points. In contrast, the node calibration method only directly incorporates the age of the oldest fossil of a given clade, typically as a hard minimum for the clade age. The overall fossil record of the clade can be indirectly incorporated as the basis for choosing a hard or soft maximum or to justify the shape of a prior distribution, however individual fossils aside from the oldest will not contribute directly (except perhaps if they are used to generate a confidence interval).
Although total-evidence dating overcomes limitations of other methods that use fossil evidence to date phylogenies, some aspects of the method still need to be improved (Arcila et al. 2015). One improvement is using better tree prior models. Previous attempts at total-evidence dating analyses have used uniform, Yule, or birth-death tree priors that do not model the fossil sampling process and do not allow direct ancestors among the sample (e.g., Pyron 2011; Ronquist et al. 2012a; Wood et al. 2013). However the probability of ancestor-descendant pairs among fossil and extant samples is not negligible (Foote 1996). Moreover, ancestor-descendant pairs need to be considered when incomplete and non-identified specimens are included in the analyses because such specimens might belong to the same single lineages as other better preserved fossils.
A good choice of the tree prior model is important for dating methods due to the limited amount of fossil data. Dos Reis and Yang (2013) and Zhu et al. (2015) showed that calibration methods are not statistically consistent, that is, increasing the amount of sequence data with a fixed number of calibration points does not decrease the uncertainty in divergence time estimates. Zhu et al. (2015) conjectured that total-evidence approaches are not statistically consistent, implying that the speciation process assumptions play a significant role in dating phylogenies.
The fossilized birth-death (FBD) model (Stadler 2010; Didiera et al. 2012; Stadler et al. 2013) explicitly models the fossilization process together with the diversification process and accounts for the possibility of sampled direct ancestors. Heath et al. (2014) used this model to estimate divergence times in a Bayesian framework from molecular data and fossil occurrence dates on a fixed tree topology. A comparison of different divergence dating methods showed that total-evidence analyses with simple tree prior models estimated significantly older divergence ages than analyses of molecular data and fossil occurrence dates with the FBD model (Arcila et al. 2015).
Until recently, combining the FBD model with a total-evidence dating approach was complicated by the fact that existing implementations of the MCMC algorithm over tree space did not allow trees with sampled ancestors. Gavryushkina et al. (2014) addressed this problem and enabled full Bayesian inference using FBD model in the BEAST2 software (Bouckaert et al. 2014) with the SA package (https://github.com/CompEvol/sampled-ancestors). This extended the Heath et al. (2014) method by allowing uncertainty in the tree topology of the extant species and placement of fossil taxa. Additionally, Zhang et al. (2016) implemented a variant of the FBD process that accounts for diversified taxon sampling and applied this to a total-evidence dating analysis of Hymenoptera (Ronquist et al. 2012a). This study demonstrated the importance of modeling the sampling of extant taxa when considering species-rich groups (Höhna et al. 2011).
Here we implement total-evidence dating with the FBD model by including morphological data to jointly estimate divergence times and the topological relationships of fossil and living taxa. We applied this method to a fossil-rich data set of extant and fossil penguins, comprising both molecular and morphological character data (Ksepka et al. 2012). Our analyses yield dated phylogenies of living and fossil taxa in which most of the extinct species diversified before the origin of crown penguins, congruent with previous estimates of penguin relationships based on parsimony analyses (Ksepka et al. 2012). Furthermore, our analyses uncover a significantly younger age for the most recent common ancestor (MRCA) of living penguins than previously estimated (Baker et al. 2006; Brown et al. 2008; Subramanian et al. 2013; Jarvis et al. 2014; Li et al. 2014).
Materials and Methods
MCMC approach
We developed a Bayesian MCMC framework for analysis of morphological and molecular data to infer divergence dates and macroevolutionary parameters. The MCMC algorithm takes molecular sequence data from extant species, morphological data from extant and fossil species and fossil occurrence dates (or fossil occurrence intervals) as input data and simultaneously estimates dated species phylogenies (tree topology and divergence times), macroevolutionary parameters, and substitution and clock model parameters. We assume here that the gene phylogeny coincides with the species phylogeny. The state space of the Markov chain is a dated species phylogeny, , substitution and clock model parameters, , and tree prior parameters, . The posterior distribution is,
where is a matrix of molecular and morphological data and is a vector of time intervals assigned to fossil samples. On the right hand side of the equation, there is a tree likelihood function, , a tree prior probability density, , prior probability densities for the parameters, and a probability density, , of obtaining stratigraphic ranges , given (remember, that defines the exact fossilization dates). The tree prior density is defined by equation (2) or (7) in Gavryushkina et al. (2014).
The full model describes the tree branching process, morphological and molecular evolution along the tree, fossilization events, and assignment of the stratigraphic ranges to fossil samples, since we do not directly observe when a fossilization event happened. Thus the stratigraphic ranges for the fossils are considered as data. We do not explicitly model the process of the age range assignment but assume that for a fossilization event that happened at time the probability of assigning ranges does not depend on (as a function) if and is zero otherwise. This implies that is a constant whenever the sampling times are within intervals and zero otherwise and we get:
| (1) |
where is a set of phylogenies with sampling nodes within corresponding intervals.
Modeling the speciation process
We describe the speciation process with the fossilized birth-death model conditioning on sampling at least one extant individual (equation 2 in Gavryushkina et al. 2014). This model assumes a constant rate birth-death process with birth rate and death rate where fossils are sampled through time according to a Poisson process with a constant sampling rate and extant species are sampled at present with probability . The process starts at some time in the past — the time of origin, where time is measured as a distance from the present. This process produces species trees with sampled two-degree nodes which we call sampled ancestors (following Gavryushkina et al. 2013, 2014). Such nodes represent fossil samples and lie directly on branches in the tree. They are direct ancestors to at least one of the other fossils or extant taxa that has been sampled.
We need to clarify what we mean by sampling. We have two types of sampling: fossil sampling and extant sampling. Suppose an individual from a population represented by a branch in the full species tree fossilized at some time in the past. Then this fossil was discovered, coded for characters and included in the analysis. This would correspond to a fossil sampling event. Further, if an individual from one of the extant species was sequenced or recorded for morphological characters and these data are included to the analysis we say that an extant species is sampled. Suppose one sampled fossil belongs to a lineage that gave rise to a lineage from which another fossil or extant species was sampled. In such a case we obtain a sampled ancestor, that is, the former fossil is a sampled ancestor and the species to which it belongs is ancestral to the species from which the other fossil or extant species was sampled. If two fossils from the same taxon with different age estimates are included in an analysis, the older fossil has the potential to be recovered as a direct ancestor and would be considered a sampled ancestor under our model.
In most cases, we re-parameterize the fossilized birth-death model with where
|
(2) |
These parameters are commonly used to describe diversification processes. We also use the standard parameterization assuming in some analyses. Note, that the time of origin is a model parameter as opposed to the previous application of the FBD model (Heath et al. 2014) where instead, the process was conditioned on the age of the MRCA, i.e., the oldest bifurcation node leading to the extant species, and all fossils were assumed to be descendants of that node. Here, we allow the oldest fossil to be the direct ancestor or sister lineage to all other samples because there is no prior evidence ruling those scenarios out.
Bayes factors
To assess whether there is a signal in the data for particular fossils to be sampled ancestors we calculated Bayes factors for each fossil. By definition a Bayes factor is:
where is the hypothesis that a fossil is a sampled ancestor, is the hypothesis that it is a terminal node, and is the combined model of speciation and morphological and molecular evolution. Thus is the posterior probability that a fossil is a sampled ancestor and that it is a terminal node and and are the corresponding prior probabilities.
The Bayes factor reflects the evidence contained in the data for identifying a fossil as a sampled ancestor and compares the prior probability to be a sampled ancestor to the posterior probability. However we could not calculate the probabilities and , so instead we looked at the evidence added by the morphological data towards identifying a fossil as a sampled ancestor to the evidence contained in the temporal data. That is, we replaced prior probabilities with posterior probabilities given that we sampled 19 extant species and 36 fossils and assigned age ranges to fossils, , and calculated analogues of the Bayes factors:
To approximate , we sampled from the distribution:
| (3) |
using MCMC. Having a sample from the posterior distribution (1) and a sample from the conditioned prior distribution (3) we calculated and as fractions of sampled trees in which the fossil appears as a sampled ancestor in corresponding MCMC samples. Similarly, we calculated and using trees in which the fossil is a terminal node.
Data
We analysed a data set from Ksepka et al. (2012) consisting of morphological data from fossil and living penguin species and molecular data from living penguins. The morphological data matrix used here samples 36 fossil species (we excluded Anthropornis sp. UCMP 321023 due to absence of the formal description for this specimen) and 19 extant species (we treated the Northern, Southern, and Eastern Rockhopper penguins as three distinct species for purpose of the analysis). The original matrix contained 245 characters. We excluded outgroup taxa (Procellariiformes and Gaviiformes) because including them would violate the model assumptions: a uniform sampling of extant species is assumed whereas the matrix sampled all extant penguins but only a small proportion of outgroup species and also did not sample any fossil taxa from these outgroups. We excluded characters that became constant after excluding outgroup taxa, resulting in a matrix of 202 characters. The morphological characters included in the matrix ranged from two- to seven-state characters. The majority of these characters (>95%) have fewer than four states. Further, 48 of the binary characters were coded as present/absent. The molecular alignment comprises the nuclear recombination-activating gene 1 (RAG-1), and the mitochondrial 12S, 16S, cytochrome oxidase 1 (CO1), and cytochrome b genes. Each region is represented by more than 1,000 sites with 8,145 sites in total. Some regions are missing for a few taxa.
The morphological dataset was originally developed to resolve the phylogenetic placement of fossil and extant penguins in a parsimony framework. Thus, efforts were focused on parsimony-informative characters. Though some apomorphic character states that are observed only in a single taxon are included in the dataset, no effort was made to document every possible autapomorphy. Thus such characters can be expected to be undersampled. As with essentially all morphological phylogenetic datasets, invariant characters were not scored.
We updated the fossil stratigraphic ages—previously summarized in Ksepka and Clarke (2010) — to introduce time intervals for fossil samples as presented in online supplementary material (SM), Table 1. For fossil species known from a single specimen, fossil stratigraphic ages represent the uncertainty related to the dating of the layer in which the fossil was found. For fossils known from multiple specimens, the ages were derived from the ages of the oldest and youngest specimens.
Morphological evolution and model comparison
We apply a simple substitution model for morphological character evolution — the Lewis Mk model (Lewis 2001), which assumes a character can take states and the transition rates from one state to another are equal for all states. We do not model ordered characters and treated 34 characters that were ordered in the Ksepka et al. (2012) matrix as unordered.
Evolution of morphological characters has a different nature from evolution of DNA sequences and therefore requires different assumptions. In contrast to molecular evolution models, we do not know the number of states each character can take and the number of states is not constant for different characters. We consider two ways to approach this problem. First we can assume that the number of possible states for a character is equal to the number of different observed states. Typically, one would count the number of different states in the data matrix for the character. Here, we obtained the number of observed states from the larger data matrix used in Ksepka et al. (2012) containing 13 outgroup species. Having the number of observed characters for each character, we partition the morphological data matrix in groups of characters having the same number of states and apply a distinct substitution model of the corresponding dimension to each partition. Another approach is to treat all the characters as evolving under the same model. The model dimension in this case is the maximum of the numbers of states observed for characters in the matrix. We refer to the first case as ‘partitioned model’ and to the second case as ‘unpartitioned model’. Another difference comes from the fact that typically only variable characters are recorded. Thus the second adjustment to the model accounts for the fact that constant characters are never coded. This model is called the Mkv model (Lewis 2001). We compared a model which assumed no variation in substitution rates of different morphological characters with a model using gamma distributed rates with a shared shape parameter for all partitions. We also compared a strict clock model and an uncorrelated relaxed clock model (Drummond et al. 2006) with a shared clock rate across partitions. To assess the impact of different parameterizations of the FBD model that induce slightly different prior distributions of trees we also considered two parameterizations (–parameterization versus –parameterization).
We completed a model selection analysis comparing different combinations of the assumptions for the Lewis Mk model, morphological substitution rates, and FBD model assumptions by running eight analyses of morphological data with different model settings. We then estimated the marginal likelihood of the model in each analysis using a path sampling algorithm (Baele et al. 2012), with 20 steps and -powers derived as quantiles of the Beta distribution with and . The traditional model selection tool is a Bayes factor, which is the ratio of the marginal likelihoods of two models: and . A Bayes factor greater than one indicates that model is preferred over model . Following this logic, the model that provides the best fit is the model with the largest marginal likelihood. The model combinations with marginal likelihoods are described in Table 1.
| # | Parti- tions | Gamma | Lewis model | Clock | Parameterization | Marginal log-likelihood from two runs |
|---|---|---|---|---|---|---|
| 1 | Mk | Strict | , | |||
| 2 | G | Mk | Strict | , | ||
| 3 | P | Mk | Strict | , | ||
| 4 | P | G | Mk | Strict | , | |
| 5 | P | Mk | Strict | () | , | |
| 6 | P | Mkv | Strict | , | ||
| 7 | P | G | Mkv | Strict | , | |
| 8111The analysis under model 8 has the largest marginal log-likelihood and was thus the model best supported by the data when evaluated using Bayes factors. | P | G | Mkv | Relaxed | , |
Posterior predictive analysis
For most of the bifurcation events in trees from the posterior samples of the penguin analyses only one lineage survives while another lineage goes extinct. This suggests a non-neutrality in the evolution of the populations. To assess whether the FBD model, which assumes all lineages in the tree develop independently, fits the data analyzed here, we performed the posterior predictive analysis following Drummond and Suchard (2008) under model 8 in Table 1. The idea of such an analysis is to compare the posterior distribution of trees to the posterior predictive distribution (Gelman et al. 2013) and this type of Bayesian model checking has been recently developed for a range of phylogenetic approaches (Rodrigue et al. 2009; Bollback 2002; Brown 2014; Lewis et al. 2014). The posterior predictive distribution can be approximated by the sample of trees simulated under parameter combinations drawn from the original posterior distribution. Out of computational convenience and similar to calculating for the Bayes factors, we conditioned the posterior predictive distribution on having sampled fossils within ranges, , used in the original analysis.
A way to compare posterior and posterior predictive distributions is to consider various tree statistics and calculate the tail-area probabilities by calculating the probability, which is simply the proportion of times when a given test statistic for the simulated tree exceeds the same statistic for the tree from the posterior distribution corresponding to the same parameters. Extreme values of , i. e., values that are less than 0.05 or greater than 0.95, would indicate the data favor a non-neutral scenario. For this analysis, we considered tree statistics which can be grouped into two categories: statistics that describe the branch length distribution and the tree shape. The test statistics and corresponding -values are summarized in Table 2.
| Description | Notation | -value222A value is the proportion of times a given test statistic for the simulated tree exceeds the value of that statistic for the tree from the posterior distribution.333All values are within [0.05, 0.95] |
| Branch length distribution statistics | ||
| The total length of all branches in the tree | 0.83 | |
| The ratio of the length of the subtree induced by extant taxa and the total tree length | 0.33 | |
| Genealogical Fu & Li’s calculated as the normalized difference between external branch length in the tree with suppressed sampled ancestor nodes and total tree length. | 0.5 | |
| The time of the MRCA of all taxa | 0.57 | |
| The time of the MRCA of all extant taxa | 0.46 | |
| Tree imbalance statistics | ||
| The maximum number of bifurcation nodes between a bifurcation node and the leaves summed over all bifurcation nodes except for the root | 0.75 | |
| Coless’s tree imbalance index calculated as the difference between the numbers of leaves on two sides of a node summed over all internal bifurcation nodes and divided by the total number of leaves. | 0.28 | |
| The number of cherries (two terminal nodes forming a monophyletic clade, sampled ancestors are suppressed) | 0.54 | |
| The number of sampled ancestors | SA | 0.26 |
Total-evidence analysis of penguins
For the total-evidence analysis of the penguin data set we chose the substitution and clock models for morphological character evolution with the largest marginal likelihood from the model comparison analysis (analysis 8 in Table 1). This model suggests that the data are partitioned in groups of characters with respect to the number of observed states. Each partition evolves under the Lewis Mkv model and the substitution rate varies across characters according to a Gamma distribution shared by all partitions. The morphological clock is modeled with an uncorrelated relaxed clock model with log-normal distributed rates. For molecular data we assume a general-time reversible model with gamma-distributed rate heterogeneity among sites (GTR+) for each of the five loci with separate rate, frequency, and gamma shape parameters for each partition. A separate log-normal uncorrelated relaxed clock model is assumed for the molecular data alignment. Each branch is assigned a total clock rate drawn from a log-normal distribution and this rate is scaled by a relative clock rate for each gene so that relative clock rates for five partitions sum up to one. We also ran the same analysis under the strict molecular clock. We assumed the FBD model as a prior distribution for time trees with uniform prior distributions for turnover rate and fossil sampling proportion, log-normal prior distribution for net diversification rate with 95% highest probability density (HPD) interval covering estimated in (Jetz et al. 2012) and sampling at present probability fixed to one since all modern penguins were included in the analyses. We also analyzed this data set under the birth-death model without sampled ancestors (Stadler 2010).
In addition to analyzing the full data set, we performed a separate analysis of only living penguins and the crown fossils, to examine the effect of ignoring the diversification of fossil taxa along the stem lineage. Crown fossils were selected if the fossil lineage was a descendant of the MRCA of all extant species with a posterior probability greater than 0.05 in the full analysis (i.e., the analysis with stem and crown fossils). Thus, this analysis includes 6 fossils (listed in Table 3) and all living penguins. For this analysis we did not condition on recording only variable characters (i.e., we used the Mk model) because after removing a large proportion of stem fossils, some characters become constant.
| Fossil444The six fossils with probabilities greater than 0.05 were used for the total-evidence analysis without stem fossils. | Probability |
| Spheniscus megaramphus | 0.9992 |
| Spheniscus urbinai | 0.9991 |
| Pygoscelis grandis | 0.9928 |
| Spheniscus muizoni | 0.9201 |
| Madrynornis mirandus | 0.9007 |
| Marplesornis novaezealandiae | 0.1652 |
| Palaeospheniscus bergi | 0.0001 |
| Palaeospheniscus biloculata | 0.0001 |
| Palaeospheniscus patagonicus | 0.0001 |
| Eretiscus tonnii | 0.0001 |
Summarizing trees
First we summarized the posterior distribution of full trees using summary methods from Heled and Bouckaert (2013). As a summary tree we used the maximum sampled-ancestor clade credibility tree. A maximum sampled-ancestor clade credibility tree is a tree from the posterior sample that maximizes the product of posterior clade probabilities. Here, a clade denotes two types of objects. The first type is a monophyletic set of taxa with a bifurcation node as the MRCA. Such clades are completely defined by a set of taxon labels meaning that we do not distinguish between clades with the same taxon set but different topologies. The second type is a monophyletic set of taxa with a two-degree sampled node as the MRCA. This can happen when one of the taxa in the group is a sampled ancestor and it is ancestral to all the others in the clade. Then this taxon will be the MRCA of the whole group assuming it is an ancestor to itself. These clades are defined by the pair where are taxon labels and , , is the taxon that is ancestral to all taxa in the clade.
Second, we removed all fossil lineages from the posterior trees thereby suppressing two-degree nodes and then summarized the resulting trees (which are strictly bifurcating) with a maximum clade credibility tree with common ancestor ages. To assign a common ancestor age to a clade, we consider a set of taxa contained in the clade and find the age of the MRCAs of these taxa in every posterior tree (including the trees where these taxa are not monophyletic) and take the mean of these ages.
Results and Discussion
Model comparison
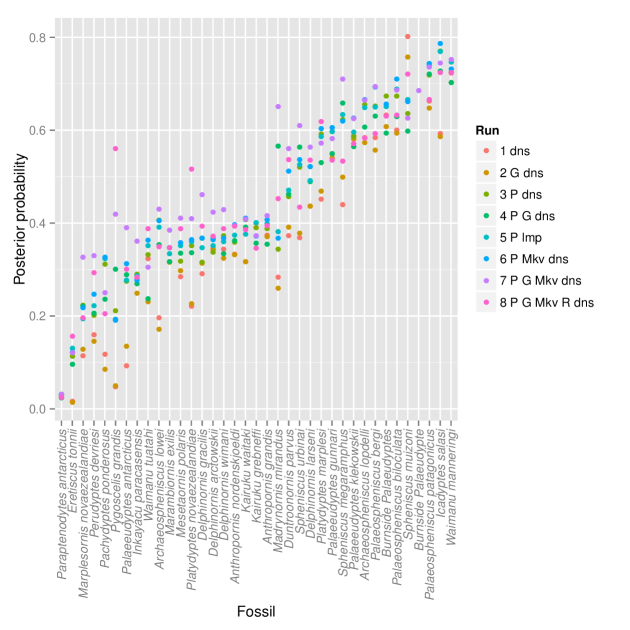
For each of the eight analyses listed in Table 1, we plotted the probability of each fossil to be a sampled ancestor (Figure 1). This shows that assumptions about the clock and substitution models as well as the tree prior model contribute to identifying a fossil as a sampled ancestor. The comparison of the marginal likelihoods for different assumptions about the clock and substitution models shows that the substitution model where characters are partitioned in groups with the same number of states and with gamma variation in the substitution rate across characters is the best model for this dataset.
Posterior predictive analysis
The posterior predictive analysis did not reject the FBD process, where lineages evolve independently of each other, as an adequate model for describing the speciation-extinction-fossilization-sampling process for these data. The values for all nine statistics were within the interval (Table 2). The plots of the posterior and posterior predictive distributions for several statistics (Fig. 2) show that there is no obvious discrepancy in these distributions. Thus there is no signal in the data to reject a neutral diversification of penguins.
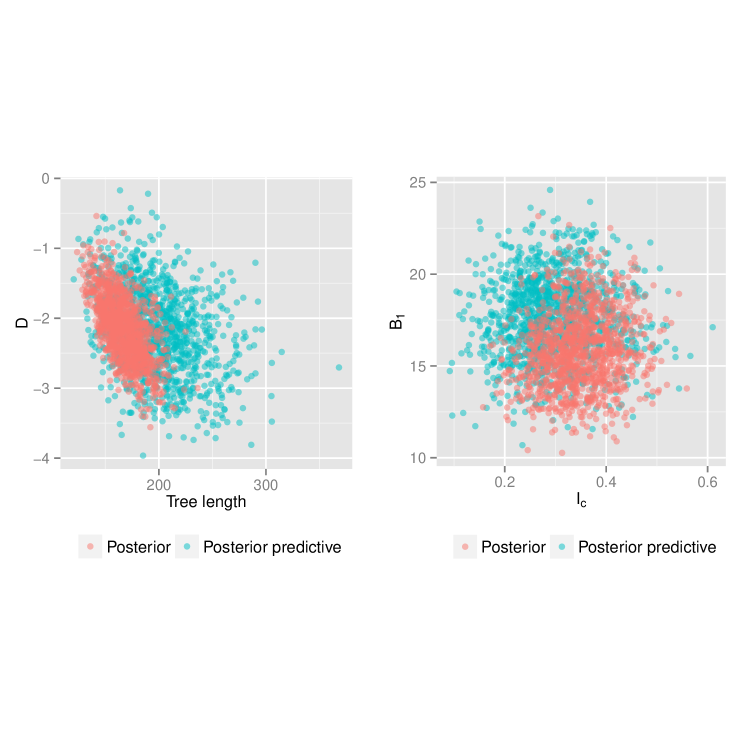
In this analysis, we conditioned the posterior predictive distribution to have the given age ranges. To assess the overall fit of the FBD model, one needs to perform a posterior predictive analysis where the posterior predictive distribution is not conditioned on the age ranges nor on the number of sampled nodes. We have not performed such an analysis.
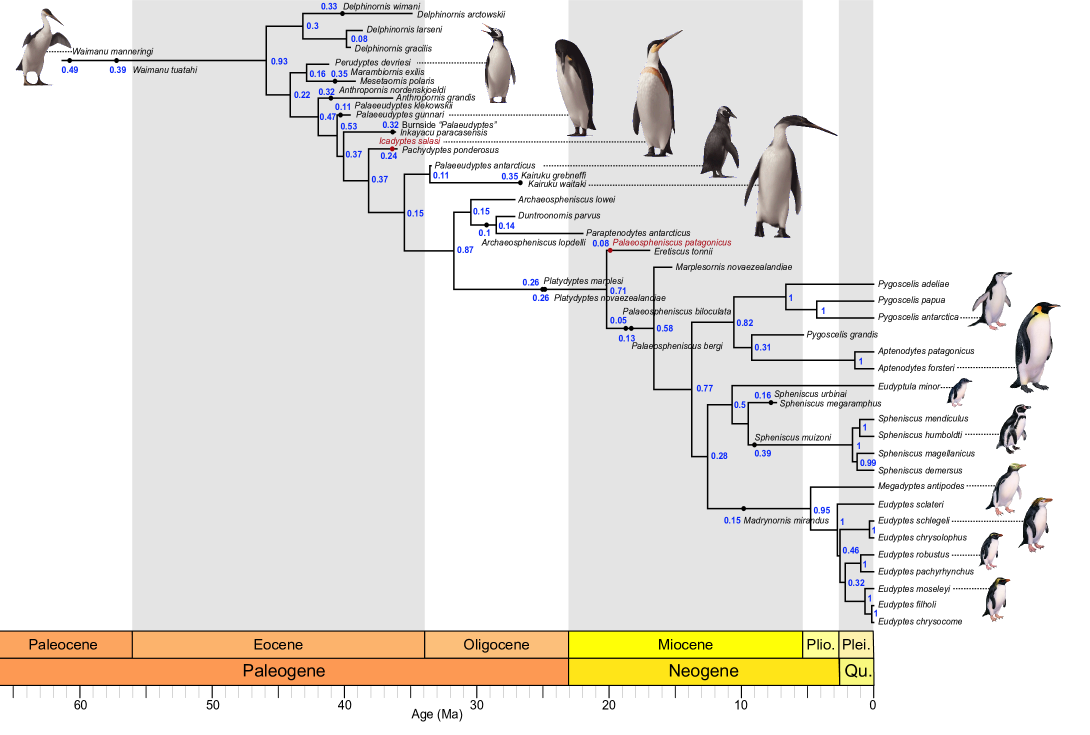
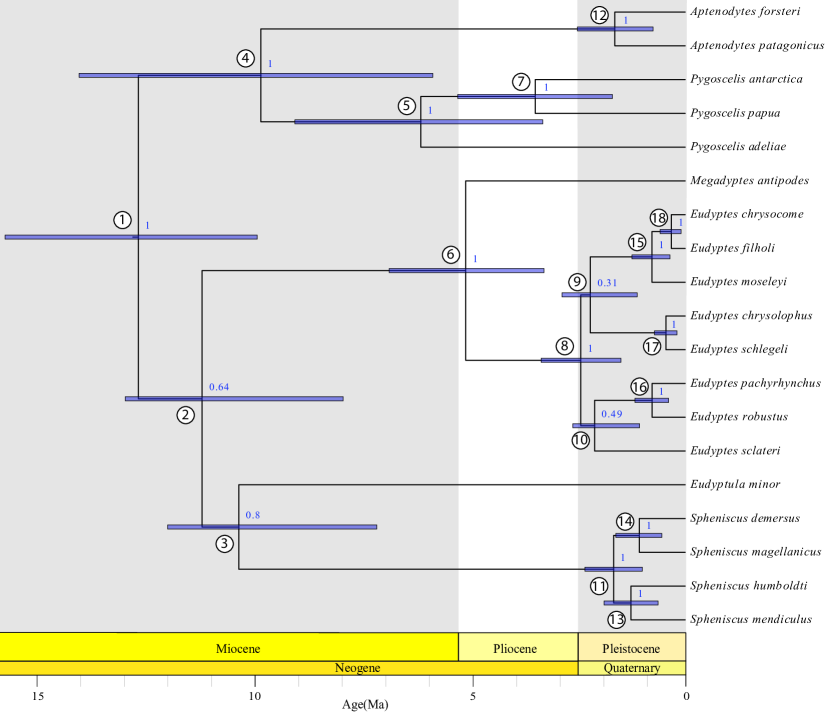
Penguin phylogeny
The maximum sampled-ancestor clade credibility tree (MSACC tree) (Fig. 3) shows that most of the penguin fossils do not belong to the crown clade and that the crown clade Spheniscidae originated only 12.7 million years ago. The posterior probabilities of most clades including fossils are low, reflecting the large uncertainty in the topological placement of the fossil taxa, whereas many clades uniting extant taxa receive substantially higher posterior probabilities.
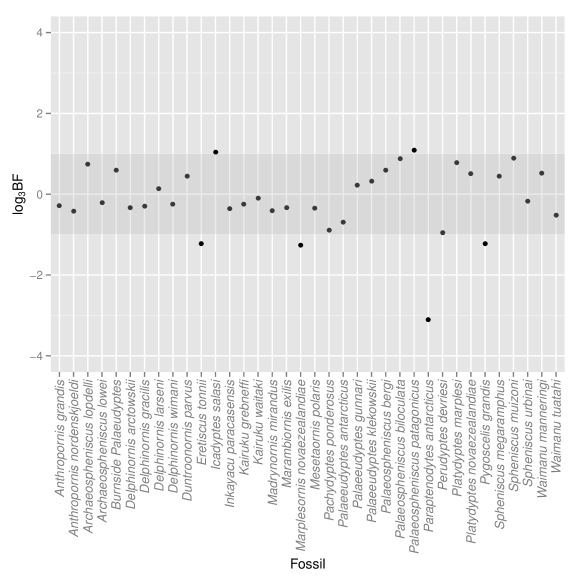
We calculated Bayes factors for all fossils to be sampled ancestors assuming the prior probability that a fossil is a sampled ancestor is defined by the tree prior model conditioned on the number of sampled extant and fossil species and assigned sampling intervals. Adding comparative (morphological and molecular) data to the sample size and sampling intervals provides positive evidence that the fossil taxa representing the species Palaeospheniscus patagonicus and Icadyptes salasi are sampled ancestors. Eretiscus tonnii, Marplesornis novaezealandiae, Paraptenodytes antarcticus and Pygoscelis grandis show positive evidence to be terminal samples (Fig. 4).
Due to the large uncertainty in the topological placement of fossil taxa, the relationships displayed in the summary tree are not the only ones supported by the posterior distribution. Thus, in some cases an alternate topology cannot be statistically rejected and a careful review of the entire population of sampled trees is required to fully account for this. Below, we summarize the features of the MSACC topology that differ from previous estimates of penguin phylogeny, keeping this uncertainty in mind.
The relationships within each genus are similar to those reported in previous parsimony analyses of the dataset (Ksepka et al. 2012), with some exceptions within the crested penguin genus Eudyptes. These agree with the results of Baker et al. (2006) based on Bayesian analysis of the same molecular loci (without morphological data), though it should be noted that our Bayesian analysis shows a degree of uncertainty in the resolution of the Eudyptes clade. The summary tree obtained after removing fossil taxa displays a different set of relationships within Eudyptes with high posterior probabilities (Fig. 5).
Allowing fossils to represent ancestors yields several interesting results. Although there is no evidence in comparative data to support an ancestral position for Spheniscus muizoni (Fig. 4) the combined comparative and temporal data yields the posterior probability of 0.61 that it is an ancestor of the extant Spheniscus radiation (that is, in 61% of the posterior trees, this taxon is a direct ancestor of the four extant Spheniscus species and possibly some other species as well). The ancestral position is consistent with the morphological data set: S. muizoni preserves a mix of derived character states that support placement within the Spheniscus clade and primitive characters which suggests it falls outside the clade formed by the four extant Spheniscus species. Furthermore, at least for the discrete characters sampled, it does not exhibit apomorphies providing direct evidence against ancestral status.
Madrynornis mirandus is recovered as ancestor to the Eudyptes + Megadyptes clade, though this placement receives low posterior probability (0.15). This fossil taxon was inferred as the sister taxon to Eudyptes by several previous studies (Hospitaleche et al. 2007; Ksepka and Clarke 2010; Ksepka et al. 2012); though see Chávez Hoffmeister et al. (2014), and so had been recommended as a calibration point for the Eudyptes-Megadyptes divergence (Ksepka and Clarke 2010) and used as such (Subramanian et al. 2013). In our analysis, a Megadyptes + Eudyptes clade excluding Madrynornis is present in all posterior trees, that is, the results reject the possibility that this taxon is the sister taxon to Eudyptes and its use as a calibration point is in need of further scrutiny. Our results indicate a 0.9 posterior probability that Madrynornis mirandus belongs in the crown, but do not provide solid support for the precise placement of this fossil taxon. Presumably the position of Madrynornis mirandus outside of Eudyptes + Megadyptes clade is at least partially attributable to the temporal data — its age means a more basal position is more consistent with the rest of the data.
Most of the clades along the stem receive very low posterior probabilities, which is not unexpected given that some stem penguin taxa remain poorly known, with many morphological characters unscorable. These clades correspond to the large polytomies from Ksepka et al. (2012) (polytomies are not allowed in the summary method we used here). Of particular note is the placement of Palaeospheniscus bergi and Palaeospheniscus biloculata on a branch along the backbone of the tree leading to all modern penguin species. Palaeospheniscus penguins share many synapomorphies with crown penguins and only a single feature in the matrix (presence of only the lateral proximal vascular foramen of the tarsometatarsus) contradicts this possibility (and supports their forming a clade with Eretiscus tonnii in the strict consensus of Ksepka et al. 2012). The posterior distribution of our analysis supports a clade containing the three Palaeospheniscus species and Eretiscus tonnii with probability 0.06, and so this relationship cannot be ruled out.
Overall, the estimated clades with large posterior probabilities (greater than 0.5) agree with those clades previously estimated from the same data set using parsimony methods (Ksepka et al. 2012). Low posterior probability values are due to the sparse morphological data (and complete lack of molecular data) for many early stem taxa. Several species such as Palaeeudyptes antarcticus are based on very incomplete fossils, in some cases a single element, and so we view the relationships estimated for deep stem penguins as incompletely established for the time being. Despite the high degree of uncertainty in the phylogenetic relationships of fossil species, the overall support for the general scenario placing most fossil penguins along the stem with a recent appearance of crown penguins is strong. To better describe, measure, and visualize the topological uncertainty of total-evidence analyses, methods similar to Billera et al. (2001), Owen and Provan (2011), and Gavryushkin and Drummond (2016) should be developed for serially sampled trees with sampled ancestors.
Divergence dates
We estimated the divergence dates for extant penguins (Fig. 5 and SM, Table 4). In general, the estimates are younger than those reported in previous studies: (Baker et al. 2006; Brown et al. 2008; Subramanian et al. 2013; Jarvis et al. 2014; Li et al. 2014). Baker et al. (2006) used the penalized-likelihood approach (Sanderson 2002) with secondary calibrations, and estimated the origin of crown penguins to be 40.5 Ma (95% confidence interval: 34.2–47.6 Ma). Brown et al. (2008, Fig. 4) estimated this age at 50 Ma using a Bayesian approach with uncorrelated rates and 20 calibrations distributed through Aves, including the stem penguin Waimanu manneringi. Subramanian et al. (2013) estimated a much younger crown age by using a Bayesian analysis with node calibration densities based on four fossil penguin taxa: Waimanu manneringi, Madrynornis mirandus, Spheniscus muizoni, and Pygoscelis grandis. Their estimate of the age of the MRCA of the extant penguins was 20.4 Ma (95% HPD interval: 17–23.8 Ma) (Subramanian et al. 2013). Most recently, (Jarvis et al. 2014; Li et al. 2014) estimated the age of the crown penguins at 23 Ma (95% confidence interval: 6.9–42.8 Ma) using a Bayesian method in MCMCTree (Dos Reis and Yang 2011) based on genomes from two penguin species (Aptenodytes forsteri and Pygoscelis adeliae) and calibrations for higher avian clades including Waimanu manneringi. Notably, this last date can be considered applicable to the crown only if Aptenodytes or Pygoscelis is the sister taxon to all other penguins, otherwise this date applies to a more nested node, implying an older age for the crown.
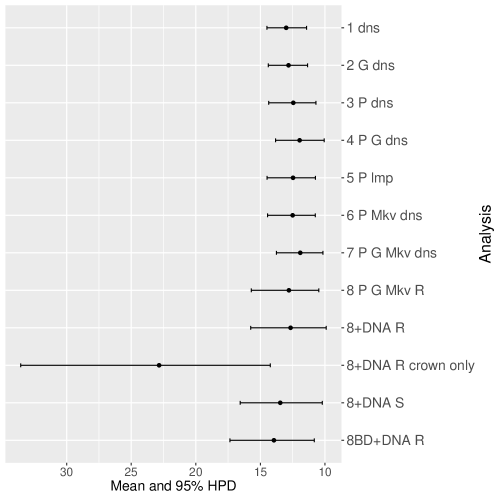
Our total-evidence analysis under the FBD model suggests that the MRCA is younger than any of these previous estimates at 12.7 Ma (95% HPD interval [9.9,15.7]; see Fig. 5 and SM, Table 4). We assert that this is the best constrained estimate of the age of the penguin crown clade to date, because it avoids potential pitfalls related to the use of secondary calibrations, samples all extant species, and most importantly includes all reasonably complete fossil taxa directly as terminals or sampled ancestors. This final point is crucial, not only because including fossils as terminals has been shown influence phylogenetic accuracy under many conditions (e.g., Hermsen and Hendricks 2008; Grande 2010; Hsiang et al. 2015), but also because at least one fossil taxon—previously used as a node calibration—was recovered at a more basal position in our results. The small gap between our 12.7 Ma estimate for the MRCA of extant penguins and the oldest identified crown fossil at 10 Ma is consistent with the fossil record of penguins as a whole, which includes a dense sampling of stem species from 60 Ma to 10 Ma, and only crown fossils from 10 Ma onwards. Moreover, our results suggest many extant penguin species are the product of recent divergence events, with 13 of 19 sampled species splitting from their sister taxon in the last 2 million years. Penguins have a relatively dense fossil record compared to other avian clades, with thousands of specimens known from four continents and spanning nearly the entirety of their modern day geographical range. If crown penguins originated at 20–50 Ma as implied by previous studies, it would require major ghost lineages (Clarke et al. 2007; Clarke and Boyd 2014), and thus a modest to extreme fossilization bias favoring the preservation of stem penguin fossils and disfavoring the preservation of crown penguin fossils. Such a bias is difficult to envision, as both stem and crown penguins share a dense bone structure and preference for marine habitats that would suggest similar fossilization potential.
Inclusion of stem fossil diversity has a profound impact on the inferred age of the penguin crown clade. To demonstrate this effect, we performed a total-evidence analysis including only living penguins and crown fossils (i.e., fossil taxa identified as crown penguins in our primarily analysis). Both the age estimate and the inferred uncertainty in the MRCA age of crown penguins increased substantially with the MRCA age shifting to 22.8 Ma (95% HPD interval: 14.2–33.6 Ma; Fig. 5). This shows that including the stem-fossil diversity allows for a better estimate of the crown age of penguins — one that is more consistent with the fossil record. Furthermore, these additional data points contribute to better estimates of diversification parameters.
For the complete analysis of stem and crown taxa, the mean estimate of the net diversification rate, , was 0.039 with [0.002, 0.089] HPD interval although this estimate is sensitive to the prior distribution (SM, Fig. 2), the turnover rate, , was 0.88 ([0.72, 1]) and the sampling proportion, , was 0.23 ([0.06, 0.43]).
The posterior distribution for the scale parameter of the log-normal distribution in the uncorrelated relaxed clock model for the molecular alignment was bimodal with a mode around 0.4 and a mode around zero. This suggested a strict molecular clock model might fit the data. The additional analysis of this data set under the strict molecular clock slightly shifted the estimates of the time of the MRCA of crown penguins toward the past although the posterior intervals largely overlap (Fig. 6).
Using the birth-death-sampling model without sampled ancestors (Stadler 2010) instead of the FBD model shifted the estimated divergence times toward the past (Fig. 6 and SM, Fig. 1). Gavryushkina et al. (2014) showed in simulation studies that ignoring sampled ancestors results in an increase in the diversification rate. We can observe the same trend here: the mean of the net diversification rate for the analysis under the birth-death model without sampled ancestors was 0.092 (95% HPD: [0.007, 0192]) compared to 0.039 ([0.002, 0.089]) for the FBD model. Although we would expect a decrease in the diversification rate in older trees on the same number of extant tips, in the birth-death model without sampled ancestors, a sampling event causes an extinction of the lineage. Thus, the diversification rate (here, modeled as the difference in the birth and death rates) does not account for the extinction ‘by sampling’. The mean estimate for , which better describes the diversification rate in the birth-death model without sampled ancestors, was 0.019 ([-0.061,0.099]).
Implications for crown penguin evolution
With many extant penguin species inhabiting extreme polar environments, penguin evolution is often considered through the lens of global climate change. The fossil record has revealed that, despite their celebrated success in modern polar environments, penguins originated during a warm period in Earth’s history, and the first Antarctic penguins were stem taxa that were distantly related to extant Antarctica species and arrived on that landmass prior to the formation of permanent polar ice sheets (Ksepka et al. 2006). However, our divergence estimates are consistent with global cooling having a profound impact on later stages of crown penguin radiation. The Middle Miocene Transition at 14 Ma marks the onset of a steady decline in sea surface temperature, heralding the onset of full-scale ice sheets in Antarctica (Zachos et al. 2001; Hansen et al. 2013; Knorr and Lohmann 2014). Expansion of Antarctic ice sheets may have opened a new environment for Aptenodytes and Pygoscelis, the most polar-adapted penguin taxa (including 4 of the 5 species that breed in continental Antarctica). Previous studies have placed Aptenodytes and Pygoscelis on basal branches of the penguin crown, leading to the hypothesis that crown penguins originated in Antarctica and spread to lower latitudes as climate cooled (Baker et al. 2006). However, the geographical distribution of stem fossils suggests instead that Aptenodytes and Pygoscelis secondarily invaded Antarctica, taking advantage of a novel environment (Ksepka et al. 2006). Our analysis provides additional support for this secondary colonization hypothesis by uniting Aptenodytes and Pygoscelis as a clade and revealing a very recent age for this Antarctic group at 9.8 Ma (Fig. 5), indicating they did not radiate until well after permanent ice sheets were established.
Morphological clock
We assume that clock models can be applied to morphological data. A recent study by Lee et al. (2014a) confirms that younger taxa undergo more morphological evolutionary change. Most previous total-evidence or morphological analyses used relaxed clock models for morphology evolution (Pyron 2011; Ronquist et al. 2012a; Lee et al. 2014a, b; Dembo et al. 2015; Zhang et al. 2016). In many studies (Beck and Lee 2014; Lee et al. 2014a; Dembo et al. 2015), including this study, model comparison analyses favored a relaxed morphological clock over a strict morphological clock.
The estimated coefficient of variation for the log-normal distribution of the morphological clock rates in the penguin analysis was 1.15 indicating a high rate variation among the branches. However, in our analysis, the choice of the morphological clock model did not influence much the estimate of the parameter of the primary interest — the age of the crown radiation. Using the relaxed clock model as opposed to the strict clock model only slightly shifted the age toward the past and inflated the 95% HPD interval (Fig. 6, analyses 7 and 8).
Many total-evidence analyses inferred implausibly old divergence dates (Ronquist et al. 2012a; Slater 2013; Wood et al. 2013; Beck and Lee 2014). Beck and Lee (2014) suggested that oversimplified modeling of morphological evolution and a relaxed morphological clock may result in overestimated divergence times. Our analysis did not show this and we, on the contrary, estimated a much younger age of the crown penguin radiation than had been previously estimated. This could be attributed to the large number of stem fossils in our analysis, given that excluding these fossils leads to a much older estimate. The overestimated ages can also be explained by sampling biases (Zhang et al. 2016) or using inappropriate tree prior models. Using a birth-death model without sampled ancestors in our analysis slightly shifted the ages of the crown divergences toward the past (Fig. 6 and SM, Fig. 1).
Sampled ancestors
We examined the total posterior probability of a fossil species to be a sampled ancestor, that is, a direct ancestor to other sampled fossil or extant species. If an ancestor-descendant pair is in question, one can also estimate the posterior probability of one species to be an ancestor to another species or a group of species as we calculated in the case of the probability of the Spheniscus muizoni representing an ancestor of extant Spheniscus radiation.
The evidence for ancestry comes from morphological data, fossil occurrence times and prior distributions for the parameters of the FBD model and morphological evolution model. Here, we used uniform prior distributions except for the net diversification rate and morphological evolution rate.
The analysis of the penguin data set shows a large number of potential sampled ancestors. The Bayes factors calculated here showed the ancestry evidence contained in the morphological data. The evidence coming from the occurrence times or from all data together remains to be assessed. We hypothesize that the large number of sampled ancestors is due to the temporal pattern of the penguin fossils. We additionally analyzed dinosaur (Lee et al. 2014b), trilobite (Congreve and Lieberman 2011), and Lissamphibia (Pyron 2011) datasets with large proportions of missing characters where we only detected up to four sampled ancestors (out of 40–120 fossils; data not shown). An analysis by Zhang et al. (2016) of Hymenoptera also did not show many sampled ancestors. Thus, the abundance of sampled ancestors in the penguin phylogeny is not likely to be due to the paucity of the morphological data.
Further improvements
Here we used the FBD model, which is an improvement over previously used uniform, Yule, or birth-death models for describing the speciation process. However other more sophisticated models may improve the inference or fit better for other data sets. The skyline variant of the FBD model (Stadler et al. 2013; Gavryushkina et al. 2014; Zhang et al. 2016) allows for stepwise changes in rates (i.e., diversification, turnover, and fossil sampling) over time. Accounting for the possibility of changes in fossil-sampling rate, , over time might be important for analyses considering groups of deeply diverged organisms where poor fossil preservation may result in underestimates of divergence times if the sampling rate is considered constant. Furthermore, models that allow age-dependent (Lambert et al. 2010; Hagen et al. 2015) or lineage-dependent (Maddison et al. 2007; Alfaro et al. 2009; Alexander et al. 2016) speciation and extinction rates while appropriately modeling fossil sampling may also improve divergence dating and estimation of macroevolutionary parameters.
Another direction of method development is modeling morphological character evolution — a topic that has sparked numerous debates (e.g., Goloboff 2003; Spencer and Wilberg 2013). A recent study by Wright and Hillis (2014) showed that Bayesian methods for estimating tree topologies using morphological data — even under a simple probabilistic Lewis Mk model — outperform parsimony methods, partly because rate variation is modeled. Here, we considered two schemes to assign a number of possible states to a character. The model comparison analysis favored the model where the number of possible states is equal to the number of observed states in a character. A more accurate modeling would be to consider each character and assign the number of states on the basis of the character description (for example, characters for traits that are either present or absent will be assigned two states) or use model averaging within an MCMC analysis where each character is assigned different number of states during the MCMC run. Moreover, it may also be important to appropriately model ascertainment bias when using the Lewis Mk model. These extensions include accounting for the absence of invariant and parsimony uninformative characters in the morphological data matrix (Koch and Holder 2012). Importantly, more biologically appropriate models of phenotypic characters are needed to advance phylogenetic methods for incorporating fossil data (e.g., Felsenstein 2005; Revell 2014). The total-evidence method with FBD can also be used to estimate the past evolutionary relationship between extinct species where only morphological data is available (Lee et al. 2014a).
We assigned age ranges to different fossils in differing ways. Some of the fossil species are known from only one fossil specimen and in this case, we assigned the age range based on the uncertainty related to the dating of the layer in which the fossil was found. For other species, there are a number of fossils found in different localities. In this case, we derived the age interval from probable ages of all specimens. In order to strictly follow the sampling process assumed by the FBD model, it would be necessary to treat every known fossil specimen individually and include all such specimens into an analysis. Unfortunately, this would lead to enormous data sets with thousands of taxa, most with very high proportions of missing data. However, in cases where a large number of fossils are known from the same locality and are thus very close in age and potentially belong to the same population, this group of fossils may be treated as just one sample from the relevant species at that time horizon. Such improved modeling would require devoting considerable effort to differentiating fossils and recording characters for particular specimens, rather than merging morphological data from different fossil specimens believed to belong to the same species. This could, however, lead to more accurate inference and better understanding of the past diversity.
Finally, our analysis focused on a matrix sampling all fossil penguins represented by reasonably complete specimens. Many poorly known fossil taxa have also been reported, along with thousands of isolated bones. Finding a balance between incorporating the maximum number of fossils, which inform sampling rate and time, and the computational concerns with adding large numbers of taxa with low proportions of informative characters will represent an important challenge for analyses targeting penguins and other groups with extensive fossil records.
We advocate the use of the total-evidence approach with models that allow sampled ancestors when estimating divergence times. This approach may offer advantages not only over node calibration methods that rely on first analyzing morphological data to identify calibration points and then calibrating phylogenies with ad hoc prior densities, but also over total-evidence methods that do not account for fossils that are sampled ancestors. Many recent applications of total-evidence dating have yielded substantially older estimates than node calibration methods (e.g., Ronquist et al. 2012a; Slater 2013; Wood et al. 2013; Beck and Lee 2014; Arcila et al. 2015). Among other explanations (Beck and Lee 2014; Zhang et al. 2016), using tree priors that do not account for sampled ancestors could have contributed to the ancient dates.
Funding
AG, DW, and AJD were partially supported by Marsden grant UOA1324 from the Royal Society of NZ. AJD was also supported by a Rutherford Discovery Fellowship from the Royal Society of New Zealand. TS is supported in part by the European Research Council under the Seventh Framework Program of the European Commission (PhyPD: grant agreement number 335529). TAH and DTK are supported by a US National Science Foundation grant DEB-1556615.
Acknowledgements
We thank Barbara Harmon and Steph Abramowicz for permission to use the penguin artwork in Figure 3. We also acknowledge the New Zealand eScience Infrastructure (NeSI) for use of their high-performance computing facilities. This manuscript was improved after helpful feedback from the editors, Thomas Near and Frank Anderson, and evaluations by Michael Lee, Jeff Thorne, and an anonymous reviewer.
Supplementary Material
Bayesian total evidence dating reveals the recent crown radiation of penguins
Methods
Prior distributions for parameters
We used the following prior distributions for the parameters in all analyses except for the sensitivity analyses.
For the net diversification rate, , we place a log-normal prior distribution with parameters111Parameters and for log-normal distributions here are the mean and standard deviation of the associated normal distributions and . The 2.5% and 97.5% quantiles of this distribution are and implying that it well covers the interval (with the lowest 5% quantile of 0.02 and the largest 95% quantile of 0.15) estimated in Jetz et al. (2012) Figure 1.
We place a Uniform(0,1) prior distribution for the turnover, , and Uniform(0,1) prior distribution for the fossil sampling proportion, .
For birth, death and sampling rates (, , and ) we used log-normal distributions with parameters11footnotemark: 1 and and 2.5% and 97.5% quantiles of and .
For the time of origin, , we use the Uniform prior distribution between the oldest sample and 160 Ma because Jetz et al. estimated the upper bound for the MRCA of all birds to be 150 Ma (Jetz et al. (2012) Figure 1) and Lee et al. Lee et al. (2014b) estimated the origin of the Avialae clade to about 160 Ma (uncertainty is not reported) in the analysis of morphological data of dinosaurs.
We used a broad lognormal distribution where the 95% probability interval spanned which is estimated for extinct dinosaurs in units of changes per character per Myr Lee et al. (2014b) for the rate of morphological evolution, (the mean of the log-normal distribution of the morphological clock rates). The parameters11footnotemark: 1 of this log-normal distribution are and , 2.5% and 97.5% quantiles are and , respectively.
— the rate of molecular evolution was assigned a lognormal prior with parameters11footnotemark: 1 and with 5% and 95% quantiles of and .
We placed a Gamma distribution with parameters and for the standard deviation of the uncorrelated lognormal relaxed models for both molecular and morphological data.
The gamma shape parameter on rate-variation across sites was assigned a Uniform[0,10] prior (for both molecular and morphological data).
Data
The number of characters with different numbers of states is given below:
| State # | 2 | 3 | 4 | 5 | 6 | 7 |
| Character # | 130 | 50 | 13 | 4 | 4 | 1 |
Out of 130 characters with two character states 48 have description ‘present or absent’. The number of sites in each region is as follows:
| Gene | RAG-1 | 12S | 16S | COI | cytochrome b |
|---|---|---|---|---|---|
| Site # | 2682 | 1143 | 1551 | 1105 | 1664 |
Fossil ages
We used the following age ranges for fossil penguins in our analyses (a compact summary is also given in Supplementary Table 1).
Taxon: Anthropornis grandis.
Age: 34–52.5 Ma.
Specimens are known from Telm 4 and Telm 7 of the La Meseta Formation Jadwiszczak (2006). Strontium dates from the stratigraphic column of Reguero et al. Reguero et al. (2012) provide ages for the bottom of Telm 4 and the top of Telm 7, which are applied as bounds.
Taxon: Anthropornis nordenskjoeldi.
Age: 34–52.5 Ma. The oldest specimens assigned to this species are potentially from Telm 4 or Telm 6 of the La Meseta Formation, while the specimens certainly referable to this species are known from Telm 7 Jadwiszczak (2006). Strontium dates from the stratigraphic column of Reguero et al. Reguero et al. (2012) provide ages for the bottom of Telm 4 and the top of Telm 7, which are applied as bounds.
Taxon: Archaeospheniscus lopdelli.
Age: 26–30Ma. The holotype and only described specimen comes from the Kokoamu Greensand, which is dated to between 26 Ma and 30 Ma (see Ksepka et al. (2012), Figure 1).
Taxon: Archaeospheniscus lowei.
Age: 26–30 Ma.
All three described specimens come from the Kokoamu Greensand, which is dated to between 26 Ma and 30 Ma (see Ksepka et al. (2012), Figure 1).
Taxon: Burnside “Palaeeudyptes” (this name is a placeholder for a species that has not yet been formally named).
Age: 36–38.4 Ma.
This fossil is from a section of the Burnside Formation that can be assigned to the Kaiatan NZ local stage (see Ksepka et al. (2012), Figure 1).
Taxon: Delphinornis arctowskii.
Age: 34–41 Ma.
We considered only tarsometatarsi to be firmly referable to this species. Such specimens are known only from Telm 7 of the La Meseta Formation Jadwiszczak (2006). Using the stratigraphic column of Reguero et al. Reguero et al. (2012), strontium dates for the top and bottom of Telm 7 are applied as bounds.
Taxon: Delphinornis gracilis.
Age: 34–41 Ma.
We considered only tarsometatarsi to be firmly referable to this species. Such specimens are known only from Telm 7 of the La Meseta Formation Jadwiszczak (2006). Using the stratigraphic column of Reguero et al. Reguero et al. (2012), strontium dates for the top and bottom of Telm 7 are applied as bounds.
Taxon: Delphinornis larseni.
Age: 34–52.5 Ma (species range).
We considered only tarsometatarsi to be firmly referable to this species. Such specimens are known from Telm 5 and Telm 7 of the La Meseta Formation Jadwiszczak (2006). Strontium dates for the top of Telm 7 and (because there was no strontium date for the base of Telm 5) the base of Telm 4 (which is very short and certainly 1 Ma) are used as bounds.
Taxon: Delphinornis wimani.
Age: 34–52.5 Ma.
We considered only tarsometatarsi to be firmly referable to this species. Such specimens are known from Telm 5 and Telm 7 of the La Meseta Formation Jadwiszczak (2006). Strontium dates for the top of Telm 7 and (because there was no strontium date for the base of Telm 5) the base of Telm 4 (which is very short and certainly 1 Ma) are used as bounds.
Taxon: Duntroonornis parvus.
Age: 21.7–30 Ma.
The holotype comes from the Kokoamu Greensand and some referred material comes from the Otekaike Limestone. Ages for the base of the Kokoamu Greensand and top of the Otekaike Limestone are used as bounds (see Ksepka et al. (2012), Figure 1).
Taxon: Eretiscus tonnii.
Age: 16–21 Ma.
A possible age range of 16–21 Ma is given based on Figure 2 of Cione et al. Cione et al. (2011).
Taxon: Icadyptes salasi.
Age: 35.7–37.2 Ma. This age is based on two radiometrically dated layers that are believed to be correlated with layers above and below the holotype and only reported specimen Clarke et al. (2007).
Taxon: Inkayacu paracasensis.
Age: 35.7–37.2 Ma.
This age is based on two radiometrically dated layers that are believed to be correlated with layers above and below the holotype and only reported specimen Clarke et al. (2007).
Taxon: Kairuku grebneffi.
Age: 26–30 Ma.
The holotype and one referred specimen come from the Kokoamu Greensand, which is dated to between 26 Ma and 30 Ma (see Ksepka et al. (2012), Figure 1).
Taxon: Kairuku waitaki.
Age: 26–30 Ma.
The holotype and only described specimen comes from the Kokoamu Greensand, which is dated to between 26 Ma and 30 Ma (see Ksepka et al. (2012), Figure 1).
Taxon: Madrynornis mirandus.
Age: 9.70–10.3 Ma.
The holotype and only known specimen is believed to be Ma in age based on strontium dates from the “Entrerriens” sequence of the Puerto Madryn Formation where the fossil was collected (see Hospitaleche et al. (2007)).
Taxon: Marambiornis exilis.
Age: 34–41 Ma. We considered only tarsometatarsi to be firmly referable to this species. Such specimens are known only from Telm 7 of the La Meseta Formation Jadwiszczak (2006). Using the stratigraphic column of Reguero et al. Reguero et al. (2012), strontium dates for the top and bottom of Telm 7 are applied as bounds.
Taxon: Marplesornis novaezealandiae.
Age: 5.33–15.97 Ma. This is one of the most difficult penguin fossils to date, because the specimen was found in a loose boulder on a beach that eroded out of a cliff of Great Sandstone deposits. Best estimates for the range of the Greta Siltstone from which the boulder is derived is middle-late Miocene Feldmann (1992), so a range of 5.33–15.97 is used.
Taxon: Mesetaornis polaris.
Age: 34–41 Ma. We considered only tarsometatarsi to be firmly referable to this species. Such specimens are known only from Telm 7 of the La Meseta Formation Jadwiszczak (2006). Using the stratigraphic column of Reguero et al. Reguero et al. (2012), strontium dates for the top and bottom of Telm 7 are applied as bounds.
Taxon: Pachydyptes ponderosus.
Age: 34.5–36 Ma. All known fossils of this species are all assigned to the Runangan NZ local stage, the bounds of which are used for the age range (see Ksepka et al. (2012), Figure 1).
Taxon: Palaeeudyptes antarcticus.
Age: 30.1–34.5. The holotype and only firmly referred specimen comes from the upper Ototara Limestone, which is assigned, to the Subbotina angiporoides zone of the local Whaingaroan Stage, which is in turn dated to between 30.1–34.5 (see Ksepka et al. (2012), Figure 1).
Taxon: Palaeeudyptes gunnari.
Age: 34–54 Ma. Specimens are known from Telm 3 and Telm 7 (top) of the La Meseta Formation Jadwiszczak (2006). Strontium dates for the top of Telm 7 and (because there was no strontium date for the base of Telm 3) the base of Telm 2 (which is very short and certainly Ma) are used as bounds.
Taxon: Palaeeudyptes klekowski.
Age: 34–52.5 Ma (species range).
We included the oldest potentially referable specimen from Telm 5 of the La Meseta Formation as well as the youngest specimens from Telm 7 Jadwiszczak (2006) in the age range. Strontium dates for the top of Telm 7 and (because there was no strontium date for the base of Telm 5) the base of Telm 4 (which is very short and certainly Ma) are used as bounds.
Taxon: Palaeospheniscus bergi.
Age: 9.7–21 Ma. Specimens are known from the Gaiman and Chenque Formations, which are contemporaneous, as well as a young record from the Puerto Madryn Formation Hospitaleche and Cione (2012). The age range extends from 21 Ma for the base of Gaiman Formation (Figure 2 of Cione et al. Cione et al. (2011)) to 9.7 Ma for the Puerto Madryn Formation record Hospitaleche et al. (2007).
Taxon: Palaeospheniscus biloculata.
Age: 16–21 Ma. A possible age range of 16–21 Ma is given based on Figure 2 of Cione et al. Cione et al. (2011) representing the duration of the Gaiman Formation.
Taxon: Palaeospheniscus patagonicus.
Age: 16–21 Ma. A possible age range of 16–21 Ma is given based on Figure 2 of Cione et al. Cione et al. (2011) representing the duration of the Gaiman Formation.
Taxon: Paraptenodytes antarcticus.
Age: 21–23 Ma. All known specimens are from the Monte Leon Formation. Chavez Chavez (2007) showed that reports of this species from the Bahia Inglesia were erroneous.
Taxon: Perudyptes devriesi.
Age: 38–46 Ma. An age of 42 Ma for the holotype and only known specimen is based on stratigraphic correlations and biostratigraphy Clarke et al. (2007, 2010). Given the lack of directly datable layers at the type locality, we extend this range by 4 Ma in either direction to accommodate uncertainty.
Taxon: Platydyptes novazealandiae.
Age: 23–26 Ma. All known specimens come from Oligocene sections of the Otekaike Limestone (see Ksepka and Ando (2011)).
Taxon: Platydyptes marplesi.
Age: 23–30 Ma. Specimens are known from the Kokoamu Greensand, providing the lower bound and the Otekaike Limestone, providing the upper bound of the age range (see Ksepka and Ando (2011)).
Taxon: Pygoscelis grandis.
Age: 2.5–8.6 Ma. The oldest specimens are from the Bonebed Member of the Bahia Inglesia Fm. and are from below a layer dated to Ma, whereas younger specimens are estimated to be 2.5–4.6 Ma based on biostratigraphy Walsh and Suárez (2006).
Taxon: Spheniscus megaramphus.
Age: 6.3–10 Ma. Stucchi Stucchi (2007) reported this specimens of this species in the Montemar Norte locality and Chavez Chavez (2007) reported material from the Bonebed Member of the Bahia Inglesia Fm. Montemar Norte was estimated to be 10 Ma by Stucchi Stucchi (2008), providing an upper age limit. Bonebed Member specimens are near a radiometric layer dated to Ma, providing the lower bound.
Taxon: Spheniscus muizoni.
Age: 9–9.2 Ma. The sole specimen is dated to between 9 and 9.2 Ma based on radiometric dates above and below the specimen Brand et al. (2011).
Taxon: Spheniscus urbinai.
Age: 5.7–9.63 Ma. Reported specimens have been recovered from the Sacaco, Sacaco Sur, Montemar, Aguada de Lomas and El Jajuay sites in the Pisco Formation acceding to Stucchi Stucchi (2007). The 5.7 Ma radiometric date for the top of Sacaco is based on Ehret et al. (2012) and the 9.38 Ma radiometric date for El Jahuay is taken from Brand et al. (2011).
Taxon: Waimanu manneringi.
Age: 60.5–61.6 Ma. The sole specimen is constrained to between 60.5Ma and 61.6Ma based on biostratigraphy Slack et al. (2006).
Taxon: Waimanu tuatahi.
Age: 56–60.5 Ma. The most well-constrained fossil of this taxon is dated to 58–60 Ma based on biostratigraphy Slack et al. (2006). Other referred fossils are less well-constrained and a conservative range would be 56–60.5 is specified with an upper age limit based on the age of Waimanu manneringi which was collected lower in the stratigraphic column and a lower age limit set to the Paleocene-Eocene boundary, as the fossils are all of Paleocene age.
| # | Fossil taxon | Age interval |
|---|---|---|
| 1 | Anthropornis grandis | [34, 52.5] |
| 2 | Anthropornis nordenskjoeldi | [34, 52.5] |
| 3 | Archaeospheniscus lopdelli | [26, 30] |
| 4 | Archaeospheniscus lowei | [26, 30] |
| 5 | Burnside “Palaeudyptes” | [36, 38.4] |
| 6 | Delphinornis arctowskii | [34, 41] |
| 7 | Delphinornis gracilis | [34, 41] |
| 8 | Delphinornis larseni | [34, 52.5] |
| 9 | Delphinornis wimani | [34, 52.5] |
| 10 | Duntroonornis parvus | [21.7, 30] |
| 11 | Eretiscus tonnii | [16, 21] |
| 12 | Icadyptes salasi | [35.7, 37.2] |
| 13 | Inkayacu paracasensis | [35.7, 37.2] |
| 14 | Kairuku grebneffi | [26, 30] |
| 15 | Kairuku waitaki | [26, 30] |
| 16 | Madrynornis mirandus | [9.7, 10.3] |
| 17 | Marambiornis exilis | [34, 41] |
| 18 | Marplesornis novaezealandiae | [5.33, 15.97] |
| 19 | Mesetaornis polaris | [34, 41] |
| 20 | Pachydyptes ponderosus | [34.5, 36] |
| 21 | Palaeeudyptes antarcticus | [30.1, 34.5] |
| 22 | Palaeeudyptes gunnari | [34, 54] |
| 23 | Palaeeudyptes klekowskii | [34, 52.5] |
| 24 | Palaeospheniscus bergi | [9.7, 21] |
| 25 | Palaeospheniscus biloculata | [16, 21] |
| 26 | Palaeospheniscus patagonicus | [16, 21] |
| 27 | Paraptenodytes antarcticus | [21, 23] |
| 28 | Perudyptes devriesi | [38, 42] |
| 29 | Platydyptes novaezealandiae | [23, 26] |
| 30 | Platydyptes marplesi | [23, 30] |
| 31 | Pygoscelis grandis | [2.5, 8.6] |
| 32 | Spheniscus megaramphus | [6.3, 10] |
| 33 | Spheniscus muizoni | [9, 9.2] |
| 34 | Spheniscus urbinai | [5.6, 9.63] |
| 35 | Waimanu manneringi | [60.5, 61.6] |
| 36 | Waimanu tuatahi | [56, 60.5] |
Validation
To validate the implementation of the models we simulated 100 trees under the FBD model with parameters:
We discarded trees with less than five or more than 250 sampled nodes resulting in 96 trees. Then we simulated sequences (1000 sites) along the trees for extant samples only under the GTR model with parameters:
and an uncorrelated relaxed log-normal model with parameters
| and |
and morphological characters for all samples (200 characters per sample) assuming each character has ten states under a separate uncorrelated relaxed log-normal model with parameters
| and |
| . |
We chose parameter values that are close to the parameters estimated in the total-evidence analysis of the penguin dataset.
We analysed simulated morphological data matrix, molecular sequence data and fossil sampling dates to estimate phylogenies, FBD model parameters, clock and substitution model parameters. Nine analysis did not converge (one analysis with 239 sampled nodes and eight analyses with too few fossil or extant samples, i.e., fewer than four). The estimates for the remaining 87 converged analysis are summarised in Supplementary Table 2.
| parameter | true value | mean of relative errors | mean of relative biases | mean of relative 95% HPD lengths | 95% HPD accuracy |
|---|---|---|---|---|---|
| 51 | 0.05 | 0.22 | 93 | ||
| 60 | 0.13 | 0.54 | 95 | ||
| 0.05 | 0.27 | 1.57 | 100 | ||
| 0.6 | 0.19 | 0.16 | 1.01 | 98 | |
| 0.2 | 0.52 | 95 | |||
| 0.8 | 0.11 | 0.08 | 0.66 | 100 | |
| 0.09 | 0.42 | 98 | |||
| 0.147 | 0.23 | 1.38 | 97 | ||
| 13.69 | 66.39 | 94 | |||
| (0.13) | () | (0.62) | (94) | ||
| 0.728 | 0.11 | 99 |
Results
Divergence dates
We performed several different analyses under different model configurations and report the age of the MRCA of modern penguins in Supplementary Table 3.
| Analysis # | Mean | 95% HPD |
|---|---|---|
| 1 | 13 | [11.43, 14.49] |
| 2 | 12.82 | [11.35, 14.39] |
| 3 | 12.45 | [10.7, 14.36] |
| 4 | 11.96 | [10.06, 13.83] |
| 5 | 12.47 | [10.74, 14.48] |
| 6 | 12.5 | [10.75, 14.45] |
| 7 | 11.91 | [10.16, 13.76] |
| 8 | 12.79 | [10.48, 15.7] |
| 8+dna R | 12.66 | [9.91, 15.75] |
| 8BD+dna R | 13.95 | [10.83, 17.36] |
| 8+dna S | 13.46 | [10.21, 16.56] |
| 8+dna R crown only | 22.84 | [14.23, 33.56] |
The estimated divergence dates and HPD intervals from the main analysis (same as Figure 4 in the main text) are given in Supplementary Table 4. We also performed a total evidence analysis under the birth-death model without sampled ancestors and estimated slightly older divergence dates (Supplementary Figure 1).
| Node | Mean | 95% HPD |
|---|---|---|
| 1 | 12.66 | [9.91, 15.75] |
| 2 | 11.19 | [7.92, 12.97] |
| 3 | 10.34 | [7.14, 11.98] |
| 4 | 9.83 | [5.84, 14.04] |
| 5 | 6.12 | [3.3, 9.04] |
| 6 | 5.08 | [3.27, 6.86] |
| 7 | 3.47 | [1.68, 5.27] |
| 8 | 2.42 | [1.49, 3.33] |
| 9 | 2.2 | [1.11, 2.85] |
| 10 | 2.1 | [1.05, 2.6] |
| 11 | 1.65 | [0.99, 2.32] |
| 12 | 1.63 | [0.74, 2.49] |
| 13 | 1.06 | [0.63, 1.88] |
| 14 | 1.06 | [0.54, 1.6] |
| 15 | 0.77 | [0.35, 1.23] |
| 16 | 0.76 | [0.38, 1.16] |
| 17 | 0.44 | [0.19, 0.71] |
| 18 | 0.32 | [0.09, 0.58] |
![[Uncaptioned image]](/html/1506.04797/assets/x7.png)
Sensitivity to the choice of prior distributions for the net diversification rate
Given enough comparative data of fossil and living samples, the FBD model allows us to estimate all hyper-parameters Gavryushkina et al. (2014). Thus, the true value of a parameter will be in the 95% HPD interval 95% of the time for analyses with uninformative priors for the FBD model hyper-parameters. Broad uninformative priors (for diversification rate which takes values from zero to infinity, for example) increase the time required for the convergence of an MCMC run. This is not an issue for the penguin dataset as it is relatively small. However, since we estimated marginal likelihoods for different models, the convergence time of a single analysis became important. To reduce this time we used a log-normal prior distribution for the net diversification rate. We investigated the impact of different prior distributions on the estimate of this parameter and on the parameter of the primary interest — the age of the MRCA of extant penguins. The results are shown in Supplementary Figure 2 and Supplementary Figure 3.
![[Uncaptioned image]](/html/1506.04797/assets/x8.png)
![[Uncaptioned image]](/html/1506.04797/assets/x9.png)
References
- Alexander et al. (2016) Alexander, H. K., A. Lambert, and T. Stadler. 2016. Quantifying age-dependent extinction from species phylogenies. Systematic Biology 65:35–50.
- Alfaro et al. (2009) Alfaro, M. E., F. Santini, C. Brock, H. Alamillo, A. Dornburg, D. L. Rabosky, G. Carnevale, and L. J. Harmon. 2009. Nine exceptional radiations plus high turnover explain species diversity in jawed vertebrates. Proceedings of the National Academy of Sciences, USA 106:13410–13414.
- Arcila et al. (2015) Arcila, D., R. A. Pyron, J. C. Tyler, G. Ortí, and R. Betancur-R. 2015. An evaluation of fossil tip-dating versus node-age calibrations in tetraodontiform fishes (Teleostei: Percomorphaceae). Molecular Phylogenetics and Evolution 82:131–145.
- Baele et al. (2012) Baele, G., P. Lemey, T. Bedford, A. Rambaut, M. A. Suchard, and A. V. Alekseyenko. 2012. Improving the accuracy of demographic and molecular clock model comparison while accommodating phylogenetic uncertainty. Molecular Biology and Evolution 29:2157–2167.
- Baker et al. (2006) Baker, A. J., S. L. Pereira, O. P. Haddrath, and K.-A. Edge. 2006. Multiple gene evidence for expansion of extant penguins out of Antarctica due to global cooling. Proceedings of the Royal Society B: Biological Sciences 273:11–17.
- Beck and Lee (2014) Beck, R. M. and M. S. Lee. 2014. Ancient dates or accelerated rates? morphological clocks and the antiquity of placental mammals. Proceedings of the Royal Society of London B: Biological Sciences 281:20141278.
- Billera et al. (2001) Billera, L. J., S. P. Holmes, and K. Vogtmann. 2001. Geometry of the space of phylogenetic trees. Advances in Applied Mathematics 27:733–767.
- Bollback (2002) Bollback, J. P. 2002. Bayesian model adequacy and choice in phylogenetics. Molecular Biology and Evolution 19:1171–1180.
- Bouckaert et al. (2014) Bouckaert, R., J. Heled, D. Künert, T. G. Vaughan, C.-H. Wu, D. Xie, M. A. Suchard, A. Rambaut, and A. J. Drummond. 2014. BEAST2: A software platform for Bayesian evolutionary analysis. PLoS Computational Biology 10:e1003537.
- Brand et al. (2011) Brand, L., M. Urbina, A. Chadwick, T. J. DeVries, and R. Esperante. 2011. A high resolution stratigraphic framework for the remarkable fossil cetacean assemblage of the Miocene/Pliocene Pisco Formation, Peru. Journal of South American Earth Sciences 31:414–425.
- Brown (2014) Brown, J. M. 2014. Predictive approaches to assessing the fit of evolutionary models. Systematic Biology 63:289–292.
- Brown et al. (2008) Brown, J. W., J. S. Rest, J. García-Moreno, M. D. Sorenson, and D. P. Mindell. 2008. Strong mitochondrial DNA support for a Cretaceous origin of modern avian lineages. BMC Biology 6:6.
- Chavez (2007) Chavez, M. F. 2007. Sobre la presencia de Paraptenodytes y Palaeospheniscus (Aves: Sphenisciformes) en la Formación Bahía Inglesa, Chile. Revista chilena de historia natural 80:255–259.
- Chávez Hoffmeister et al. (2014) Chávez Hoffmeister, M., J. D. C. Briceño, and S. N. Nielsen. 2014. The evolution of seabirds in the Humboldt Current: New clues from the Pliocene of central Chile. PloS one 9:e90043.
- Cione et al. (2011) Cione, A. L., M. A. Cozzuol, M. T. Dozo, and C. Acosta Hospitaleche. 2011. Marine vertebrate assemblages in the southwest Atlantic during the Miocene. Biological Journal of the Linnean Society 103:423–440.
- Clarke and Boyd (2014) Clarke, J. A. and C. A. Boyd. 2014. Methods for the quantitative comparison of molecular estimates of clade age and the fossil record. Systematic biology Page syu068.
- Clarke et al. (2010) Clarke, J. A., D. T. Ksepka, R. Salas-Gismondi, A. J. Altamirano, M. D. Shawkey, L. D’Alba, J. Vinther, T. J. DeVries, and P. Baby. 2010. Fossil evidence for evolution of the shape and color of penguin feathers. Science 330:954–957.
- Clarke et al. (2007) Clarke, J. A., D. T. Ksepka, M. Stucchi, M. Urbina, N. Giannini, S. Bertelli, Y. Narváez, and C. A. Boyd. 2007. Paleogene equatorial penguins challenge the proposed relationship between biogeography, diversity, and Cenozoic climate change. Proceedings of the National Academy of Sciences, USA 104:11545–11550.
- Congreve and Lieberman (2011) Congreve, C. R. and B. S. Lieberman. 2011. Phylogenetic and biogeographic analysis of sphaerexochine trilobites. PloS one 6:e21304.
- Dembo et al. (2015) Dembo, M., N. J. Matzke, A. Ø. Mooers, and M. Collard. 2015. Bayesian analysis of a morphological supermatrix sheds light on controversial fossil hominin relationships. Proceedings of the Royal Society of London B: Biological Sciences 282.
- Didiera et al. (2012) Didiera, G., M. Royer-Carenzib, and M. Laurinc. 2012. The reconstructed evolutionary process with the fossil record. Journal of Theoretical Biology 315:26–37.
- Dos Reis and Yang (2011) Dos Reis, M. and Z. Yang. 2011. Approximate likelihood calculation on a phylogeny for bayesian estimation of divergence times. Molecular Biology and Evolution 28:2161–2172.
- Dos Reis and Yang (2013) Dos Reis, M. and Z. Yang. 2013. The unbearable uncertainty of Bayesian divergence time estimation. Journal of Systematics and Evolution 51:30–43.
- Drummond et al. (2006) Drummond, A. J., S. Y. W. Ho, M. J. Phillips, and A. Rambaut. 2006. Relaxed phylogenetics and dating with confidence. PLoS Biology 4:e88.
- Drummond and Suchard (2008) Drummond, A. J. and M. A. Suchard. 2008. Fully Bayesian tests of neutrality using genealogical summary statistics. BMC Genetics 9:68.
- Drummond and Suchard (2010) Drummond, A. J. and M. A. Suchard. 2010. Bayesian random local clocks, or one rate to rule them all. BMC Biology 8:114.
- Drummond et al. (2012) Drummond, A. J., M. A. Suchard, D. Xie, and A. Rambaut. 2012. Bayesian phylogenetics with BEAUti and the BEAST 1.7. Molecular Biology and Evolution 29:1969–73.
- Ehret et al. (2012) Ehret, D. J., B. J. Macfadden, D. S. Jones, T. J. Devries, D. A. Foster, and R. Salas-Gismondi. 2012. Origin of the white shark Carcharodon (Lamniformes: Lamnidae) based on recalibration of the Upper Neogene Pisco Formation of Peru. Palaeontology 55:1139–1153.
- Feldmann (1992) Feldmann, R. M. 1992. Systematic and stratigraphic review with catalogue and locality index of the Mesozoic and Cenozoic decapod Crustacea of New Zealand. New Zealand Geological Survey Record 45:1–73.
- Felsenstein (2005) Felsenstein, J. 2005. Using the quantitative genetic threshold model for inferences between and within species. Philosophical Transactions of the Royal Society B: Biological Sciences 360:1427–1434.
- Foote (1996) Foote, M. 1996. On the probability of ancestors in the fossil record. Paleobiology 22:141–151.
- Foote and Raup (1996) Foote, M. and D. M. Raup. 1996. Fossil preservation and the stratigraphic ranges of taxa. Paleobiology 22:121–140.
- Gavryushkin and Drummond (2016) Gavryushkin, A. and A. J. Drummond. 2016. The space of ultrametric phylogenetic trees. Journal of Theoretical Biology In press.
- Gavryushkina et al. (2013) Gavryushkina, A., D. Welch, and A. J. Drummond. 2013. Recursive algorithms for phylogenetic tree counting. Algorithms for Molecular Biology 8:26.
- Gavryushkina et al. (2014) Gavryushkina, A., D. Welch, T. Stadler, and A. J. Drummond. 2014. Bayesian inference of sampled ancestor trees for epidemiology and fossil calibration. PLoS Computational Biology 10:e1003919.
- Gelman et al. (2013) Gelman, A., J. Carlin, H. Stern, D. Dunson, A. Vehtari, and D. Rubin. 2013. Bayesian Data Analysis, Third Edition. Chapman & Hall/CRC Texts in Statistical Science Taylor & Francis, Boca Raton, FL.
- Gernhard (2008) Gernhard, T. 2008. The conditioned reconstructed process. Journal of Theoretical Biology 253:769–778.
- Goloboff (2003) Goloboff, P. A. 2003. Parsimony, likelihood, and simplicity. Cladistics 19:91–103.
- Grande (2010) Grande, L. 2010. An empirical synthetic pattern study of gars (Lepisosteiformes) and closely related species, based mostly on skeletal anatomy. The resurrection of Holostei. Copeia 10:1–863.
- Hagen et al. (2015) Hagen, O., K. Hartmann, M. Steel, and T. Stadler. 2015. Age-dependent speciation can explain the shape of empirical phylogenies. Systematic Biology 64:432–440.
- Hansen et al. (2013) Hansen, J., M. Sato, G. Russell, and P. Kharecha. 2013. Climate sensitivity, sea level and atmospheric carbon dioxide. Philosophical Transactions of the Royal Society of London A: Mathematical, Physical and Engineering Sciences 371:20120294.
- Heads (2012) Heads, M. 2012. Bayesian transmogrification of clade divergence dates: A critique. Journal of Biogeography 39:1749–1756.
- Heath (2012) Heath, T. A. 2012. A hierarchical Bayesian model for calibrating estimates of species divergence times. Systematic Biology 61:793–809.
- Heath et al. (2012) Heath, T. A., M. T. Holder, and J. P. Huelsenbeck. 2012. A Dirichlet process prior for estimating lineage-specific substitution rates. Molecular Biology and Evolution 29:939–955.
- Heath et al. (2014) Heath, T. A., J. P. Huelsenbeck, and T. Stadler. 2014. The fossilized birth–death process for coherent calibration of divergence-time estimates. Proceedings of the National Academy of Sciences, USA 111:E2957–E2966.
- Heled and Bouckaert (2013) Heled, J. and R. R. Bouckaert. 2013. Looking for trees in the forest: Summary tree from posterior samples. BMC Evolutionary Biology 13:221.
- Heled and Drummond (2012) Heled, J. and A. J. Drummond. 2012. Calibrated tree priors for relaxed phylogenetics and divergence time estimation. Systematic Biology 61:138–49.
- Heled and Drummond (2015) Heled, J. and A. J. Drummond. 2015. Calibrated birth-death phylogenetic time-tree priors for bayesian inference. Syst Biol 64:369–83.
- Hermsen and Hendricks (2008) Hermsen, E. J. and J. R. Hendricks. 2008. W(h)ither fossils? Studying morphological character evolution in the age of molecular sequences. Annals of the Missouri Botanical Garden 95:72–100.
- Ho and Phillips (2009) Ho, S. Y. W. and M. J. Phillips. 2009. Accounting for calibration uncertainty in phylogenetic estimation of evolutionary divergence times. Systematic Biology 58:367–380.
- Höhna et al. (2011) Höhna, S., T. Stadler, F. Ronquist, and T. Britton. 2011. Inferring speciation and extinction rates under different sampling schemes. Molecular Biology and Evolution 28:2577–2589.
- Hospitaleche and Cione (2012) Hospitaleche, C. A. and A. L. Cione. 2012. The most recent record of †Palaeospheniscus bergi Moreno & Mercerat, 1891 (aves, spheniscidae) from the middle miocene, northeastern patagonia. Neues Jahrbuch für Geologie und Paläontologie-Abhandlungen 266:143–148.
- Hospitaleche et al. (2007) Hospitaleche, C. A., C. Tambussi, M. Donato, and M. Cozzuol. 2007. A new Miocene penguin from Patagonia and its phylogenetic relationships. Acta Palaeontologica Polonica 52:299–314.
- Hsiang et al. (2015) Hsiang, A. Y., D. J. Field, T. H. Webster, A. D. Behlke, M. B. Davis, R. A. Racicot, and J. A. Gauthier. 2015. The origin of snakes: Revealing the ecology, behavior, and evolutionary history of early snakes using genomics, phenomics, and the fossil record. BMC Evolutionary Biology 15:87.
- Huelsenbeck and Ronquist (2001) Huelsenbeck, J. P. and F. Ronquist. 2001. MRBAYES: Bayesian inference of phylogenetic trees. Bioinformatics 17:754–5.
- Jadwiszczak (2006) Jadwiszczak, P. 2006. Eocene penguins of Seymour Island, Antarctica: Taxonomy. Pol. Polar Res 27:3–62.
- Jarvis et al. (2014) Jarvis, E. D., S. Mirarab, A. J. Aberer, B. Li, P. Houde, C. Li, S. Y. Ho, B. C. Faircloth, B. Nabholz, J. T. Howard, et al. 2014. Whole-genome analyses resolve early branches in the tree of life of modern birds. Science 346:1320–1331.
- Jetz et al. (2012) Jetz, W., G. Thomas, J. Joy, K. Hartmann, and A. Mooers. 2012. The global diversity of birds in space and time. Nature 491:444–448.
- Kendall (1948) Kendall, D. G. 1948. On the generalized “birth-and-death” process. Annals of Mathematical Statistics 19:1–15.
- Knorr and Lohmann (2014) Knorr, G. and G. Lohmann. 2014. Climate warming during Antarctic ice sheet expansion at the Middle Miocene Transition. Nature Geoscience 7:376–381.
- Koch and Holder (2012) Koch, J. M. and M. T. Holder. 2012. An algorithm for calculating the probability of classes of data patterns on a genealogy. PLoS Currents: Tree of Life 4:doi: 10.1371/4fd1286980c08.
- Ksepka and Ando (2011) Ksepka, D. T. and T. Ando. 2011. Penguins past, present, and future: Trends in the evolution of the Sphenisciformes. Living Dinosaurs Pages 155–186.
- Ksepka et al. (2006) Ksepka, D. T., S. Bertelli, and N. P. Giannini. 2006. The phylogeny of the living and fossil Sphenisciformes (penguins). Cladistics 22:412–441.
- Ksepka and Clarke (2010) Ksepka, D. T. and J. A. Clarke. 2010. The basal penguin (Aves: Sphenisciformes) Perudyptes devriesi and a phylogenetic evaluation of the penguin fossil record. Bulletin of the American Museum of Natural History 337:1–77.
- Ksepka et al. (2012) Ksepka, D. T., R. E. Fordyce, T. Ando, and C. M. Jones. 2012. New fossil penguins (Aves, Sphenisciformes) from the Oligocene of New Zealand reveal the skeletal plan of stem penguins. Journal of Vertebrate Paleontology 32:235–254.
- Lambert et al. (2010) Lambert, A. et al. 2010. The contour of splitting trees is a Lévy process. The Annals of Probability 38:348–395.
- Lartillot et al. (2009) Lartillot, N., T. Lepage, and S. Blanquart. 2009. PhyloBayes 3: A Bayesian software package for phylogenetic reconstruction and molecular dating. Bioinformatics 25:2286–8.
- Lee et al. (2009) Lee, M., P. Oliver, and M. Hutchinson. 2009. Phylogenetic uncertainty and molecular clock calibrations: a case study of legless lizards (pygopodidae, gekkota). Molecular Phylogenetics and Evolution 50:661–666.
- Lee et al. (2014a) Lee, M. S., A. Cau, D. Naish, and G. J. Dyke. 2014a. Morphological clocks in paleontology, and a mid-Cretaceous origin of crown Aves. Systematic Biology 63:442–449.
- Lee et al. (2014b) Lee, M. S., A. Cau, D. Naish, and G. J. Dyke. 2014b. Sustained miniaturization and anatomical innovation in the dinosaurian ancestors of birds. Science 345:562–566.
- Lewis (2001) Lewis, P. O. 2001. A likelihood approach to estimating phylogeny from discrete morphological character data. Systematic Biology 50:913–25.
- Lewis et al. (2014) Lewis, P. O., W. Xie, M.-H. Chen, Y. Fan, and L. Kuo. 2014. Posterior predictive Bayesian phylogenetic model selection. Systematic Biology 63:309–321.
- Li et al. (2014) Li, C., Y. Zhang, J. Li, L. Kong, H. Hu, H. Pan, L. Xu, Y. Deng, Q. Li, L. Jin, et al. 2014. Two Antarctic penguin genomes reveal insights into their evolutionary history and molecular changes related to the Antarctic environment. GigaScience 3:27.
- Li and Drummond (2012) Li, W. L. S. and A. J. Drummond. 2012. Model averaging and bayes factor calculation of relaxed molecular clocks in bayesian phylogenetics. Mol Biol Evol 29:751–61.
- Maddison et al. (2007) Maddison, W. P., P. E. Midford, and S. P. Otto. 2007. Estimating a binary character’s effect on speciation and extinction. Systematic Biology 56:701–710.
- Mau et al. (1999) Mau, B., M. A. Newton, and B. Larget. 1999. Bayesian phylogenetic inference via Markov chain Monte Carlo methods. Biometrics 55:1–12.
- Nee et al. (1994) Nee, S., R. M. May, and P. H. Harvey. 1994. The reconstructed evolutionary process. Philosophical Transactions of the Royal Society B 344:305–311.
- Nylander et al. (2004) Nylander, J. A., F. Ronquist, J. P. Huelsenbeck, and J. Nieves-Aldrey. 2004. Bayesian phylogenetic analysis of combined data. Systematic Biology 53:47–67.
- Owen and Provan (2011) Owen, M. and J. S. Provan. 2011. A fast algorithm for computing geodesic distances in tree space. IEEE/ACM Transactions on Computational Biology and Bioinformatics (TCBB) 8:2–13.
- Parham et al. (2012) Parham, J. F., P. C. J. Donoghue, C. J. Bell, T. D. Calway, J. J. Head, and et al. 2012. Best practices for justifying fossil calibrations. Systematic Biology 61:346–359.
- Pyron (2011) Pyron, R. A. 2011. Divergence time estimation using fossils as terminal taxa and the origins of Lissamphibia. Systematic Biology 60:466–81.
- Rannala and Yang (1996) Rannala, B. and Z. Yang. 1996. Probability distribution of molecular evolutionary trees: A new method of phylogenetic inference. Journal of Molecular Evolution 43:304–311.
- Rannala and Yang (2003) Rannala, B. and Z. Yang. 2003. Bayes estimation of species divergence times and ancestral population sizes using DNA sequences from multiple loci. Genetics 164:1645–1656.
- Rannala and Yang (2007) Rannala, B. and Z. Yang. 2007. Inferring speciation times under an episodic molecular clock. Systematic Biology 56:453–466.
- Reguero et al. (2012) Reguero, M. A., S. A. Marenssi, and S. N. Santillana. 2012. Weddellian marine/coastal vertebrate diversity from a basal horizon (Ypresian, Eocene) of the Cucullaea I Allomember, La Meseta formation, Seymour (Marambio) Island, Antarctica. Rev peru biol 19:275–284.
- Revell (2014) Revell, L. J. 2014. Ancestral character estimation under the threshold model from quantitative genetics. Evolution 68:743–759.
- Rodrigue et al. (2009) Rodrigue, N., C. L. Kleinman, H. Philippe, and N. Lartillot. 2009. Computational methods for evaluating phylogenetic models of coding sequence evolution with dependence between codons. Molecular Biology and Evolution 26:1663–1676.
- Ronquist et al. (2012a) Ronquist, F., S. Klopfstein, L. Vilhelmsen, S. Schulmeister, D. L. Murray, and A. P. Rasnitsyn. 2012a. A total-evidence approach to dating with fossils, applied to the early radiation of the Hymenoptera. Systematic Biology 61:973–999.
- Ronquist et al. (2012b) Ronquist, F., M. Teslenko, P. van der Mark, D. L. Ayres, A. Darling, S. Höhna, B. Larget, L. Liu, M. A. Suchard, and J. P. Huelsenbeck. 2012b. MrBayes 3.2: Efficient Bayesian phylogenetic inference and model choice across a large model space. Systematic Biology 61:539–42.
- Sanderson (2002) Sanderson, M. J. 2002. Estimating absolute rates of molecular evolution and divergence times: A penalized likelihood approach. Molecular Biology and Evolution 19:101–109.
- Silvestro et al. (2014) Silvestro, D., J. Schnitzler, L. H. Liow, A. Antonelli, and N. Salamin. 2014. Bayesian estimation of speciation and extinction from incomplete fossil occurrence data. Systematic Biology 63:349–367.
- Slack et al. (2006) Slack, K. E., C. M. Jones, T. Ando, G. A. Harrison, R. E. Fordyce, U. Arnason, and D. Penny. 2006. Early penguin fossils, plus mitochondrial genomes, calibrate avian evolution. Molecular Biology and Evolution 23:1144–1155.
- Slater (2013) Slater, G. J. 2013. Phylogenetic evidence for a shift in the mode of mammalian body size evolution at the cretaceous-palaeogene boundary. Methods in Ecology and Evolution 4:734–744.
- Spencer and Wilberg (2013) Spencer, M. R. and E. W. Wilberg. 2013. Efficacy or convenience? model-based approaches to phylogeny estimation using morphological data. Cladistics 29:663–671.
- Stadler (2009) Stadler, T. 2009. On incomplete sampling under birth-death models and connections to the sampling-based coalescent. Journal of Theoretical Biology 261:58–66.
- Stadler (2010) Stadler, T. 2010. Sampling-through-time in birth-death trees. Journal of Theoretical Biology 267:396–404.
- Stadler et al. (2013) Stadler, T., D. Künert, S. Bonhoeffer, and A. J. Drummond. 2013. Birth-death skyline plot reveals temporal changes of epidemic spread in HIV and hepatitis C virus (HCV). Proceedings of the National Academy of Sciences, USA 110:228–33.
- Stucchi (2007) Stucchi, M. 2007. Los pingüinos de la formación pisco (neógeno), perú. Cuadernos del Museo Geominero 8:367–373.
- Stucchi (2008) Stucchi, M. 2008. Un condor del Mioceno tardío de la costa peruana. Bol Lima 153:141–146.
- Subramanian et al. (2013) Subramanian, S., G. Beans-Picón, S. K. Swaminathan, C. D. Millar, and D. M. Lambert. 2013. Evidence for a recent origin of penguins. Biology Letters 9:20130748.
- Thorne and Kishino (2005) Thorne, J. L. and H. Kishino. 2005. Estimation of divergence times from molecular sequence data. Pages 233–256 in Statistical Methods in Molecular Evolution. Springer.
- Thorne et al. (1998) Thorne, J. L., H. Kishino, and I. S. Painter. 1998. Estimating the rate of evolution of the rate of molecular evolution. Molecular Biology and Evolution 15:1647–1657.
- Walsh and Suárez (2006) Walsh, S. A. and M. E. Suárez. 2006. New penguin remains from the Pliocene of northern Chile. Historical Biology 18:119–130.
- Warnock et al. (2015) Warnock, R. C., J. F. Parham, W. G. Joyce, T. R. Lyson, and P. C. Donoghue. 2015. Calibration uncertainty in molecular dating analyses: There is no substitute for the prior evaluation of time priors. Proceedings of the Royal Society B: Biological Sciences 282:20141013.
- Warnock et al. (2012) Warnock, R. C., Z. Yang, and P. C. Donoghue. 2012. Exploring uncertainty in the calibration of the molecular clock. Biology Letters 8:156–159.
- Wood et al. (2013) Wood, H. M., N. J. Matzke, R. G. Gillespie, and C. E. Griswold. 2013. Treating fossils as terminal taxa in divergence time estimation reveals ancient vicariance patterns in the palpimanoid spiders. Systematic Biology 62:264–284.
- Wright and Hillis (2014) Wright, A. M. and D. M. Hillis. 2014. Bayesian analysis using a simple likelihood model outperforms parsimony for estimation of phylogeny from discrete morphological data. PloS One 9:e109210.
- Yang and Rannala (1997) Yang, Z. and B. Rannala. 1997. Bayesian phylogenetic inference using DNA sequences: A Markov chain Monte Carlo method. Molecular Biology and Evolution 14:717–24.
- Yang and Rannala (2006) Yang, Z. and B. Rannala. 2006. Bayesian estimation of species divergence times under a molecular clock using multiple fossil calibrations with soft bounds. Molecular Biology and Evolution 23:212–226.
- Yule (1924) Yule, G. U. 1924. A mathematical theory of evolution, based on the conclusions of Dr. J. C. Wills, F. R. S. Philosophical Transactions of the Royal Society of London, Biology 213:21–87.
- Zachos et al. (2001) Zachos, J., M. Pagani, L. Sloan, E. Thomas, and K. Billups. 2001. Trends, rhythms, and aberrations in global climate 65 Ma to present. Science 292:686–693.
- Zhang et al. (2016) Zhang, C., T. Stadler, S. Klopfstein, T. A. Heath, and F. Ronquist. 2016. Total-evidence dating under the fossilized birth–death process. Systematic Biology 65:228–249.
- Zhu et al. (2015) Zhu, T., M. dos Reis, and Z. Yang. 2015. Characterization of the uncertainty of divergence time estimation under relaxed molecular clock models using multiple loci. Systematic Biology 64:267–280.
- Zuckerkandl and Pauling (1962) Zuckerkandl, E. and L. Pauling. 1962. Molecular disease, evolution and genetic heterogeneity. Pages 189–225 in Horizons in Biochemistry. Academic Press.
- Zuckerkandl and Pauling (1965) Zuckerkandl, E. and L. Pauling. 1965. Evolutionary divergence and convergence in proteins. Evolving Genes and Proteins 97:97–166.