[table]labelsep=period,labelfont=bf,rm
\captionsetup[figure]labelfont=bf,labelsep=period
HFNLUSTC]
22footnotemark: 2 Hefei National Laboratory for Physical Sciences at the Microscale, University of Science and Technology of China, Hefei, Anhui 230026, China.
\alsoaffiliation[UPV/EHU]
33footnotemark: 3 Nano-Bio Spectroscopy Group and ETSF Scientific Development Center, Departamento de Física de Materiales, Centro de Física de Materiales CSIC-UPV/EHU-MPC and DIPC, Universidad del País Vasco UPV/EHU, E-20018 San Sebastián, Spain
UPV/EHU]
33footnotemark: 3 Nano-Bio Spectroscopy Group and ETSF Scientific Development Center, Departamento de Física de Materiales, Centro de Física de Materiales CSIC-UPV/EHU-MPC and DIPC, Universidad del País Vasco UPV/EHU, E-20018 San Sebastián, Spain
ICN2]
55footnotemark: 5 ICN2 - Institut Català de Nanociència i Nanotecnologia, ICN2 Building, Campus UAB, E-08193 Bellaterra (Barcelona), Spain
\alsoaffiliation[CSIC]
44footnotemark: 4 CSIC - Consejo Superior de Investigaciones Científicas, ICN2 Building, Campus UAB, E-08193 Bellaterra (Barcelona), Spain
HFNLUSTC]
22footnotemark: 2 Hefei National Laboratory for Physical Sciences at the Microscale, University of Science and Technology of China, Hefei, Anhui 230026, China.
\alsoaffiliation[PHYUSTC]
66footnotemark: 6 Department of Physics and ICQD, University of Science and Technology of China, Hefei, Anhui 230026, China
\alsoaffiliation[SICQI]
⟂Synergetic Innovation Center of Quantum Information & Quantum Physics, University of Science and Technology of China, Hefei, Anhui 230026, China
UP]
#Department of Physics and Astronomy, University of Pittsburgh, Pittsburgh, Pennsylvania 15260, USA
UPV/EHU]
33footnotemark: 3 Nano-Bio Spectroscopy Group and ETSF Scientific Development Center, Departamento de Física de Materiales, Centro de Física de Materiales CSIC-UPV/EHU-MPC and DIPC, Universidad del País Vasco UPV/EHU, E-20018 San Sebastián, Spain
\alsoaffiliation[MaxPlanck]
@Max Planck Institute for the Structure and Dynamics of Matter, Luruper Chaussee 149, D-22761 Hamburg, Germany
Comparing quasiparticle HO level alignment on anatase and rutile TiO
ABSTRACT:
Knowledge of the molecular frontier levels’ alignment in the ground state can be used to predict the photocatalytic activity of an interface. The position of the adsorbate’s highest occupied molecular orbital (HOMO) levels relative to the substrate’s valence band maximum (VBM) in the interface describes the favorability of photogenerated hole transfer from the VBM to the adsorbed molecule. This is a key quantity for assessing and comparing H2O photooxidation activities on two prototypical photocatalytic TiO2 surfaces: anatase (A)-TiO2(101) and rutile (R)-TiO2(110). Using the projected density of states (DOS) from state-of-the-art quasiparticle (QP) calculations, we assess the relative photocatalytic activity of intact and dissociated H2O on coordinately unsaturated (Ti) sites of idealized stoichiomet-
![[Uncaptioned image]](/html/1506.04695/assets/x1.png) ric A-TiO2(101)/R-TiO2(110) and bridging O vacancies (O) of defective A-TiO2-x(101)/R-TiO2-x(110) surfaces () for various coverages. Such a many-body treatment is necessary to correctly describe the anisotropic screening of electron-electron interactions at a photocatalytic interface, and hence obtain accurate interfacial level alignments. The more favorable ground state HOMO level alignment for A-TiO2(101) may explain why the anatase polymorph shows higher photocatalytic activities than the rutile polymorph. Our results indicate that (1) hole trapping is more favored on A-TiO2(101) than R-TiO2(110) and (2) HO@Ti is more photocatalytically active than intact H2O@Ti.
KEYWORDS: water splitting, calculations, photocatalysis, photooxidation, hole trapping, titania
ric A-TiO2(101)/R-TiO2(110) and bridging O vacancies (O) of defective A-TiO2-x(101)/R-TiO2-x(110) surfaces () for various coverages. Such a many-body treatment is necessary to correctly describe the anisotropic screening of electron-electron interactions at a photocatalytic interface, and hence obtain accurate interfacial level alignments. The more favorable ground state HOMO level alignment for A-TiO2(101) may explain why the anatase polymorph shows higher photocatalytic activities than the rutile polymorph. Our results indicate that (1) hole trapping is more favored on A-TiO2(101) than R-TiO2(110) and (2) HO@Ti is more photocatalytically active than intact H2O@Ti.
KEYWORDS: water splitting, calculations, photocatalysis, photooxidation, hole trapping, titania
1. INTRODUCTION
TiO2 is widely used in photocatalysis, photoelectrocatalysis, and photovoltaics1, 2, 3, 4, 5, 6. In particular, the H2O–TiO2 interface has been intensively studied both experimentally 7 and theoretically8. This is due to both the ubiquitous nature of the aqueous environment, and the technological importance of water splitting 9, 10. Because large single-crystal samples of the anatase polymorph are less stable than the rutile polymorph11, 12, 13, most surface science studies have focused on the rutile (110) surface of TiO2. However, in the nanoparticle form the anatase polymorph is more stable,14 and moreover it has a higher photocatalytic activity 15.
A proper assessment of an interface’s photocatalytic activity requires an accurate description of its frontier levels’ alignment. This is because interfacial electron transfer is controlled by the alignment of the highest occupied and lowest unoccupied molecular orbitals (HOMO/LUMO) relative to the valence band maximum (VBM) and conduction band minimum (CBM) 4, 5. In particular, H2O photooxidation, i.e., the oxygen evolution reaction (OER), is initiated by the transfer of the photogenerated hole from the substrate’s VBM to the HOMO16, 17, 18.
Based on the HOMO’s position relative to the VBM prior to irradiation, i.e., vertical alignment, one may establish trends in photocatalytic activity among a group of systems19, 20. Even in cases where the HOMO initially lies below the VBM21, after light absorption and nuclear relaxation, these levels may reorder, with the hole localized on the molecule22. Essentially, the closer to the VBM and more localized on the molecule the HOMO is initially, the greater the molecule’s propensity for trapping the hole. For these reasons, the alignment of the H2O occupied levels prior to irradiation is most relevant for understanding the OER.
Recently, we applied many-body quasiparticle (QP) techniques23, 24 to determine the H2O occupied levels’ alignment on rutile (R)-TiO2(110)21. We found that an accurate description of the interfacial anisotropic screening via QP is essential to accurately describe the interfacial level alignment25, 26, 27, 21. Specifically, the occupied QP density of states (DOS) projected onto the molecule is an effective means for interpreting difference spectra, i.e., the difference between spectra with a chemisorbed molecular overlayer and a clean TiO2 surface, from ultraviolet photoemission spectroscopy (UPS)21. Such theoretical approaches are necessary to disentangle highly hybridized adsorbate levels from those of the substrate, such as those of the H2O–TiO2 interface 21.
Here, we investigate the H2O occupied levels’ alignment on the anatase (A)-TiO2(101) surface, as it is the most common surface in nanostructured TiO2 2, 28, 29. In the absence of UPS measurements for H2O on A-TiO2(101), we compare the results to the PDOS of H2O on R-TiO2(110) 30, which is consistent with UPS difference spectra31, 32, 33.
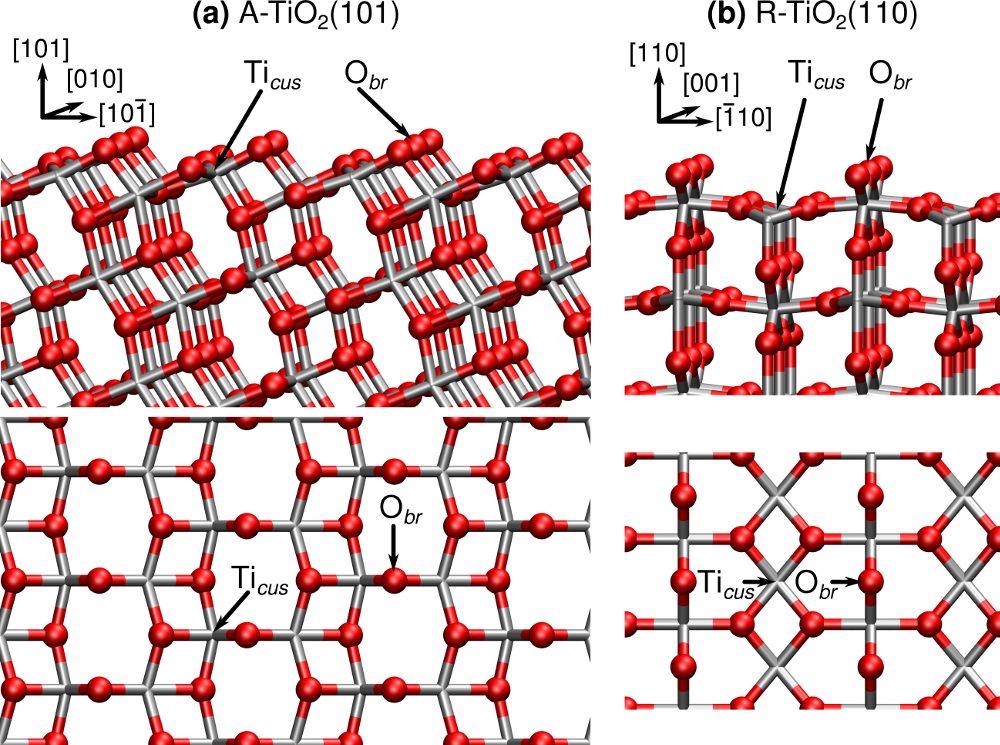
In particular, we perform 23, 24, 34 and partially self-consistent35 (sc)QP25, 26 calculations based on Kohn-Sham (KS) levels from density functional theory (DFT) using a local density approximation (LDA)36, generalized gradient approximation (PBE)37, or a range-separated hybrid (HSE)38, 39 exchange correlation (xc)-functionals. From these calculations we obtain the total and projected QP DOS for a variety of coverages [ to 1 monolayer (ML)] of intact and dissociated H2O adsorbed on coordinately unsaturated Ti sites (H2O@Ti) of stoichiometric A-TiO2(101) and bridging O vacancies (H2O@O) of defective A-TiO(101) and A-TiO(101) surfaces with ML and ML O. The Ti and O sites of A-TiO2(101) and R-TiO2(110) are shown schematically in Figure 1.
On the one hand, by considering the absolute interfacial level alignment, i.e., relative to the vacuum level , one obtains the interface’s ionization potential . This is the quantity that can be compared with red-ox potentials 40, 41. Moreover, the absolute level alignment allows a direct comparison between alignments across different substrates20, such as A-TiO2(101) and R-TiO2(110). Finally, from the absolute level alignment, one can determine whether changes in the H2O level alignment across different substrates are attributable to shifts of the substrate or molecular levels.
On the other hand, by considering the level alignment relative to the VBM of the substrate , one may directly compare the favorability of photogenerated hole transfer from the substrate’s VBM to the molecule’s HOMO. In combination with the IP this allows a robust comparison of photocatalytic activity across substrates. Moreover, by referencing the spectra to the VBM, one may directly compare the shape and dispersion of the valence band edge at the VBM. Finally, the VBM is the most reliable KS energy reference, from a theoretical perspective26.
For these reasons, we shall make use of both VBM and energy references as appropriate. In particular, we provide the absolute level alignment when comparing to HSE DFT and HSE DOS. This is because the VBM and CBM from HSE DFT for clean26 and 1ML H2O@Ti40, 41, 21 on R-TiO2(110) are consistent with measurements for clean quasi-stoichiometric 26, 42, 43, 44, 45 and liquid H2O covered R-TiO2(110)41, respectively.
We begin by providing a detailed description of the techniques, parameters, and terminology employed throughout in Section 2. In Section 3.1 we compare our results to calculated and measured electronic band gaps , optical band gaps , and macroscopic dielectric constants of bulk A-TiO2 and R-TiO2 available in the literature. To further test the robustness of our approach, and the parameters employed, we compare the dielectric function obtained by solving the Bethe-Salpeter equation (BSE) based on eigenvalues with that obtained from reflection spectra measurements for bulk A-TiO2. We also compare the IP for clean idealized stoichiometric A-TiO2(101) and R-TiO2(110). In Section 3.2 we provide a detailed comparison of the H2O PDOS for intact and dissociated H2O@Ti on A-TiO2(101) and R-TiO2(110) relative to and with PBE DFT, HSE DFT, PBE scQP, PBE and HSE . In Section 3.3 we provide a similar detailed comparison for dissociatively adsorbed H2O@O on A-TiO(101) and R-TiO(110) relative to . Finally, in Section 3.4 we extend the comparison of A-TiO2(101) and R-TiO2(110) to their adsorption energies and level alignments relative to with H2O coverage ( to 1ML), H2O dissociation (intact to fully dissociated), and surface composition (O coverage). This is followed by concluding remarks.
2. METHODOLOGY
2.1. Theoretical Methods
DFT based on standard xc-functionals, e.g., LDA and PBE, tends to significantly underestimate the electronic band gaps of semiconducting metal oxides, such as TiO246. This is in part due to their underestimation of the screening of the electron-electron interaction.
DFT based on hybrid xc-functionals, e.g., HSE, partially remedies this by replacing a fraction of the exchange term with Hartree-Fock exact-exchange. The fraction of Hartree-Fock exact-exchange included, , acts as an effective constant screening of the Hartree-Fock electron-electron interaction term, i.e., an inverse dielectric constant for the system .47 In particular, we use the HSE06 variant, with a range separation parameter of Å-1, of the HSE hybrid xc-functional, which includes 25% exact-exchange ()38. For systems where the screening is rather homogeneous, and , this leads to a better description of the electronic band gap47, e.g., of bulk TiO246.
However, since HSE applies the same screening to all the levels regardless of their nature, it fails to describe the anisotropic screening felt by molecular levels at an interface. As a result, localized occupied molecular levels are underbound by HSE25, 26, 21. This can lead to significant errors in HSE’s description of molecular/semiconductor interfacial level alignment25, 26, 21. Instead, QP techniques, e.g., and scQP, where the spacial dependence of the screening is explicitly included, provide a better description of the interfacial level alignment.25, 26, 27, 21
In the approach, the contribution to the KS eigenvalues from the xc-potential is replaced by the self energy , where is the Green’s function and is the spatially dependent screening 23 obtained from the KS wavefunctions 24. The dielectric function is obtained from linear response time-dependent (TD) DFT within the random phase approximation (RPA), including local field effects 34. From one obtains first-order QP corrections to the KS eigenvalues, but retains the KS wavefunctions. Generally, these QP corrections to the occupied levels are linearly dependent on the fraction of the KS wavefunction’s density in the molecular layer 25, 26. This means the screening of these levels is quite anisotropic. For this reason, QP methods are necessary to accurately describe the interfacial level alignment.
Moreover, to include dependencies on the QP wavefunctions, and possibly obtain an improved absolute level alignment for the interface, one can also employ self-consistent QP techniques, such as scQP25, 26, 21. Here, we have employed a single-shot scQP1 approach35, 25, where 100% of the DFT xc-potential is replaced by the QP self energy in a single self-consistent scQP cycle. We employ this procedure to make practical scQP calculations for large interfaces, such as H2O–A-TiO2(101). In so doing, one obtains eigenvalues comparable to those from , along with the QP wavefunctions. This differs from the scQP approach as previously applied to the H2O–R-TiO2(110) interface21, where 25%, 25%, and 50%, of the QP self energies were “mixed” with the DFT xc-potential over three scQP cycles 35, respectively.
2.2. Computational Details
Our calculations23, 24, 34 have been performed using vasp within the projector augmented wave (PAW) scheme 48. The calculations are based on KS wavefunctions and eigenenergies obtained from DFT using either LDA36, PBE37, or HSE 38 xc-functionals 49.
The geometries have been fully relaxed using LDA36 or PBE 37, with all forces 0.02 eV/Å. The HSE38 calculations have been performed for the relaxed geometries obtained with PBE. We have employed a plane-wave energy cutoff of 445 eV, an electronic temperature of eV with all energies extrapolated to K, and a PAW pseudopotential for Ti which includes the 3 and 3 semi-core levels. All calculations have been performed spin unpolarized21.
For the clean stoichiometric A-TiO2(101) surface we have used a five-layer slab, an orthorhombic unit cell of Å3, a -centered k-point mesh, and approximately 9 unoccupied bands per atom. For the clean defective A-TiO(101) surface we have used a monoclinic unit cell of Å3 and a -centered k-point mesh. For the clean defective A-TiO(101) surface we have used a unit cell of Å3 and a -centered k-point mesh. For the H2O covered surfaces, we have employed a five-layer slab with adsorbates on both sides, an orthorhombic unit cell of Å3, a centered k-point mesh, and approximately 9 unoccupied bands per atom, i.e., including all levels up to 30 eV above the VBM, an energy cutoff of 80 eV for the number of G-vectors, and a sampling of 80 frequency points for the RPA dielectric function. The parameters are consistent with those previously used for describing bulk R-TiO2, R-TiO2(110) clean surface and interfaces25, 26. Although our calculations do not include electron-phonon50 and lattice polarization51 contributions, these parameters have been shown to provide accurate descriptions of bulk optical absorption spectra, and both clean surface and interfacial level alignment25, 26.
It has previously been shown52, 53, 46 that the experimental optical spectra for bulk A-TiO may be obtained via BSE 54 based on eigenvalues. In our BSE calculations, we include the electrostatic electron-hole interaction using the effective nonlocal frequency independent exchange correlation kernel suggested in ref. 55. For bulk A-TiO2, we have used a tetragonal conventional 12 atom supercell with experimental lattice parameters Å and Å56, and a dense -centered k-point mesh. For bulk R-TiO2, we have used a tetragonal 6 atom primitive cell with experimental lattice parameters Å and Å56, a -centered k-point mesh with PBE and HSE and a denser -centered k-point mesh with LDA. For both A-TiO2 and R-TiO2, we have included unoccupied bands per atom. For the BSE calculations of bulk A-TiO2, we have used 480 sampling points for the RPA dielectric function, and included all the transitions between the 16 highest energy occupied bands and the 12 lowest energy unoccupied bands.54
2.3. Terminology
To compare the relative stabilities of the H2O covered anatase and rutile polymorphs, we have performed single-point RPBE57 based DFT calculations using the PBE relaxed structure for the H2O adsorption energies on stoichiometric A-TiO2(101) and defective A-TiO2-x(101) surfaces. The RPBE xc-functional was especially developed for the prediction of adsorption properties on metal surfaces 57. Furthermore, RPBE has been shown to provide accurate formation energies for metal dioxides58 and perovskites 59.
The H2O adsorption energy on the Ti site of a stoichiometric A-TiO2(101) surface is given by
| (1) |
where is the number of adsorbed H2O functional units in the supercell, and , , and are the total energies of the covered and clean stoichiometric surfaces and gas phase water molecule, respectively. Similarly, the H2O adsorption energy on the O site of a defective A-TiO2-x(101) surface is given by
| (2) |
where and are the total energies of the covered and clean defective surfaces, respectively.
To provide a quantitative comparison between the DOS for the H2O–A-TiO2 and H2O–R-TiO2 interfaces, we employ the interfaces’ IPs. These are obtained from the difference in energy between the vacuum level and the VBM , , where is the maximum surface averaged electrostatic potential in the vacuum region between slabs.
Similarly, to provide a quantitative comparison between the PDOS for the H2O–A-TiO2 and H2O–R-TiO2 interfaces, we employ both the highest H2O PDOS peak and the average energy of the highest energy electron, or HOMO, of the PDOS, . To obtain from the PDOS, we fit three Gaussians to the first few peaks below the VBM. In this way we may disentangle the highest energy peak when it forms a shoulder within the upper edge of the PDOS.
However, to assess trends in the comparative photocatalytic activity of the H2O–A-TiO2 and H2O–R-TiO2 interfaces, one should consider not only a peak’s energy, but also differences in its’ intensity, i.e., localization on H2O. Both quantities are incorporated within the single descriptor . We define as the first moment of the PDOS, over the interval encompassing the highest energy electron. More precisely,
| (3) |
where is the VBM energy, eV ensures the tail of the VBM is included within the integral, and is the lower bound of the energy range encompassing the highest energy electron of the PDOS, i.e.,
| (4) |
3. RESULTS AND DISCUSSION
3.1. Bulk and (101) Surface of Anatase TiO
To test the reliability of the parameters we have employed to calculate the levels of A-TiO2, we first consider the optical response of bulk anatase. Previous DFT band structure calculations52, 53, 46 found A-TiO2 has an indirect electronic band gap between the VBM along the path at 46, i.e., , and the CBM at . Our PBE calculation yields an indirect electronic band gap for A-TiO2 of 3.86 eV, from a VBM at . This is comparable with the indirect band gaps reported in the literature, as shown in Table 1.
method xc-functional A-TiO2 R-TiO2 electronic band gap DFT HSE 3.72 3.63 3.40 3.40 3.60a 3.39a 3.39a LDA 3.93 3.86 3.33 3.26 4.14b 3.56b 3.38b 3.34b PBE 3.73a 3.46a 4.29c 3.83c 3.59c PBE+ 3.57d 3.30d 3.23d PES/IPES 3.53f 3.37f optical gap BSE LDA 3.73 3.15 PBE 3.57a 3.28a Transmission 3.42g Absorption 3.03h Reflectance 3.21i 3.00i aRef. 46. bRef. 53. cRef. 52. dRef. 60. ePhotoemission and Bremsstrahlung isochromat spectroscopy from ref. 61. fEstimate assuming a nearly direct band gap based on Kubelka–Munk adsorption coefficients from reflectance measurements of phase-pure nanoparticles in ref. 62. gRef. 63. hRefs. 64 and 65. iFor pure-phase nanoparticles from ref. 62.
Based on these levels, we obtain from the Bethe-Saltpeter equation the imaginary and real parts of the dielectric function of bulk A-TiO2 for polarization perpendicular (ordinary) and parallel (extraordinary) to the tetragonal axis shown in Figure 2. These are comparable to the dielectric functions obtained from reflection spectra polarized perpendicular to the or -axis at room temperature by Kramers-Kronig transformations66. Note that 86% of the experimental reflectivity spectra polarized perpendicular to the -axis is parallel to the -axis66. Furthermore, our dielectric functions agree well with those obtained from BSE calculations within the Tamm-Dancoff approximation 46. In particular, we obtain excellent agreement both in position and intensity for the first bright exciton at eV, which is perpendicular to the -axis. The lowest energy BSE transition is at eV, about eV below the PBE indirect electronic gap of A-TiO2, as shown in Table 1. This is significantly higher than the estimated optical band gap of eV reported in ref. 63.
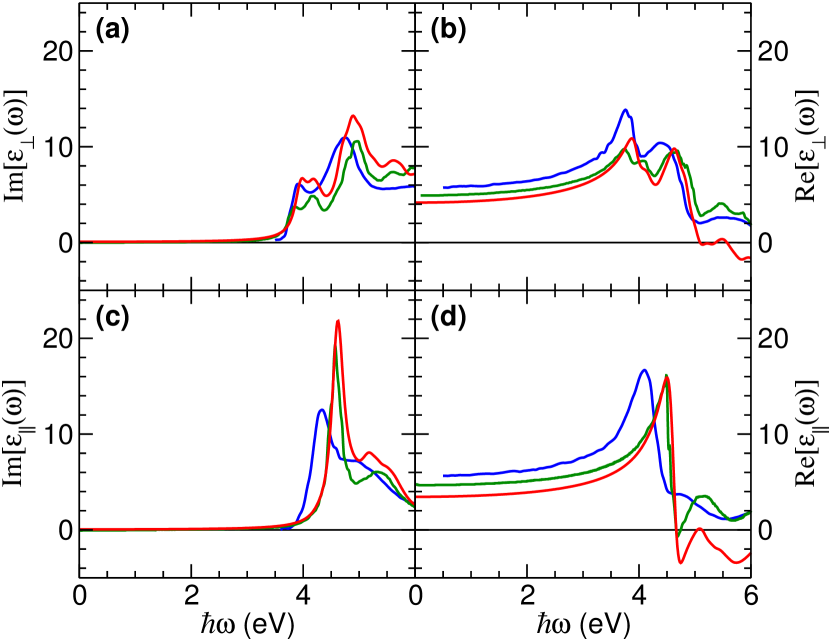
However, we tend to underestimate the real part of the dielectric function, shown in Figure 2(b,d). For example, as reported in Table 2, the dielectric constant is underestimated by about 2 in our BSE calculations. This might be remedied by including a greater number of transitions within the BSE calculation.
| method | xc-functional | A-TiO2 | R-TiO2 | ||
|---|---|---|---|---|---|
| RPA | LDA | 7.18 | 6.81 | 7.83a | 9.38a |
| 7.69b | 8.91b | ||||
| PBE | 7.06 | 6.60 | 7.61 | 9.09 | |
| 7.55b | 9.02b | ||||
| HSE | 4.91 | 4.83 | 5.21 | 6.09 | |
| 5.74b | 6.77b | ||||
| BSE- | LDA | 4.17 | 3.45 | 5.60a | 7.11a |
| PBE | 4.91c | 4.76c | 5.15c | 6.22c | |
| BSE-DFT | PBE+ | 5.12d | 4.98d | 5.71d | 7.33d |
| 5.79e | 7.04e | ||||
| Experiment | 5.73f | 5.64f | 5.88g | 7.14g | |
| 6.84h | 8.43h | ||||
| aRef. 26. bRef. 67. cRef. 46. dRef. 60. eRef. 68. fRef. 66. gRef. 69. hRef. 70. | |||||
In any case, such computationally demanding calculations are beyond the scope of the present work. Overall, the agreement obtained for the BSE dielectric function based on eigenenergies demonstrates the robustness of the parameters we will use to calculate the PDOS for H2O.
Figure 1 depicts schematically the clean and stoichiometric A-TiO2(101) surface. For the clean surface, there are two Ti coordinately unsaturated sites (Ti) and two bridging O atoms (O) in each unit cell.
PBE places the IP for A-TiO2(101) at 7.15 eV, which is 0.14 eV below that of R-TiO2(110)26. This relative ordering is consistent with, albeit significantly smaller than, that measured with XPS for the A-TiO2–RuO2–R-TiO2 interface of eV72. This ordering also agrees with the 0.47 eV difference in IP calculated using a hybrid quantum-mechanical/molecular mechanical embedding technique73. In these calculations the IP was obtained from the total energy difference upon removal of an electron from the neutral A-TiO2 and R-TiO2 embedded cluster models. Our relative ordering is also consistent with that obtained from KS eigenvalues using the B3LYP xc-functional of 8.2474 and 8.6 eV75 for A-TiO2(101) and R-TiO2(110), respectively. This qualitative agreement provides further support for the reliability of our approach.
3.2. HO Intact and Dissociated on Coordinately Unsaturated Ti Sites
For coverages up to 1ML, H2O adsorbs molecularly on the A-TiO2(101) surface, with O bonding to Ti and one H forming an interfacial hydrogen bond with O76, 8, 77, 11, 78, as shown in Figure 3(a). On R-TiO2(110), the distance between the nearest neighboring Ti sites is shorter, allowing additional intermolecular hydrogen bonds to form along the [001] direction 79, 80, 81, 82, as show in Figure 3(a).
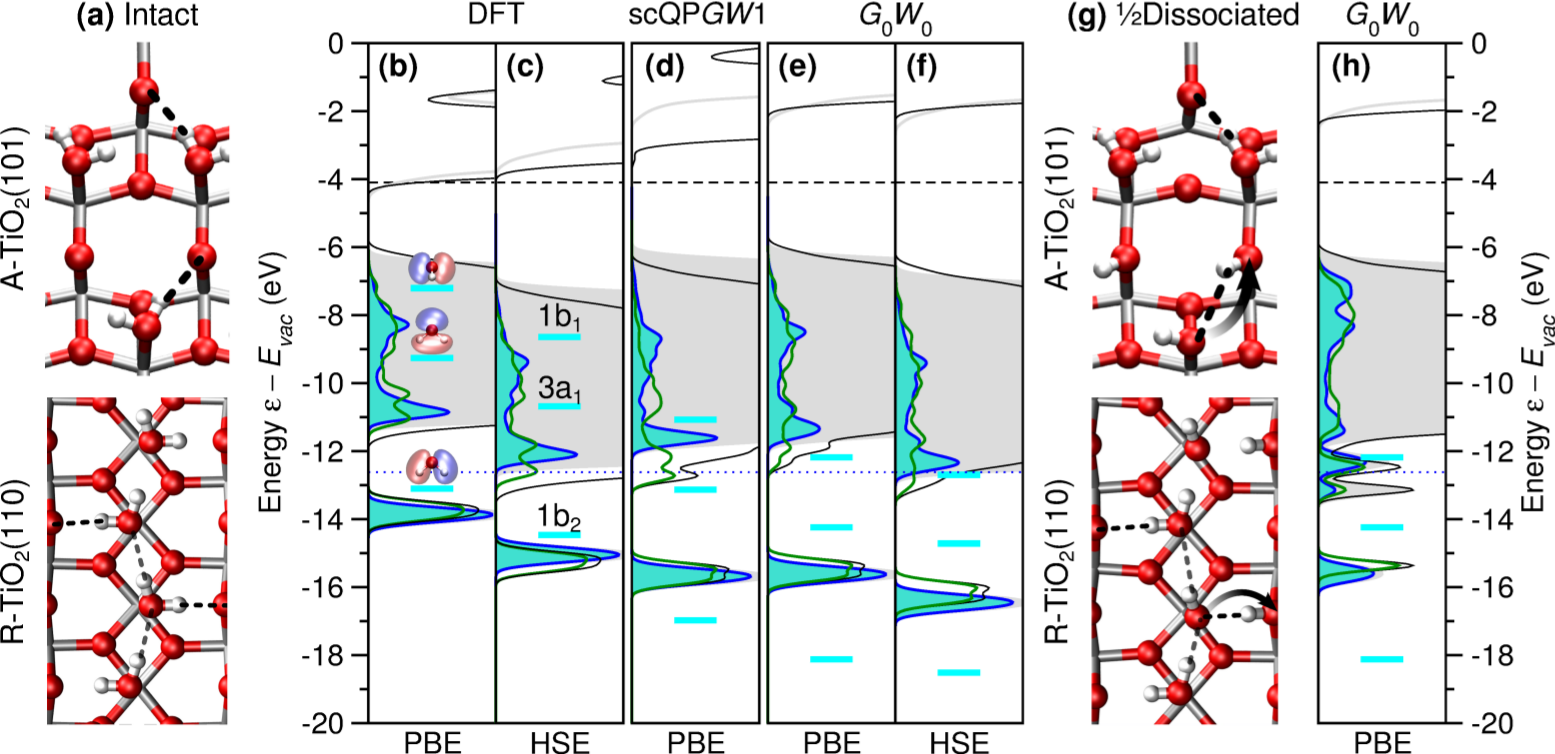
The QP level alignment relative to the vacuum level for 1ML of H2O adsorbed intact on A-TiO2(101) and R-TiO2(110)21 are shown in Figure 3(b-f). These are compared to the 1b2, 3a1, and 1b1 levels’ absolute alignment for gas phase H2O21. Specifically, we analyze the dependence of the H2O PDOS on the methodology: PBE DFT, HSE DFT, PBE scQP, PBE , and HSE .
As was previously found for the H2O–R-TiO2(110) interface, the IP for H2O–A-TiO2(101) is ordered according to the method’s description of the screening, 21. As shown in Table 3, the IP is ordered as PBE (6.3 eV) PBE scQP (6.3 eV) PBE DFT (6.4 eV) HSE (6.9 eV) HSE DFT (7.2 eV).
| method | xc-functional | H2O@Ti | |
| A-TiO2(101) | R-TiO2(110) | ||
| DFT | PBE | 6.4 | 6.2a |
| HSE | 7.2 | 7.3a | |
| scQP | PBE | 6.3 | 6.6a |
| PBE | 6.3 | 6.0a | |
| HSE | 6.9 | 6.5a | |
| aRef. 21 | |||
Note that the CBM and VBM relative to from PBE scQP and PBE are essentially the same for H2O–A-TiO2(101), but are significantly lower for H2O–R-TiO2(110). This is because the dielectric constant employed in both single-shot PBE scQP and PBE are those obtained from PBE DFT, whereas when the QP self energies are “mixed” with the DFT xc-potential in each cycle, as for H2O–R-TiO2(110), the scQP dielectric constant is significantly reduced relative to PBE DFT. This demonstrates that without mixing of the self energy, for the QP PDOS the PBE scQP procedure provides no advantage over PBE , as predicted in ref. 21.
Generally, the highest H2O PDOS peaks, , follow the same ordering as the IPs. This suggests that is pinned to the VBM of the H2O–A-TiO2(101) interface. This is also the case for 1ML intact H2O@Ti on R-TiO2(110)21. However, this ordering of the IPs is completely different from that found for gas phase H2O21. In this case, the IP is the energy needed to remove one electron from the H2O 1b1 level. Here, the IPs increase with decreasing screening within the methodology until 21.
However, for 1ML intact H2O@Ti, the relative alignment of the A-TiO2(101) and R-TiO2(110) VBMs differs qualitatively with methodology. The IPs obtained from PBE DFT and PBE are higher ( and eV) for A-TiO2(101) than for R-TiO2(110). However, the from HSE DFT is lower ( eV) for A-TiO2(101) than R-TiO2(110), while the opposite is true for HSE ( eV). Thus, independently of the xc-functional employed, yields higher IPs for 1ML intact H2O@Ti on A-TiO2(101) than on R-TiO2(110). This is contrary to our findings for the clean A-TiO2(101) and R-TiO2(110) surface, and suggests that H2O adsorption inverts the relative positions of the A-TiO2(101) and R-TiO2(110) VBMs.
Although we find the position of the lower edge of the valence band is only weakly affected by adsorbing H2O on either A-TiO2(101) or R-TiO2(110), the VBM is shifted up by about 1 eV in both cases. This is consistent with the experimentally observed change in work function for the liquid water–R-TiO2(110) interface26, 42, 43, 44, 45, 41, 21, 83.
The reordering of the HSE DFT and IPs for 1ML intact H2O on A-TiO2(101) and R-TiO2(110) may be attributed to the greater difference between the constant screening built into HSE DFT 47 and the screening of rutile compared to anatase. Essentially, the fraction of the Hartree-Fock exact-exchange which is incorporated within HSE, , acts as an effective inverse dielectric constant within the system, 47. As a result, for materials with , HSE DFT and should provide similar descriptions of the screening 47. From Table 2, we see that the RPA, BSE, and measured agree qualitatively and are consistently lower and closer to the HSE DFT effective dielectric constant of for A-TiO2 compared to R-TiO2. For this reason, as shown in Figure 3, the difference between HSE DFT and IPs is larger for R-TiO2 than A-TiO2, resulting in their relative reordering at the level. This demonstrates the important role played by the screening in describing the relative alignment of anatase and rutile polymorphs.
Overall the H2O QP PDOS for 1ML intact H2O@Ti is similar for the A-TiO2(101) and R-TiO2(110) surfaces. In particular, the most strongly bound 1b2 peaks and the upper edges of the H2O PDOS spectra have similar energies for the two polymorphs over all five levels of theory (cf. Figure 3(b-f)).
On A-TiO2(101), the 1ML intact H2O QP PDOS generally consists of three distinct peaks, which have clear contributions from molecular 1b2, 3a1 and 1b1 levels (cf. Figure 3(b) and Figure 4(a)). This is in contrast to R-TiO2(110), where the H2O QP PDOS consists of many more peaks, with a greater hybridization at 1ML compared to ML coverage on the R-TiO2(110) substrate.21 This may be attributed to stronger intermolecular interactions on R-TiO2(110) due to its shorter Ti nearest neighbor separations ( Å) versus A-TiO2(101) ( Å). This leads to intermolecular bonding and antibonding levels, which may further hybridize with the substrate.21 For example, as shown in Figure 3, the bottom edge of the 3a1 peak for A-TiO2(101) is higher than that of R-TiO2(110). This is because on R-TiO2(110) the 3a1 levels of neighbouring molecules hybridize to form intermolecular bonding and antibonding combinations21. These give rise to separate peaks below and above the bottom edge of the R-TiO2(110) valence band. As a result, the QP H2O PDOS for 1ML intact H2O@Ti on R-TiO2(110) has the 3a1 intermolecular bonding level below the bottom of the valence band, while for A-TiO2(101), the 3a1 level is completely within the substrate’s valence band.
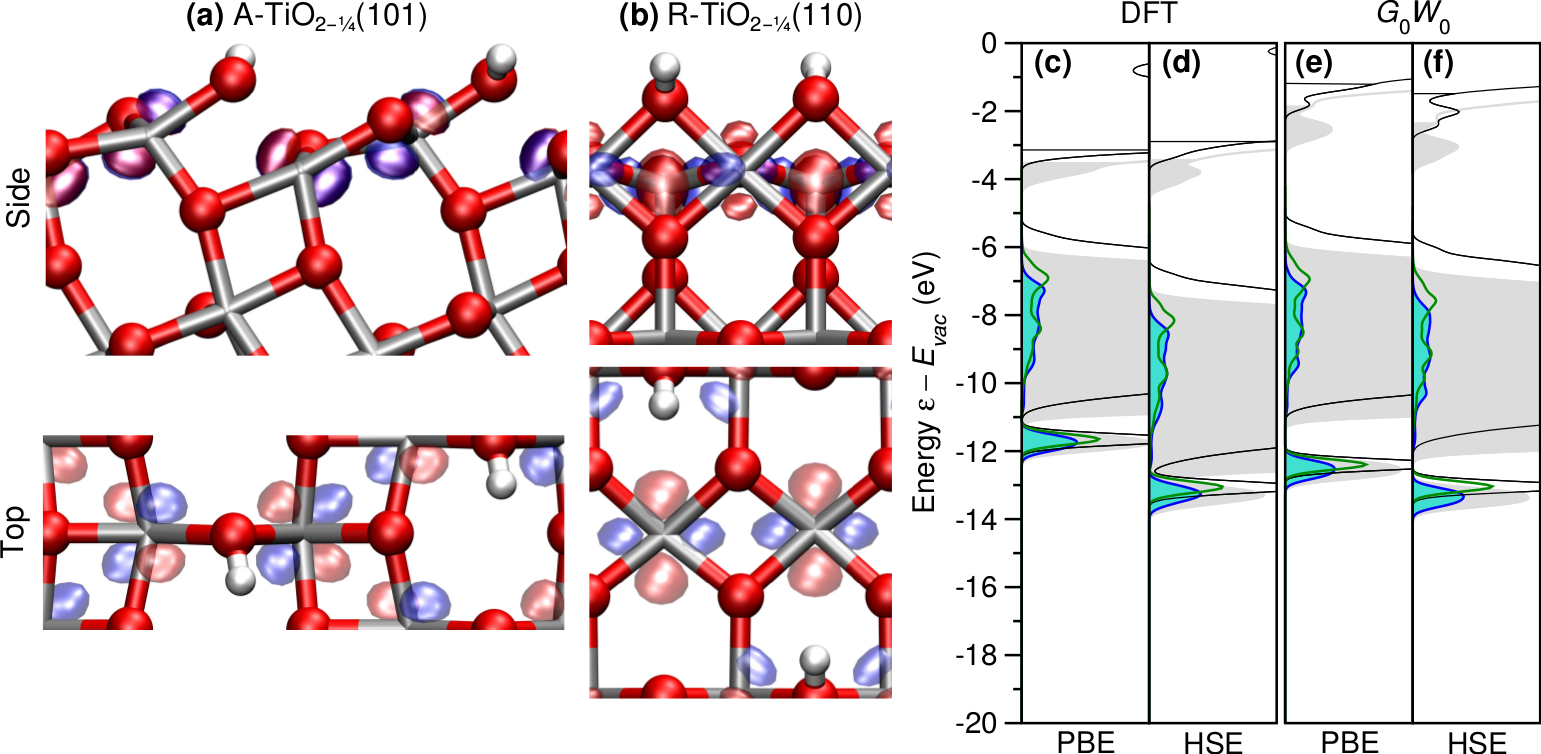
Figure 3(g) shows the structures of dissociated H2O@Ti on A-TiO2(101) and R-TiO2(110). In both cases, one proton from H2O@Ti is transferred to the adjacent O. This results in two distinct OH groups: HO@Ti and OH. This process is accompanied by a charge transfer from HO@Ti to OH, as depicted schematically in Figure 3(g).
Although the resulting PBE QP DOS shown in Figure 3(e) and (h) are generally similar, there are important differences which are related to the H2O@Ti dissociation. For the dissociated H2O molecule, the 1b2 peak is replaced by separate HO@Ti and OH peaks at about and eV below (see Figure 3(h)), with O–H character on both A-TiO2(101) and R-TiO2(110)21 (see Figure 4(b)). These peaks are at such similar energies on both A-TiO2(101) and R-TiO2(110) because they are well separated from the bottom edge of the TiO2 valence band.
As mentioned above, the three distinct peaks in the H2O PDOS on both A-TiO2(101) and R-TiO2(110) are associated with the 1b2, 3a1, and 1b1 gas phase H2O levels. This is clearly seen by comparing the molecular components of the orbitals depicted for 1ML intact and dissociated H2O@Ti on both A-TiO2(101) and R-TiO2(110) in Figure 4 with the gas phase H2O levels depicted in Figure 3. There is significantly greater hybridization between the molecular levels on R-TiO2(110) compared to A-TiO2(101). Specifically, on R-TiO2(110) there are obvious bonding and antibonding combinations of the 1b2 levels and 3a1 levels between neighbouring H2O molecules.21 Such intermolecular hybridization does not occur for A-TiO2(101), as the molecules are too far apart.
More importantly, is shifted to higher energy upon dissociation, with a greater shift for A-TiO2(101) versus R-TiO2(110). To explain these differences, and their potential impact on the interfaces’ photocatalytic activity, one should compare the level alignment relative to the VBM. In so doing, one can directly compare the relative propensity for photogenerated hole transfer from the substrate’s VBM to the molecular HOMO for A-TiO2(101) and R-TiO2(110).
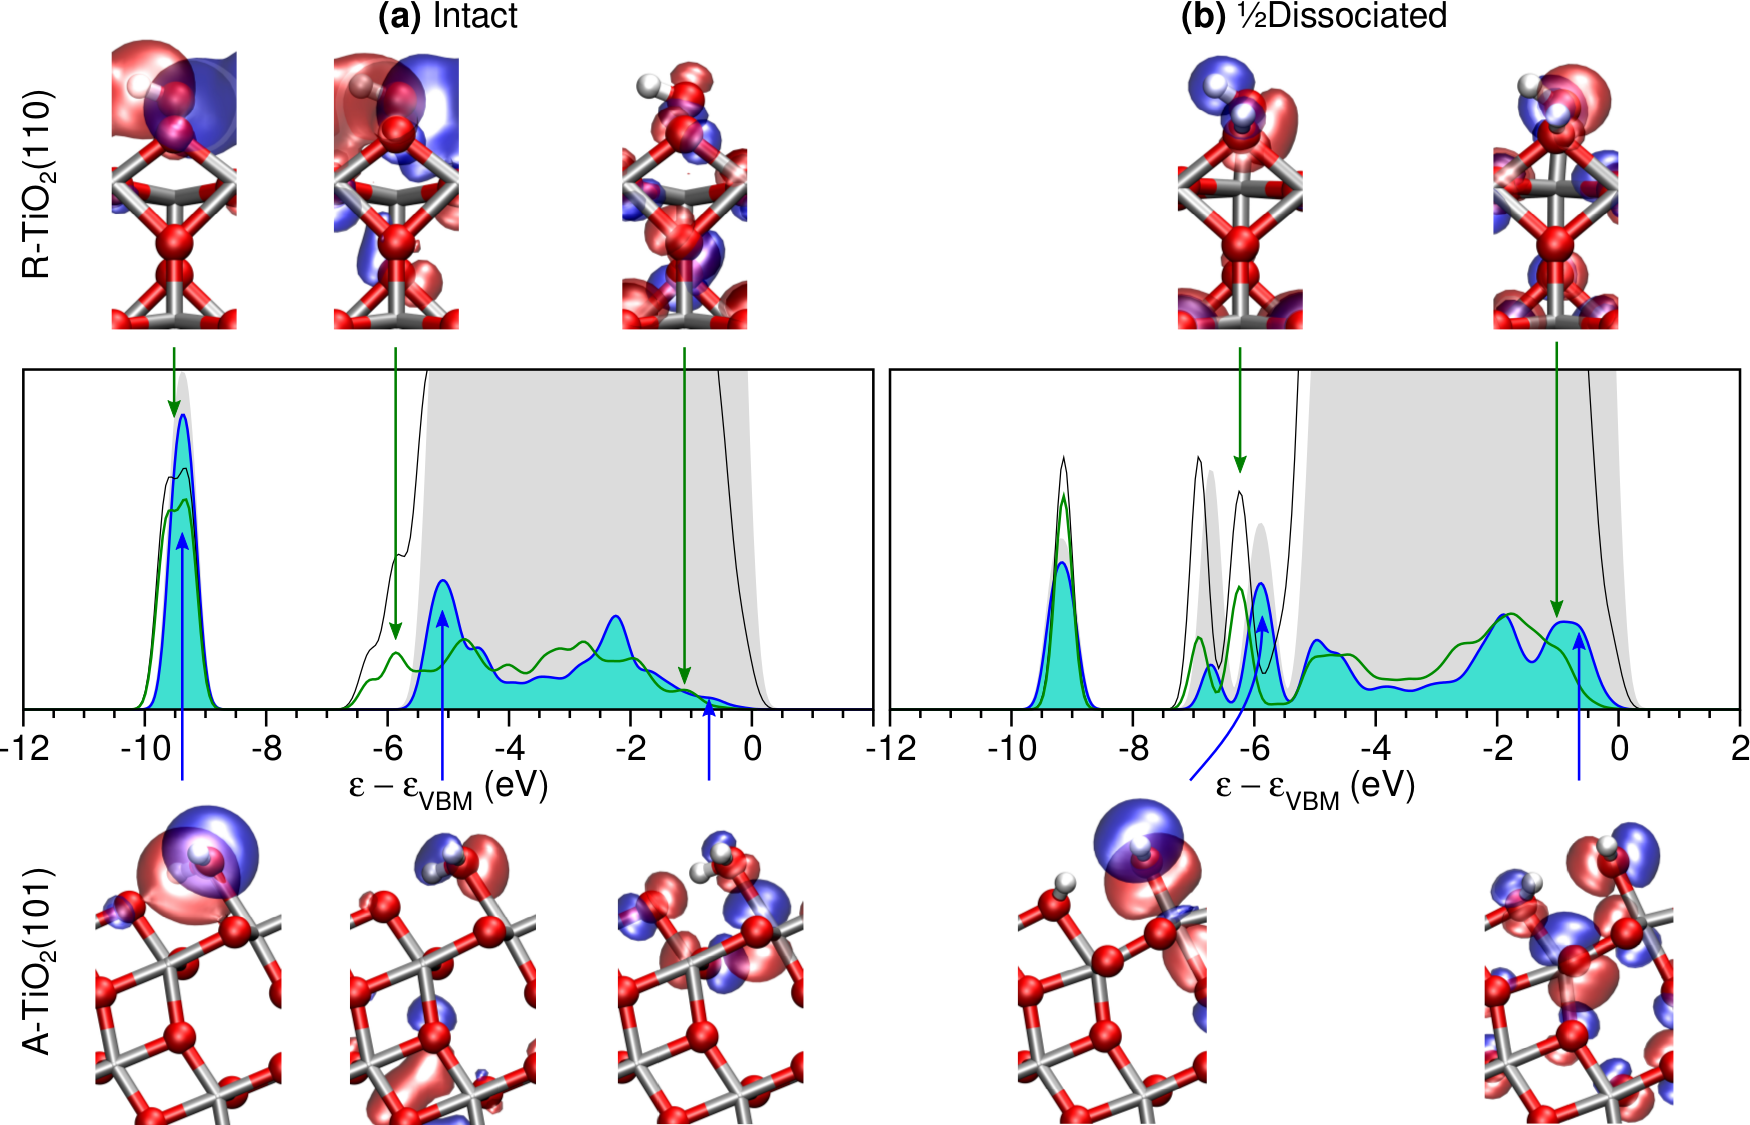
In Figure 4 we provide the level alignment relative to the VBM for (a) intact and (b) dissociated H2O on A-TiO2(101) and R-TiO2(110). The level alignment shown in Figure 4 suggests that (1) hole trapping is more favored on A-TiO2(101) than R-TiO2(110) and (2) HO@Ti is more photocatalytically active than intact H2O@Ti. This is based on the following observations: (1) is about 0.5 eV higher in energy for A-TiO2(101) than R-TiO2(110); (2) is about 0.1 eV closer to the VBM for HO@Ti than for intact H2O@Ti; (3) the PDOS for HO@Ti at is an order of magnitude greater than for intact H2O@Ti; and (4) the HOMO is more localized on the molecule for HO@Ti than for intact H2O@Ti.
These conclusions are reinforced by analyzing the HOMOs at shown in Figure 4. Here, one clearly sees that the HOMOs have greater weight on the molecule for HO@Ti than intact H2O@Ti. This should promote hole trapping on HO@Ti. Although there is only a small (0.1 eV) energy difference between the HOMO for dissociated and intact H2O@Ti, the latter level is not photocatalytically relevant for hole trapping on the molecule. This is because it is a lone-pair orbital that datively bonds to Ti. For this reason, if an electron were extracted from this level, one would instead expect the hole to remain on the surface, and H2O to desorb from Ti. This agrees with previous studies of the liquid H2O–A-TiO2(101) interface, which found that localizing the hole on intact H2O is inherently unstable, and leads to deprotonation17. Instead, the hole localizes on 3-fold coordinated surface O (O) atoms17.
In contrast to the intact H2O@Ti HOMOs, the HOMOs for HO@Ti on A-TiO2(101) and R-TiO2(110) are the photocatalytically active levels for hole-trapping. Indeed, they have the same character as the hole trapping levels reported in the literature for A-TiO2(101)17 and R-TiO2(110)22. In particular, they have both O 2pπ 84 and OH 2p character. While in the case of HO@Ti, this orbital is doubly occupied, in the trapped hole structures of refs. 17 and 22, the OH groups are bent towards the surface, with the hole shared between O 2pπ and OH 2p orbitals.
This clearly demonstrates that a HOMO initially below the VBM can, upon light absorption and subsequent nuclear relaxation, evolve into a hole trapping level of the interface. This justifies our use of ground state level alignment for comparing photocatalytic activity among H2O–TiO2 interfaces.
3.3. HO Dissociated on Bridging O Vacancies
For R-TiO2(110), the most stable O vacancies are at surface O sites, i.e., O. These sites mediate H2O dissociation on R-TiO2(110) 31, 88. For A-TiO2(101), the most stable O vacancies are subsurface 6, 89. However, after H2O adsorption, these subsurface vacancies migrate to the surface and are filled by H2O, i.e., H2O@O, which subsequently dissociates to form 2HO90, 89. This results in a structure equivalent to H on a stoichiometric A-TiO2(101) surface 90, 89, 91. For this reason, we consider a ML coverage of H2O adsorbed dissociatively on O sites (H2O@O) of a defective A-TiO(101) or R-TiO(110) 21 surface consisting of ML of O, shown schematically in Figure 5. This is equivalent to 1ML of H adsorbed on O (H@O) of a stoichiometric A-TiO2(101) or R-TiO2(110) surface.
These hydroxylated structures have occupied Ti levels which are associated with reduced Ti3+ atoms. The excess electrons introduce -type doping. These occupied Ti3+ 3 levels give rise to the charge density just below the Fermi level, , in the DOS shown in Figure 5(c-f)83.
The difference in spatial and energetic localization of the Ti3+ levels between O defective A-TiO2(101) and R-TiO2(110) has been recently probed via STM 92. For O@A-TiO2(101) at 6 K, the excess electrons are strictly localized next to O92, while for O@R-TiO2(110) at 78 K, the excess electrons are not confined next to O92, 93. Instead, the excess electrons in O@R-TiO2(110) may occupy levels of surface Ti or subsurface Ti atoms.
We find for ML H2O@O on both A-TiO(101) and R-TiO(110), the highest energy occupied Ti3+ levels84 are mostly on surface Ti atoms, as shown in Figure 5(a,b). These predominantly Ti levels84 are bonding along the [010] and [001] directions for A-TiO(101) and R-TiO(110), respectively. Furthermore, for H2O@O on A-TiO(101), the level occupies HO’s nearest neighbor Ti atoms. For H2O@O on R-TiO(110), this level also has weight on the next next nearest neighbour Ti atoms. Additionally, there are higher energy occupied Ti levels on subsurface Ti atoms.
In PBE DFT, the occupied Ti levels form a shoulder at the bottom edge of the conduction band for H2O@O on A-TiO(101), whereas on R-TiO(110) they do not even form a shoulder, as shown in Figure 5(c). The degree of energetic localization of the Ti3+ levels, and their energy below , increases with the level of theory from PBE DFT HSE DFT ( eV) PBE ( eV) HSE ( eV) for H2O@O on A-TiO(101)/R-TiO(110), and is generally higher (0.1 eV) for A-TiO(101) than R-TiO(110), as shown in Table 4. This is consistent with the eV measured for O defective A-TiO2(101) and R-TiO2(110) and HO@R-TiO2(110) by scanning tunneling spectroscopy (STS)94, 92, 93, photoemission electron spectroscopy (PES), 95, 32 and two photon photoemission spectroscopy (2PP).83, 96 However, a full treatment of Ti defect levels, e.g., due to interstitial Ti atoms, also requires the inclusion of electron-phonon interactions 93, 97.
method xc-functional H2O@O A-TiO(101) R-TiO(110) DFT PBE 0.2 0.1a HSE 0.6 0.4a PBE 0.7 0.6a HSE 1.0 0.9a STS PES 0.8e 2PP 0.9g aRef. 21. bRef. 92. cRef. 93. dRef. 95. eRef. 32. gRefs. 83 and 96.
Overall, relative to , the levels of A-TiO(101) are consistently about 0.6 eV lower in energy than those of R-TiO(110), for PBE DFT, HSE DFT, PBE , and HSE , as shown in Figure 5(c-f). However, the H2O@O 1b2 levels are at similar energies (within 0.2 eV) on A-TiO(101) and R-TiO(110), for PBE DFT, HSE DFT, PBE , and HSE , as shown in Figure 5(c-f).
Focusing on the IP from PBE shown in Table 5, they are ordered: R-TiO2(110) (7.29 eV) A-TiO2(101) (7.15 eV) H2O@Ti on A-TiO2(101) (6.25 eV) H2O@O on A-TiO(101) (6.19 eV) H2O@Ti on R-TiO2(110) (6.03 eV) H2O@O on A-TiO(101) (5.37 eV). On the one hand, there are no significant differences in IP between bare and H2O@Ti covered A-TiO2(101) and R-TiO2(110). On the other hand, for H2O dissociatively adsorbed on O sites of defective A-TiO(101) and R-TiO(110), the IPs are significantly different, despite having quite similar HO concentrations per unit area. The origin of this difference might be related to differences in the structure’s relative stability or surface dipole.82
coverage surface IP (eV) clean A-TiO2(101) 7.15 R-TiO2(110) 7.29a 1ML H2O@Ti A-TiO2(101) 6.25 R-TiO2(110) 6.03b 1ML H2O@O A-TiO(101) 6.19 R-TiO(110) 5.37b aRef. 26. bRef. 21.
Similarly, for dissociatively adsorbed H2O@O on A-TiO(101) is about 0.4 eV below that on R-TiO(110). Since is thus closer to the standard hydrogen electrode (SHE) for H2O@O on R-TiO(110) than A-TiO(101), one would expect the former structure to require a smaller overpotential and be more active than the latter within an electrochemical cell 98. However, for photocatalysis, the alignment of relative to is the more relevant quantity. As we shall see in the next section, the relative electrochemical and photocatalytic activities of these two structures are reversed.
3.4. Coverage and Dissociation Dependence of HO Spectra for Stoichiometric and Defective Surfaces
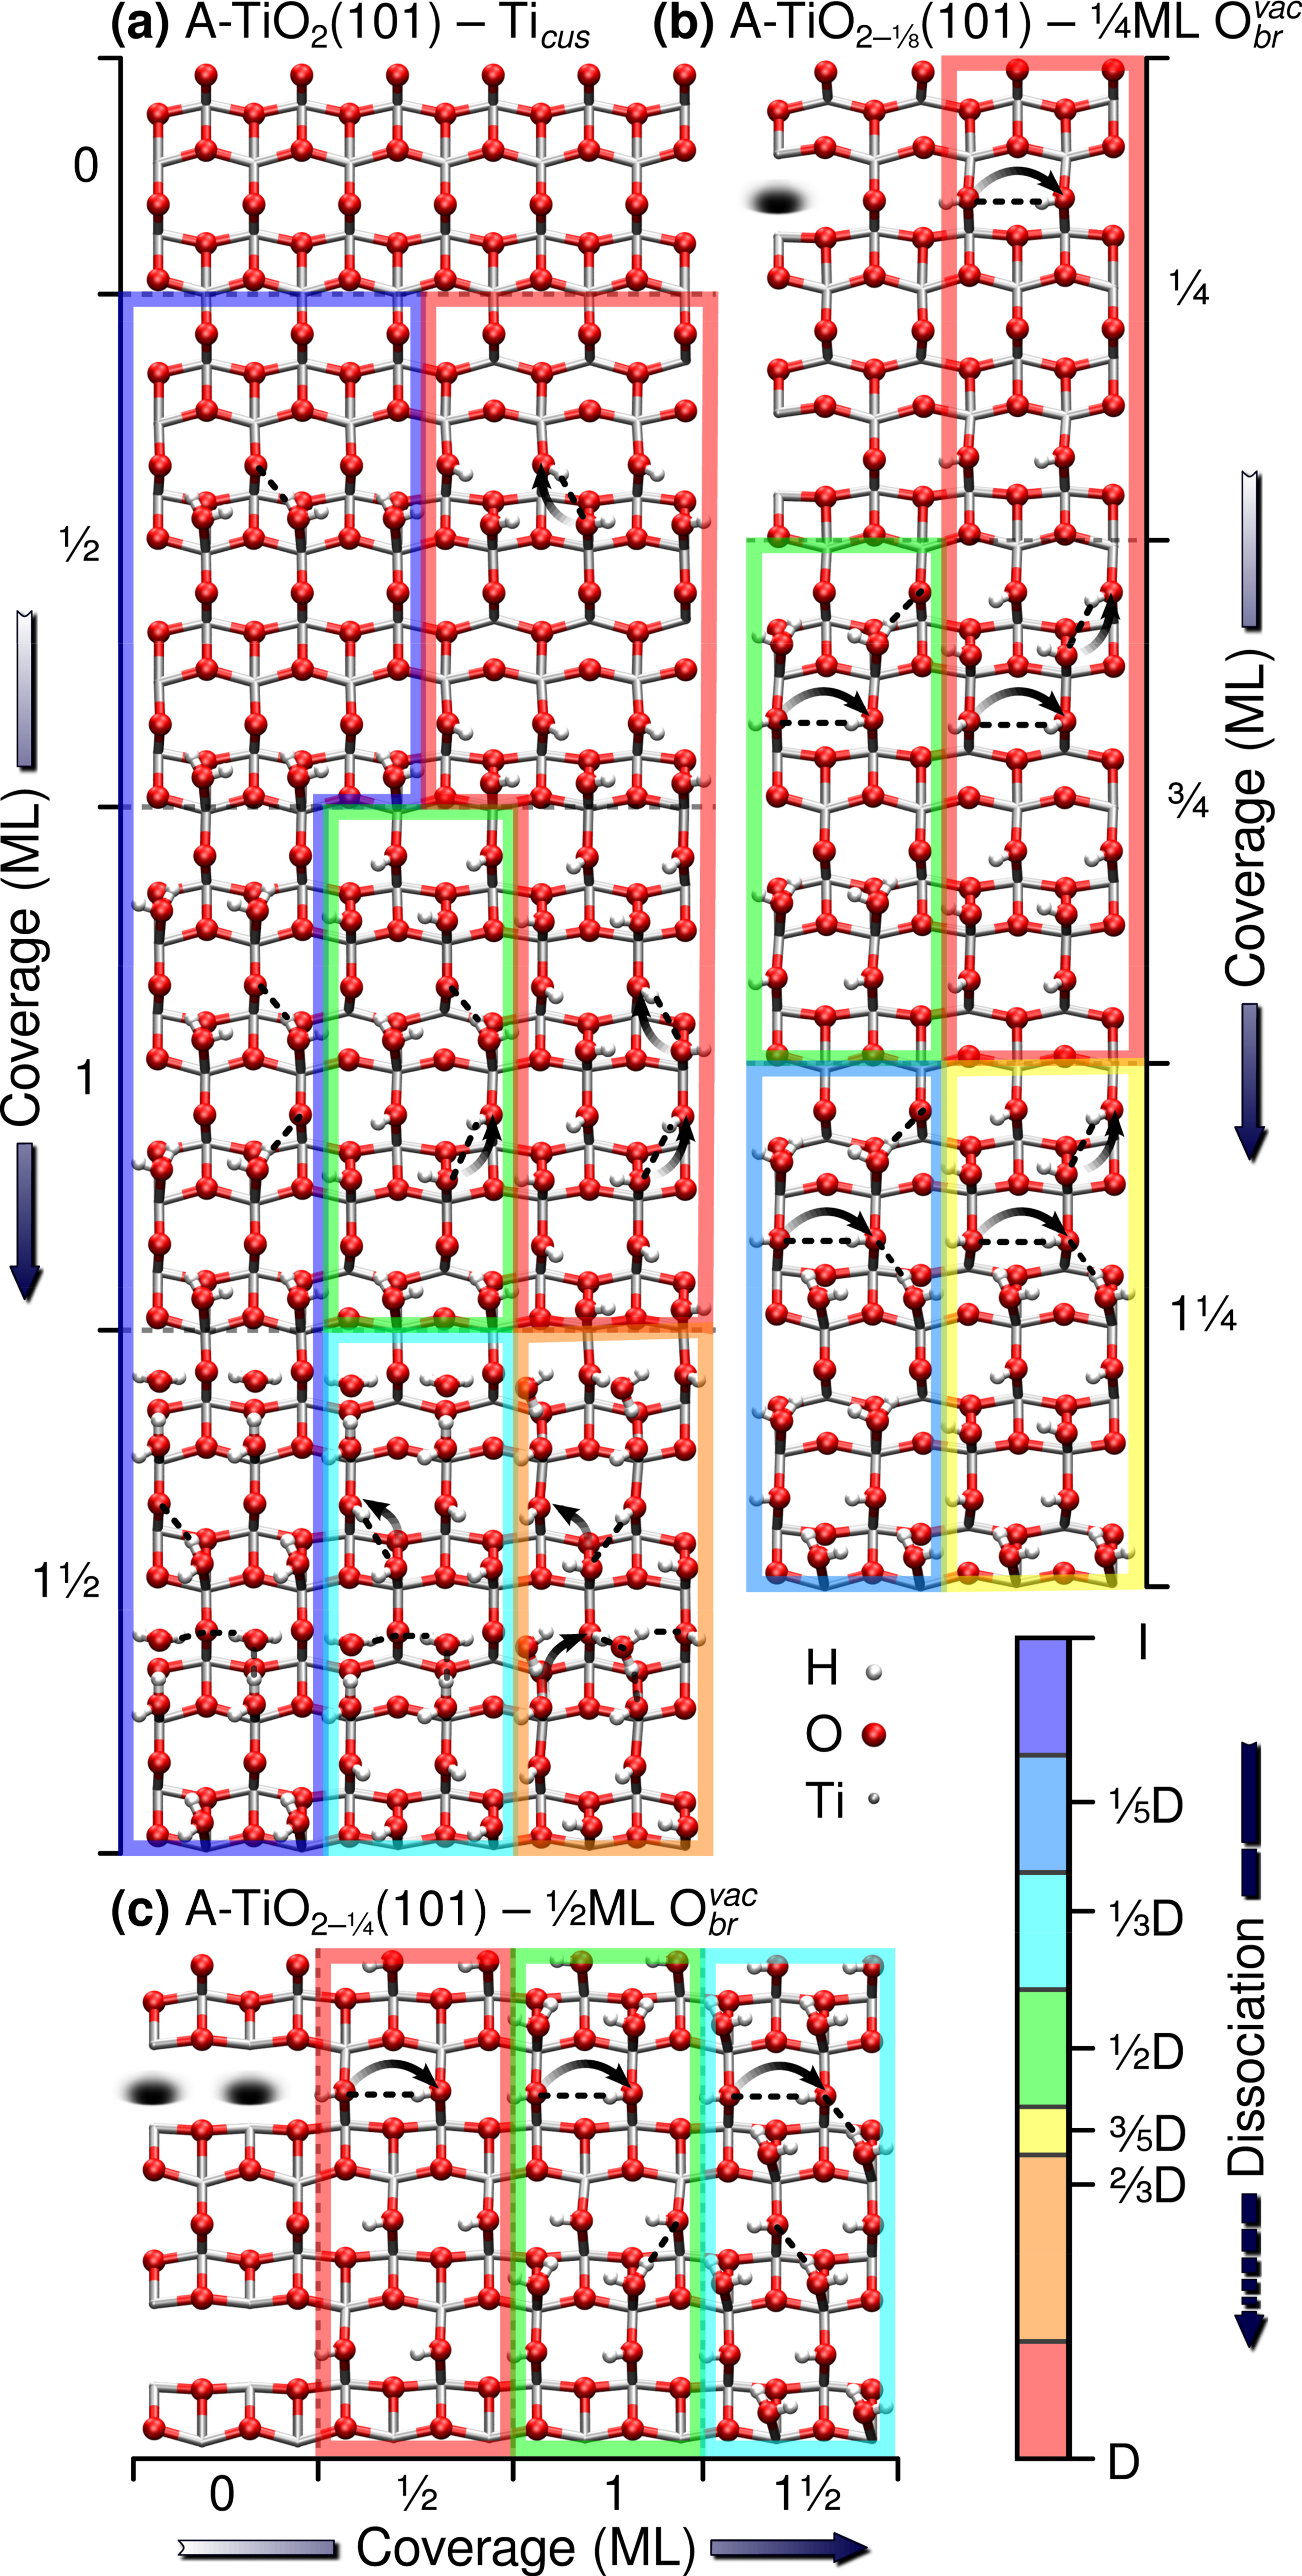
To systematically investigate the similarities and differences between A-TiO2(101) and R-TiO2(110) surfaces, we consider a variety of coverages of intact and dissociated H2O on stoichiometric A-TiO2(101) [Figure 6(a)] and defective A-TiO2-x(101) [Figure 6(b,c)], as done previously for the rutile surface 21. These configurations are consistent with previous results for H2O on A-TiO299, 100, 101, 76, 8, 102, 90, 77, 11, 78.
| coverage | A-TiO2-x(101) | R-TiO2-x(110) | |||||||
| ML | |||||||||
| I | 0 | -0.38 | -1.42 | -0.7 | -0.33 | -1.44 | -1. | 2 | |
| D | 0 | -0.18 | -0.49 | -0.7 | -0.13 | -1.03 | -0. | 8 | |
| 1 | I | 0 | -0.37 | -1.07 | -0.6 | -0.41 | -1.28 | -1. | 1a |
| D | 0 | -0.29 | -0.43 | -0.5 | -0.23 | -0.79 | -1. | 0a | |
| D | 0 | -0.26 | -0.45 | -0.5 | -0.10 | -0.68 | -0. | 9a | |
| 1 | I | 0 | -0.35 | -0.72 | -0.7 | -0.34 | -0.99 | -1. | 3 |
| D | 0 | -0.27 | -0.42 | -0.7 | -0.17 | -0.68 | -1. | 1 | |
| D | 0 | -0.24 | -0.39 | -0.8 | -0.12 | -0.65 | -0. | 9 | |
| D | -1.35 | -1.27 | -1.0 | -0.83 | -1.37 | -1. | 1 | ||
| D | -0.69 | -1.04 | -0.8 | -0.44 | -1.15 | -1. | 1 | ||
| D | -0.60 | -0.58 | -0.7 | -0.34 | -0.79 | -0. | 8 | ||
| 1 | D | -0.50 | -1.00 | -0.6 | -0.47 | -1.15 | -1. | 0 | |
| D | -0.43 | -0.53 | -0.6 | -0.40 | -0.75 | -1. | 0 | ||
| D | -1.35 | -0.92 | -0.6 | -1.32 | -1.18 | -1. | 1a | ||
| 1 | D | -0.68 | -0.90 | -0.6 | -0.77 | -1.12 | -1. | 1 | |
| 1 | D | -0.55 | -0.99 | -0.6 | -0.69 | -1.22 | -1. | 0 | |
| aRef. 21. | |||||||||
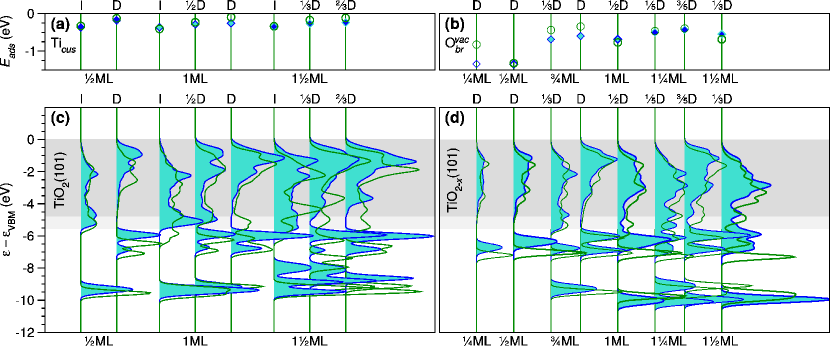
The adsorption energies shown in Table 6 and Figure 7(a,b) for H2O on A-TiO2, A-TiO, and A-TiO (101) are generally similar to those on R-TiO2, R-TiO, and R-TiO (110)21, respectively. On both A-TiO2(101) and R-TiO2(110), intact H2O adsorption is more stable than dissociative adsorption from and 1 ML coverages. The adsorption energies for H2O@Ti on A-TiO2(101) follow the same trend as on R-TiO2(110), but are somewhat stronger on A-TiO2(101), with the greatest differences seen for dissociatively adsorbed H2O. Since the photocatalytically active species HO@Ti is more stable on A-TiO2(101) than R-TiO2(110), this also suggests that A-TiO2(101) should be more photocatalytically active than R-TiO2(110). This is because one expects there to be more HO@Ti on A-TiO2(101) than R-TiO2(110).
On the defective surfaces, intact H2O adsorption is also more stable than dissociative adsorption on A-TiO(101)/R-TiO(110) and A-TiO(101)/R-TiO(110). Dissociative H2O@O adsorption is generally stronger on A-TiO(101)/A-TiO(101) than R-TiO(110)/R-TiO(110) surfaces, except for 1ML D H2O@O.
However, the adsorption energies shown in Figure 7(b) are strongly dependent on the stability of the defective A-TiO(101)/R-TiO(110) and A-TiO(101)/R-TiO(110) structures with surface O. Since surface O are less stable than subsurface O vacancies for A-TiO2(101), the adsorption energies on A-TiO2-x(101) provided in Figure 7(b) are somewhat overestimated.
Figure 7(c,d) shows the PBE H2O PDOS relative to as a function of coverage and dissociation for the structures shown in Figure 6. Overall the PDOS on A-TiO2(101) and R-TiO2(110) are in surprisingly close agreement, both in shape and energy. For ML of H2O, peaks related to the H2O 1b2, 3a1 and 1b1 levels (cf. Figure 3(b)) are clearly evident. When the coverage is increased to more than 1ML, there are larger differences between the H2O PDOS on A-TiO2(101) and R-TiO2(110). This may be attributed to the different intermolecular and interfacial interactions induced by the different hydrogen bonding networks. For 1 ML H2O on A-TiO2(101), the peak associated with the H2O 1b2 level, which is located at eV, is more delocalized than rutile. This is because there are more interfacial interactions between H2O and A-TiO2 (101). For 1ML H2O on O(D), the water 1b2 level splits into two peaks, as H2O and HO form two lines of hydrogen bonding networks. We also find the bottom of the valance band for H2O on A-TiO2, A-TiO, and A-TiO (101) is higher than that of R-TiO2, R-TiO, and R-TiO (110). This is attributable to the higher VBM of the clean A-TiO2(101) surface, as depicted by the gray regions in Figure 7.
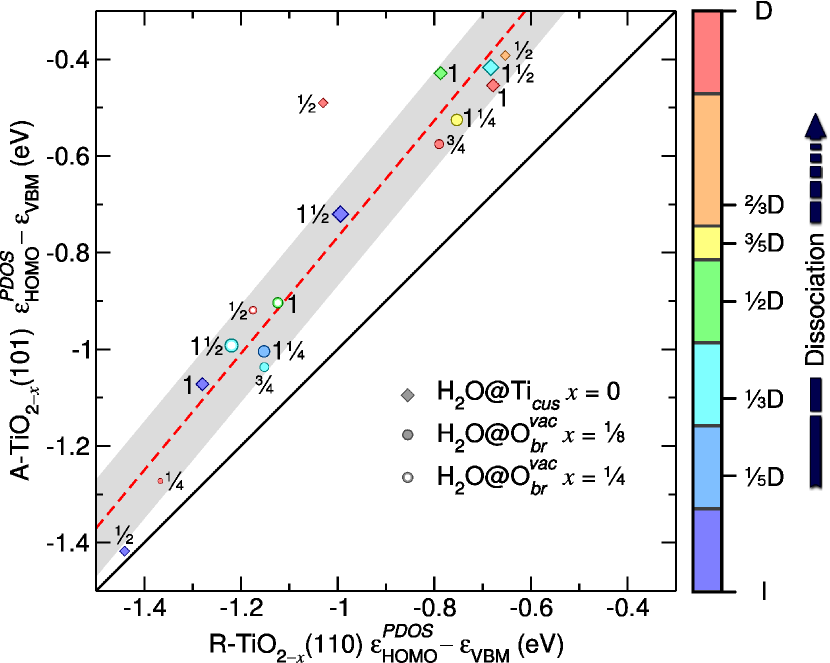
For all spectra shown in Figure 7(c,d), is higher on A-TiO2, A-TiO, and A-TiO (101) than R-TiO2, R-TiO, and R-TiO (110), respectively, as shown in Table 6 and Figure 8. Further, these differences in are larger for dissociated H2O. Since it is the HOMO of HO@Ti which can trap a photogenerated hole, as discussed in section 3.2, the larger differences in shown in Figures 7(c) and 8 for dissociated H2O suggest A-TiO2(101) should generally be more photocatalytically active than R-TiO2(110) from low coverage (ML H2O) to multi-layered H2O (1ML H2O).
For ML of dissociatively adsorbed H2O@O, relative to the VBM for R-TiO(110) is below that for A-TiO(101). This suggests HO@O should be more photocatalytically active on A-TiO(101) compared to R-TiO(110). However, as shown in the previous section, the reverse is true for their relative electrochemical activity, i.e., HO@O on R-TiO(110) is expected to be more electrochemically active than A-TiO(101). This demonstrates the importance of considering both the absolute level alignment relative to , and the level alignment relative to .
4. CONCLUSIONS
In heterogeneous catalysis, photocatalytic activity is controlled by the level alignment of the adsorbate and substrate levels. For this reason it is essential to obtain a quantitative description of the interfacial level alignment to determine and predict catalytic activity. This can only be obtained from many-body QP calculations, which are necessary to correctly describe the anisotropic screening of electron-electron interactions at the catalyst’s interface.
Previously, we have shown that HSE reliably describes the interfacial level alignment relative to the VBM for highly hybridized and localized molecular levels of H2O21 and CH3OH26 on R-TiO2(110). Here, we have shown that HSE also provides a quantitative description of the occupied Ti3+ level’s alignment relative to the Fermi level on both reduced anatase and rutile polymorphs. These are the levels from which electrons are typically excited in 2PP experiments96, 45, 83. Since HSE DFT fails in both cases, these results clearly demonstrate the important role played by anisotropic screening of the electron-electron interaction in describing the alignment of these molecular and defect levels.
In this study we have performed an in-depth comparison of the QP level alignment for H2O–A-TiO2(101) and H2O–R-TiO2(110) interfaces for a range of chemically significant structures. We have considered the limits of low and high H2O coverage, intact to fully dissociated H2O, and stoichiometric to O defective surface composition. Using the HOMO–VBM level alignment for these systems prior to irradiation , we have established the following trends in their relative photocatalytic activity for H2O photooxidation. (1) There is a strong linear correlation between on A-TiO2-x(101) and R-TiO2-x(110). (2) We consistently find H2O’s closer to for A-TiO2 than R-TiO2. (3) These differences in are greater for dissociated H2O, and increase as approaches . (4) Overall, approaches with H2O dissociation. Altogether, this suggests HO@Ti is more photocatalytically active than intact H2O@Ti and hole trapping is more favorable on A-TiO2(101) than R-TiO2(110). This may explain why the anatase polymorph is generally more photocatalytically active than rutile for H2O photooxidation.
We have clearly demonstrated that the ground state interfacial level alignment is a key factor in understanding the photocatalytic activity of TiO2. Moreover, in general, knowledge of an interface’s ground state electronic structure can be used to establish trends for predicting photocatalytic activity.
AUTHOR INFORMATION
Corresponding Author
E-mail: duncan.mowbray@gmail.com (D.J.M.)
Notes
The authors declare no competing financial interest.
ACKNOWLEDGMENTS
We acknowledge financial support from the China Scholarship Council (CSC), the European Projects DYNamo (ERC-2010-AdG-267374), CRONOS (280879-2 CRONOS CP-FP7), Cost Actions CM1204 (XLIC), and MP1306 (EuSpec); Spanish Grants (FIS2012-37549-C05-02, FIS2013-46159-C3-1-P, PIB2010US-00652, RYC-2011-09582, JCI-2010-08156); Generalitat de Catalunya (2014SGR301, XRQTC); Grupos Consolidados UPV/EHU del Gobierno Vasco (IT-578-13); NSFC (21003113 and 21121003); MOST (2011CB921404); the Chinese Academy of Sciences President’s International Fellowship; and NSF Grant CHE-1213189; and computational time from the Shanghai Supercomputing Center, BSC Red Espanola de Supercomputacion, and EMSL at PNNL by the DOE.
REFERENCES
- Fujishima et al. 2008 Fujishima, A.; Zhang, X.; Tryk, D. A. TiO2 photocatalysis and related surface phenomena. Surf. Sci. Rep. 2008, 63, 515–582
- Diebold 2003 Diebold, U. The surface science of titanium dioxide. Surf. Sci. Rep. 2003, 48, 53–229
- Schneider et al. 2014 Schneider, J.; Matsuoka, M.; Takeuchi, M.; Zhang, J.; Horiuchi, Y.; Anpo, M.; Bahnemann, D. W. Understanding TiO2Photocatalysis: Mechanisms and Materials. Chem. Rev. 2014, 114, 9919–9986
- Henderson 2011 Henderson, M. A. A surface science perspective on TiO2 photocatalysis. Surf. Sci. Rep. 2011, 66, 185–297
- Thompson and Yates 2006 Thompson, T. L.; Yates, J. T. J. Surface Science Studies of the Photoactiavation of TiO2—New Photochemical Processes. Chem. Rev. 2006, 106, 4428–4453
- Setvín et al. 2013 Setvín, M.; Aschauer, U.; Scheiber, P.; Li, Y.-F.; Hou, W.; Schmid, M.; Selloni, A.; Diebold, U. Reaction of O2 with Subsurface Oxygen Vacancies on TiO2Anatase (101). Science 2013, 341, 988–991
- Henderson 2002 Henderson, M. A. The interaction of water with solid surfaces: fundamental aspects revisited. Surf. Sci. Rep. 2002, 46, 1–308
- Sun et al. 2010 Sun, C.; Liu, L.-M.; Selloni, A.; Lu, G. Q. M.; Smith, S. C. Titania-water interactions: a review of theoretical studies. J. Mater. Chem. 2010, 20, 10319–10334
- Fujishima and Honda 1972 Fujishima, A.; Honda, K. Electrochemical Photolysis of Water at a Semiconductor Electrode. Nature 1972, 238, 37–38
- Protti et al. 2014 Protti, S.; Albini, A.; Serpone, N. Photocatalytic generation of solar fuels from the reduction of H2O and CO2: a look at the patent literature. Phys. Chem. Chem. Phys. 2014, 16, 19790–19827
- Vittadini et al. 1998 Vittadini, A.; Selloni, A.; Rotzinger, F. P.; Grätzel, M. Structure and Energetics of Water Adsorbed at Anatase and Surfaces. Phys. Rev. Lett. 1998, 81, 2954–2957
- Wang et al. 2013 Wang, Y.; Sun, H.; Tan, S.; Feng, H.; Cheng, Z.; Zhao, J.; Zhao, A.; Wang, B.; Luo, Y.; Yang, J.; Hou, J. G. Role of point defects on the reactivity of reconstructed anatase titanium dioxide (001) surface. Nat. Commun. 2013, 4, 2214
- Diebold et al. 2003 Diebold, U.; Ruzycki, N.; Herman, G.; Selloni, A. One step towards bridging the materials gap: surface studies of TiO2 anatase. Catal. Today 2003, 85, 93–100
- Barnard and Curtiss 2005 Barnard, A. S.; Curtiss, L. A. Prediction of TiO2Nanoparticle Phase and Shape Transitions Controlled by Surface Chemistry. Nano Letters 2005, 5, 1261–1266
- Kavan et al. 1996 Kavan, L.; Grätzel, M.; Gilbert, S. E.; Klemenz, C.; Scheel, H. J. Electrochemical and Photoelectrochemical Investigation of Single-Crystal Anatase. J. Amer. Chem. Soc. 1996, 118, 6716–6723
- Li et al. 2010 Li, Y.-F.; Liu, Z.-P.; Liu, L.; Gao, W. Mechanism and Activity of Photocatalytic Oxygen Evolution on Titania Anatase in Aqueous Surroundings. J. Amer. Chem. Soc. 2010, 132, 13008–13015
- Chen et al. 2013 Chen, J.; Li, Y.-F.; Sit, P.; Selloni, A. Chemical Dynamics of the First Proton-Coupled Electron Transfer of Water Oxidation on TiO2 Anatase. J. Am. Chem. Soc. 2013, 135, 18774–18777
- Tan et al. 2012 Tan, S.; Feng, H.; Ji, Y.; Wang, Y.; Zhao, J.; Zhao, A.; Wang, B.; Luo, Y.; Yang, J.; Hou, J. G. Observation of Photocatalytic Dissociation of Water on Terminal Ti Sites of TiO2(110)- Surface. J. Am. Chem. Soc. 2012, 134, 9978–9985
- Friend 2014 Friend, C. M. Perspectives on Heterogeneous Photochemistry. Chem. Rec. 2014, 14, 944–951
- Stevanovic et al. 2014 Stevanovic, V.; Lany, S.; Ginley, D. S.; Tumas, W.; Zunger, A. Assessing capability of semiconductors to split water using ionization potentials and electron affinities only. Phys. Chem. Chem. Phys. 2014, 16, 3706–3714
- Migani et al. 2015 Migani, A.; Mowbray, D. J.; Zhao, J.; Petek, H. Quasiparticle interfacial level alignment of highly hybridized frontier levels: H2O on TiO2(110). J. Chem. Theory Comput. 2015, 11, 239–251
- Cheng et al. 2014 Cheng, J.; VandeVondele, J.; Sprik, M. Identifying Trapped Electronic Holes at the Aqueous TiO2 Interface. J. Phys. Chem. C 2014, 118, 5437–5444
- Hedin 1965 Hedin, L. New Method for Calculating the One-Particle Green’s Function with Application to the Electron-Gas Problem. Phys. Rev. 1965, 139, A796–A823
- Onida et al. 2002 Onida, G.; Reining, L.; Rubio, A. Electronic excitations: density-functional versus many-body Green’s-function approaches. Rev. Mod. Phys. 2002, 74, 601–659
- Migani et al. 2013 Migani, A.; Mowbray, D. J.; Iacomino, A.; Zhao, J.; Petek, H.; Rubio, A. Level Alignment of a Prototypical Photocatalytic System: Methanol on TiO2(110). J. Am. Chem. Soc. 2013, 135, 11429–11432
- Migani et al. 2014 Migani, A.; Mowbray, D. J.; Zhao, J.; Petek, H.; Rubio, A. Quasiparticle level alignment for photocatalytic interfaces. J. Chem. Theory Comput. 2014, 10, 2103–2114
- Migani and Mowbray 2014 Migani, A.; Mowbray, D. J. Coverage dependence of the level alignment for methanol on TiO2(110). Comp. Theor. Chem. 2014, 1040–1041, 259–265
- De Angelis et al. 2014 De Angelis, F.; Di Valentin, C.; Fantacci, S.; Vittadini, A.; Selloni, A. Theoretical Studies on Anatase and Less Common TiO2Phases: Bulk, Surfaces, and Nanomaterials. Chem. Rev. 2014, 114, 9708–9753
- Lazzeri et al. 2001 Lazzeri, M.; Vittadini, A.; Selloni, A. Structure and energetics of stoichiometric anatase surfaces. Phys. Rev. B 2001, 63, 155409
- Yan et al. 2013 Yan, J.; Wu, G.; Guan, N.; Li, L.; Li, Z.; Cao, X. Understanding the effect of surface/bulk defects on the photocatalytic activity of TiO2: anatase versus rutile. Phys. Chem. Chem. Phys. 2013, 15, 10978–10988
- Brookes et al. 2001 Brookes, I. M.; Muryn, C. A.; Thornton, G. Imaging Water Dissociation on . Phys. Rev. Lett. 2001, 87, 266103
- Kurtz et al. 1989 Kurtz, R. L.; Stock-Bauer, R.; Madey, T. E.; Román, E.; Segovia, J. L. D. Synchrotron radiation studies of H2O adsorption on TiO2(110). Surf. Sci. 1989, 218, 178–200
- Krischok et al. 2001 Krischok, S.; Höfft, O.; Günster, J.; Stultz, J.; Goodman, D.; Kempter, V. H2O interaction with bare and Li-precovered TiO2: studies with electron spectroscopies (MIES and UPS(HeI and II)). Surf. Sci. 2001, 495, 8–18
- Shishkin and Kresse 2006 Shishkin, M.; Kresse, G. Implementation and performance of the frequency-dependent method within the PAW framework. Phys. Rev. B 2006, 74, 035101
- Shishkin et al. 2007 Shishkin, M.; Marsman, M.; Kresse, G. Accurate Quasiparticle Spectra from Self-Consistent GW Calculations with Vertex Corrections. Phys. Rev. Lett. 2007, 99, 246403
- Perdew and Zunger 1981 Perdew, J. P.; Zunger, A. Self-interaction correction to density-functional approximations for many-electron systems. Phys. Rev. B 1981, 23, 5048–5079
- Perdew et al. 1996 Perdew, J. P.; Burke, K.; Ernzerhof, M. Generalized Gradient Approximation Made Simple. Phys. Rev. Lett. 1996, 77, 3865
- Heyd et al. 2003 Heyd, J.; Scuseria, G. E.; Ernzerhof, M. Hybrid functionals based on a screened Coulomb potential. J. Chem. Phys. 2003, 118, 8207
- Krukau et al. 2006 Krukau, A. V.; Vydrov, O. A.; Izmaylov, A. F.; Scuseria, G. E. Influence of the exchange screening parameter on the performance of screened hybrid functionals. J. Chem. Phys. 2006, 125, 224106
- Cheng and Sprik 2012 Cheng, J.; Sprik, M. Alignment of electronic energy levels at electrochemical interfaces. Phys. Chem. Chem. Phys. 2012, 14, 11245–11267
- Cheng and Sprik 2010 Cheng, J.; Sprik, M. Aligning electronic energy levels at the TiOH2O interface. Phys. Rev. B 2010, 82, 081406
- Chung et al. 1977 Chung, Y. W.; Lo, W. J.; Somorjai, G. A. Low energy electron diffraction and electron spectroscopy studies of the clean (110) and (100) titanium dioxide (rutile) crystal surfaces. Surf. Sci. 1977, 64, 588–602
- Onishi et al. 1988 Onishi, H.; Aruga, T.; Egawa, C.; Iwasawa, Y. Adsorption of CH3OH, HCOOH and SO2 on TiO2(110) and stepped TiO2(441) surfaces. Surf. Sci. 1988, 193, 33–46
- Borodin and Reichling 2011 Borodin, A.; Reichling, M. Characterizing TiO2(110) surface states by their work function. Phys. Chem. Chem. Phys. 2011, 13, 15442–15447
- Onda et al. 2004 Onda, K.; Li, B.; Petek, H. Two-photon photoemission spectroscopy of surfaces modified by defects and or adsorbates. Phys. Rev. B 2004, 70, 045415
- Landmann et al. 2012 Landmann, M.; Rauls, E.; Schmidt, W. G. The electronic structure and optical response of rutile, anatase and brookite TiO2. J. Phys.: Condens. Matter 2012, 24, 195503
- Marques et al. 2011 Marques, M. A. L.; Vidal, J.; Oliveira, M. J. T.; Reining, L.; Botti, S. Density-based mixing parameter for hybrid functionals. Phys. Rev. B 2011, 83, 035119
- Kresse and Joubert 1999 Kresse, G.; Joubert, D. From ultrasoft pseudopotentials to the projector augmented-wave method. Phys. Rev. B 1999, 59, 1758
- Kresse and Furthmüller 1996 Kresse, G.; Furthmüller, J. Efficient iterative schemes for ab initio total-energy calculations using a plane-wave basis set. Phys. Rev. B 1996, 54, 11169
- Yan et al. 2011 Yan, Q.; Rinke, P.; Winkelnkemper, M.; Qteish, A.; Bimberg, D.; Scheffler, M.; de Walle, C. G. V. Band parameters and strain effects in ZnO and group-III nitrides. Semi. Sci. Tech. 2011, 26, 014037
- Botti and Marques 2013 Botti, S.; Marques, M. A. L. Strong Renormalization of the Electronic Band Gap due to Lattice Polarization in the Formalism. Phys. Rev. Lett. 2013, 110, 226404
- Chiodo et al. 2010 Chiodo, L.; García-Lastra, J. M.; Iacomino, A.; Ossicini, S.; Zhao, J.; Petek, H.; Rubio, A. Self-energy and excitonic effects in the electronic and optical properties of TiO2 crystalline phases. Phys. Rev. B 2010, 82, 045207
- Kang and Hybertsen 2010 Kang, W.; Hybertsen, M. S. Quasiparticle and optical properties of rutile and anatase TiO2. Phys. Rev. B 2010, 82, 085203
- van Setten et al. 2011 van Setten, M. J.; Gremaud, R.; Brocks, G.; Dam, B.; Kresse, G.; de Wijs, G. A. Optical response of the sodium alanate system: -BSE calculations and thin film measurements. Phys. Rev. B 2011, 83, 035422
- Reining et al. 2002 Reining, L.; Olevano, V.; Rubio, A.; Onida, G. Excitonic Effects in Solids Described by Time-Dependent Density-Functional Theory. Phys. Rev. Lett. 2002, 88, 066404
- Burdett et al. 1987 Burdett, J. K.; Hughbanks, T.; Miller, G. J.; Richardson, J. W.; Smith, J. V. Structural-electronic relationships in inorganic solids: powder neutron diffraction studies of the rutile and anatase polymorphs of titanium dioxide at 15 and 295 K. J. Am. Chem. Soc. 1987, 109, 3639–3646
- Hammer et al. 1999 Hammer, B.; Hansen, L. B.; Nørskov, J. K. Improved Adsorption Energetics within Density-Functional Theory Using Revised Perdew-Burke-Ernzerhof Functionals. Phys. Rev. B 1999, 59, 7413–7421
- Martínez et al. 2009 Martínez, J. I.; Hansen, H. A.; Rossmeisl, J.; Nørskov, J. K. Formation energies of rutile metal dioxides using density functional theory. Phys. Rev. B 2009, 79, 045120
- Calle-Vallejo et al. 2010 Calle-Vallejo, F.; Martínez, J. I.; García-Lastra, J. M.; Mogensen, M.; Rossmeisl, J. Trends in Stability of Perovskite Oxides. Angew. Chem. Int. Ed. 2010, 49, 7699–7701
- Zhu and Gao 2014 Zhu, T.; Gao, S.-P. The Stability, Electronic Structure, and Optical Property of TiO2Polymorphs. J. Phys. Chem. C 2014, 118, 11385–11396
- Tezuka et al. 1994 Tezuka, Y.; Shin, S.; Ishii, T.; Ejima, T.; Suzuki, S.; Sato, S. Photoemission and Bremsstrahlung Isochromat Spectroscopy Studies of TiO2 (Rutile) and SrTiO3. J. Phys. Soc. Jpn. 1994, 63, 347–357
- Reyes-Coronado et al. 2008 Reyes-Coronado, D.; Rodríguez-Gattorno, G.; Espinosa-Pesqueira, M. E.; Cab, C.; de Coss, R.; Oskam, G. Phase-pure TiO2 nanoparticles: anatase, brookite and rutile. Nanotechnology 2008, 19, 145605
- Tang et al. 1995 Tang, H.; Lévy, F.; Berger, H.; Schmid, P. Urbach tail of anatase . Phys. Rev. B 1995, 52, 7771–7774
- Amtout and Leonelli 1995 Amtout, A.; Leonelli, R. Optical properties of rutile near its fundamental band gap. Phys. Rev. B 1995, 51, 6842–6851
- Pascual et al. 1978 Pascual, J.; Camassel, J.; Mathieu, H. Fine structure in the intrinsic absorption edge of Ti. Phys. Rev. B 1978, 18, 5606–5614
- Hosaka et al. 1997 Hosaka, N.; Sekiya, T.; Satoko, C.; Kurita, S. Optical Properties of Single-Crystal Anatase TiO2. J. Phys. Soc. Jpn. 1997, 66, 877–880
- Lee et al. 2011 Lee, B.; ki Lee, C.; Hwang, C. S.; Han, S. Influence of exchange-correlation functionals on dielectric properties of rutile TiO2. Curr. Appl. Phys. 2011, 11, S293–S296
- Cardona and Harbeke 1965 Cardona, M.; Harbeke, G. Optical Properties and Band Structure of Wurtzite-Type Crystals and Rutile. Phys. Rev. 1965, 137, A1467–A1476
- Tiwald and Schubert 2000 Tiwald, T. E.; Schubert, M. Measurement of rutile TiO2 dielectric tensor from 0.148 to 33 m using generalized ellipsometry. Proc. SPIE 2000, 4103, 19–29
- Traylor et al. 1971 Traylor, J. G.; Smith, H. G.; Nicklow, R. M.; Wilkinson, M. K. Lattice Dynamics of Rutile. Phys. Rev. B 1971, 3, 3457–3472
- Bruneval and Marques 2013 Bruneval, F.; Marques, M. A. L. Benchmarking the Starting Points of the Approximation for Molecules. J. Chem. Theory Comput. 2013, 9, 324–329
- Pfeifer et al. 2013 Pfeifer, V.; Erhart, P.; Li, S.; Rachut, K.; Morasch, J.; Brötz, J.; Reckers, P.; Mayer, T.; Rühle, S.; Zaban, A.; Mora Seró, I.; Bisquert, J.; Jaegermann, W.; Klein, A. Energy Band Alignment between Anatase and Rutile TiO2. J. Phys. Chem. Lett. 2013, 4, 4182–4187
- Scanlon et al. 2013 Scanlon, D. O.; Dunnill, C. W.; Buckeridge, J.; Shevlin, S. A.; Logsdail, A. J.; Woodley, S. M.; Catlow, C. R. A.; Powell, M. J.; Palgrave, R. G.; Parkin, I. P.; Watson, G. W.; Keal, T. W.; Sherwood, P.; Walsh, A.; Sokol, A. A. Band alignment of rutile and anatase TiO2. Nat. Mater. 2013, 12, 798–801
- Sanches et al. 2014 Sanches, F. F.; Mallia, G.; Liborio, L.; Diebold, U.; Harrison, N. M. Hybrid exchange density functional study of vicinal anatase surfaces. Phys. Rev. B 2014, 89, 245309
- Cheng et al. 2012 Cheng, J.; Sulpizi, M.; VandeVondele, J.; Sprik, M. Hole Localization and Thermochemistry of Oxidative Dehydrogenation of Aqueous Rutile TiO2(110). ChemCatChem 2012, 4, 636–640
- Selloni et al. 1998 Selloni, A.; Vittadini, A.; Gräzel, M. The adsorption of small molecules on the TiO2anatase (101) surface by first-principles molecular dynamics. Surf. Sci. 1998, 402, 219–222
- He et al. 2009 He, Y.; Tilocca, A.; Dulub, O.; Selloni, A.; Diebold, U. Local ordering and electronic signatures of submonolayer water on anatase TiO2(101). Nat. Mater. 2009, 8, 585–589
- Herman et al. 2003 Herman, G. S.; Dohnálek, Z.; Ruzycki, N.; Diebold, U. Experimental Investigation of the Interaction of Water and Methanol with Anatase−TiO2(101). J. Phys. Chem. B 2003, 107, 2788–2795
- Lee et al. 2013 Lee, J.; Sorescu, D. C.; Deng, X.; Jordan, K. D. Water Chain Formation on TiO2(110). J. Phys. Chem. Lett. 2013, 4, 53–57
- Kimmel et al. 2012 Kimmel, G. A.; Baer, M.; Petrik, N. G.; VandeVondele, J.; Rousseau, R.; Mundy, C. J. Polarization- and Azimuth-Resolved Infrared Spectroscopy of Water on TiO2(110): Anisotropy and the Hydrogen-Bonding Network. J. Phys. Chem. Lett. 2012, 3, 778–784
- Liu et al. 2010 Liu, L.-M.; Zhang, C.; Thornton, G.; Michaelides, A. Structure and dynamics of liquid water on rutile . Phys. Rev. B 2010, 82, 161415
- Zhao et al. 2006 Zhao, J.; Li, B.; Jordan, K. D.; Yang, J.; Petek, H. Interplay between hydrogen bonding and electron solvation on hydrated . Phys. Rev. B 2006, 73, 195309
- Onda et al. 2005 Onda, K.; Li, B.; Zhao, J.; Jordan, K. D.; Yang, J.; Petek, H. Wet Electrons at the H2O/TiO2(110) Surface. Science 2005, 308, 1154–1158
- Mowbray et al. 2011 Mowbray, D. J.; Martínez, J. I.; Calle-Vallejo, F.; Rossmeisl, J.; Thygesen, K. S.; Jacobsen, K. W.; Nørskov, J. K. Trends in Metal Oxide Stability for Nanorods, Nanotubes, and Surfaces. J. Phys. Chem. C 2011, 115, 2244–2252
- Tritsaris et al. 2014 Tritsaris, G. A.; Vinichenko, D.; Kolesov, G.; Friend, C. M.; Kaxiras, E. Dynamics of the Photogenerated Hole at the Rutile (110)/Water Interface: A Nonadiabatic Simulation Study. J. Phys. Chem. C 2014, 118, 27393–27401
- Xu et al. 2014 Xu, C.; Yang, W.; Guo, Q.; Dai, D.; Chen, M.; Yang, X. Molecular Hydrogen Formation from Photocatalysis of Methanol on Anatase-TiO2(101). J. Am. Chem. Soc. 2014, 136, 602–605
- Luttrell et al. 2014 Luttrell, T.; Halpegamage, S.; Tao, J.; Kramer, A.; Sutter, E.; Batzill, M. Why is anatase a better photocatalyst than rutile? - Model studies on epitaxial TiO2 films. Sci. Rep. 2014, 4, 4043
- Schaub et al. 2001 Schaub, R.; Thostrup, P.; Lopez, N.; Lægsgaard, E.; Stensgaard, I.; Nørskov, J. K.; Besenbacher, F. Oxygen Vacancies as Active Sites for Water Dissociation on Rutile . Phys. Rev. Lett. 2001, 87, 266104
- Aschauer et al. 2010 Aschauer, U.; He, Y.; Cheng, H.; Li, S.-C.; Diebold, U.; Selloni, A. Influence of Subsurface Defects on the Surface Reactivity of TiO2: Water on Anatase (101). J. Phys. Chem. C 2010, 114, 1278–1284
- Li and Gao 2014 Li, Y.; Gao, Y. Interplay between Water and Anatase (101) Surface with Subsurface Oxygen Vacancy. Phys. Rev. Lett. 2014, 112, 206101
- Aschauer and Selloni 2012 Aschauer, U.; Selloni, A. Hydrogen interaction with the anatase TiO2(101) surface. Phys. Chem. Chem. Phys. 2012, 14, 16595–16602
- Setvin et al. 2014 Setvin, M.; Franchini, C.; Hao, X.; Schmid, M.; Janotti, A.; Kaltak, M.; Van de Walle, C. G.; Kresse, G.; Diebold, U. Direct View at Excess Electrons in Rutile and Anatase. Phys. Rev. Lett. 2014, 113, 086402
- Minato et al. 2009 Minato, T.; Sainoo, Y.; Kim, Y.; Kato, H. S.; Aika, K.-i.; Kawai, M.; Zhao, J.; Petek, H.; Huang, T.; He, W.; Wang, B.; Wang, Z.; Zhao, Y.; Yang, J.; Hou, J. G. The electronic structure of oxygen atom vacancy and hydroxyl impurity defects on titanium dioxide (110) surface. J. Chem. Phys. 2009, 130, 124502
- Papageorgiou et al. 2010 Papageorgiou, A. C.; Beglitis, N. S.; Pang, C. L.; Teobaldi, G.; Cabailh, G.; Chen, Q.; Fisher, A. J.; Hofer, W. A.; Thornton, G. Electron traps and their effect on the surface chemistry of TiO2(110). Proc. Natl. Acad. Sci. 2010, 107, 2391–2396
- Thomas et al. 2007 Thomas, A. G.; Flavell, W. R.; Mallick, A. K.; Kumarasinghe, A. R.; Tsoutsou, D.; Khan, N.; Chatwin, C.; Rayner, S.; Smith, G. C.; Stockbauer, R. L.; Warren, S.; Johal, T. K.; Patel, S.; Holland, D.; Taleb, A.; Wiame, F. Comparison of the electronic structure of anatase and rutile single-crystal surfaces using resonant photoemission and x-ray absorption spectroscopy. Phys. Rev. B 2007, 75, 035105
- Argondizzo et al. 2015 Argondizzo, A.; Cui, X.; Wang, C.; Sun, H.; Shang, H.; Zhao, J.; Petek, H. Ultrafast multiphoton pump-probe photoemission excitation pathways in rutile . Phys. Rev. B 2015, 91, 155429
- Fujimori et al. 1996 Fujimori, A.; Bocquet, A.; Morikawa, K.; Kobayashi, K.; Saitoh, T.; Tokura, Y.; Hase, I.; Onoda, M. Electronic structure and electron-phonon interaction in transition metal oxides with configuration and lightly doped compounds. J. Phys. Chem. Solids 1996, 57, 1379–1384
- Nørskov et al. 2004 Nørskov, J. K.; Rossmeisl, J.; Logadottir, A.; Lindqvist, L.; Kitchin, J. R.; Bligaard, T.; Jónsson, H. Origin of the Overpotential for Oxygen Reduction at a Fuel-Cell Cathode. J. Phys. Chem. B 2004, 108, 17886–17892
- Tilocca and Selloni 2004 Tilocca, A.; Selloni, A. Vertical and Lateral Order in Adsorbed Water Layers on Anatase TiO2(101). Langmuir 2004, 20, 8379–8384
- Tilocca and Selloni 2004 Tilocca, A.; Selloni, A. Structure and Reactivity of Water Layers on Defect-Free and Defective Anatase TiO2(101) Surfaces. J. Phys. Chem. B 2004, 108, 4743–4751
- Zhao et al. 2012 Zhao, Z.; Li, Z.; Zou, Z. Structure and Properties of Water on the Anatase TiO2(101) Surface: From Single-Molecule Adsorption to Interface Formation. J. Phys. Chem. C 2012, 116, 11054–11061
- Tilocca and Selloni 2003 Tilocca, A.; Selloni, A. Reaction pathway and free energy barrier for defect-induced water dissociation on the (101) surface of TiO2-anatase. J. Chem. Phys. 2003, 119, 7445–7450