ASKAP H i imaging of the galaxy group IC 1459
Abstract
We present H i imaging of the galaxy group IC 1459 carried out with six antennas of the Australian SKA Pathfinder equipped with phased-array feeds. We detect and resolve H i in eleven galaxies down to a column density of cm-2 inside a deg2 field and with a resolution of arcmin on the sky and km s-1 in velocity. We present H i images, velocity fields and integrated spectra of all detections, and highlight the discovery of three H i clouds – two in the proximity of the galaxy IC 5270 and one close to NGC 7418. Each cloud has an H i mass of M⊙ and accounts for percent of the H i associated with its host galaxy. Available images at ultraviolet, optical and infrared wavelengths do not reveal any clear stellar counterpart of any of the clouds, suggesting that they are not gas-rich dwarf neighbours of IC 5270 and NGC 7418. Using Parkes data we find evidence of additional extended, low-column-density H i emission around IC 5270, indicating that the clouds are the tip of the iceberg of a larger system of gas surrounding this galaxy. This result adds to the body of evidence on the presence of intra-group gas within the IC 1459 group. Altogether, the H i found outside galaxies in this group amounts to several times M⊙, at least 10 percent of the H i contained inside galaxies. This suggests a substantial flow of gas in and out of galaxies during the several billion years of the group’s evolution.
keywords:
galaxies: evolution, galaxies: ISM.1 Introduction
Galaxy evolution is to a large extent the tale of how galaxies get and lose gas, and how efficiently they convert it into stars. A key part of this tale is the interaction between galaxies and their environment. This can occur through a number of processes such as the continuous streaming of gas from the inter-galactic medium predicted by simulations (e.g., Binney, 1977; Kereš et al., 2005), the tidal interaction between galaxies (e.g., Toomre & Toomre, 1972) as well as between galaxies and the large-scale gravitational potential (e.g., Bekki et al., 2005), and the hydrodynamical interaction between galaxies’ inter-stellar medium and the inter-galactic medium (e.g., Gunn & Gott, 1972; Cowie & Songaila, 1977; Nulsen, 1982). These processes may be largely responsible for determining the rate of gas accretion and removal in galaxies, and for the shifting balance between the populations of early- and late-type galaxies across cosmic time (e.g., Butcher & Oemler, 1984) and as a function of environment density (e.g., Dressler, 1980).
One of the most direct ways to study these phenomena in the nearby Universe is the observation of galaxies’ neutral hydrogen atomic gas (H i). This gas is often distributed out to a large radius where, if imaged with sufficiently high angular resolution, it can reveal episodes of gas accretion and stripping (e.g., Oosterloo & van Gorkom, 2005; Sancisi et al., 2008; Serra et al., 2013). The resolved observation of H i in galaxies in a wide range of environments – from large scale voids to galaxy groups and clusters – has indeed been widely used to study galaxy evolution (e.g., Bravo-Alfaro et al., 2000; Verdes-Montenegro et al., 2001; Verheijen & Zwaan, 2001; Chung et al., 2009; Kreckel et al., 2011; Serra et al., 2012). In the future, this type of investigation will be possible on unprecedentedly large areas of the sky, as wide-field H i surveys at sub-arcminute resolution are planned to be carried out using new radio telescopes such as the Australian Square Kilometre Array Pathfinder (ASKAP; Johnston et al. 2007, 2008) and APERTIF (Verheijen et al., 2008).
| galaxy | (H i)ASKAP | (H i)K09 | (H i)HIPASS | ||
|---|---|---|---|---|---|
| (km s-1) | (mag) | ( M⊙) | ( M⊙) | ( M⊙) | |
| (1) | (2) | (3) | (4) | (5) | (6) |
| DUKST 406-83 | 1624 | 17.1 | - | - | |
| ESO 406-G31 | 1593 | 15.0 | - | - | - |
| ESO 406-G40 | 1238 | 16.3 | |||
| ESO 406-G42 | 1365 | 15.4 | |||
| IC 1459a | 1802 | 11.0 | - | - | - |
| IC 5264a | 1940 | 13.7 | - | ||
| IC 5269 | 1967 | 13.2 | - | - | - |
| IC 5269Ab | 2870 | 14.2 | - | ||
| IC 5269Bc | 1667 | 13.2 | |||
| IC 5269C | 1783 | 14.2 | |||
| IC 5270c | 1983 | 13.0 | |||
| IC 5273 | 1293 | 12.2 | |||
| NGC 7418c | 1450 | 12.3 | |||
| NGC 7418Ad | 2102 | 13.8 | |||
| NGC 7421 | 1792 | 13.0 | |||
| 2dFGRS S537Z045 | 2188 | 16.2 | - | - | - |
| 2MASX J22571092-3640103a,d | 1945 | 15.8 | - | - | - |
Column 1. Galaxy name. Column 2. Heliocentric velocity from the NASA Extragalactic Database (NED). Column 3. -band apparent magnitude from NED. Column 4. H i mass from this work. This is calculated assuming a distance of 29 Mpc for all galaxies (see text). Column 5. H i mass from Kilborn et al. (2009) scaled to the distance of 29 Mpc assumed here. Column 6. H i mass re-measured by us using the HIPASS data (Barnes et al., 2001). Notes (a) Kilborn et al. (2009) associate the H i detection GEMS_IC1459_9 with the three galaxies IC 1459, IC 5264 and 2MASX J22571092-3640103. Higher resolution H i images by Walsh et al. (1990) and Oosterloo, Morganti & Sadler (1999) show that part of this gas belongs to IC 5264 while the rest is distributed in the intra-group medium. (b) This galaxy is outside the velocity range covered by Kilborn et al. (2009) and therefore no (H i) comparison is possible. (c) The source is spatially resolved in the HIPASS data, and the H i mass value is estimated by fitting a 2D elliptical Gaussian to the object. (d) Kilborn et al. (2009) associate the H i detection GEMS_IC1459_7 with the two galaxies NGC 7418A and 2MASX J22571092-3640103. Based on higher resolution H i images by Walsh et al. (1990) and Oosterloo, Morganti & Sadler (1999) we associate all the H i with NGC 7418A.
The WALLABY survey will make use of the wide-field capabilities of ASKAP to image H i in galaxies at across 3/4 of the sky in just one year of observing time (Koribalski, 2012). The key advantage of ASKAP over traditional radio interferometers is that it is equipped with phased-array feeds (e.g., Hay & O’Sullivan, 2008). These allow observers to simultaneously form multiple beams on the sky and, therefore, observe a much larger field of view than possible with feed horns. Leading up to WALLABY we have carried out a number of commissioning H i observations with the ASKAP prototype – the Boolardy Engineering Test Array. This consists of 6 ASKAP antennas equipped with first-generation phased-array feeds ( K at 1.4 GHz), and allows us to form 9 simultaneous dual-polarisation beams on the sky. We refer to Hotan et al. (2014) for details on this system.
In this paper we study the H i content of the galaxy group IC 1459 using ASKAP data. We detect H i in eleven galaxies and are able to resolve their H i morphology and kinematics down to a column density of cm-2 over a deg2 field of view, with a resolution of arcmin on the sky and km s-1 in velocity. Below we summarise the main properties of IC 1459 (Sec. 2), describe the radio observations and data reduction (Sec. 3), discuss the H i content of galaxies in the group (Sec. 4) and summarise our findings (Sec. 5).
2 The galaxy group IC 1459
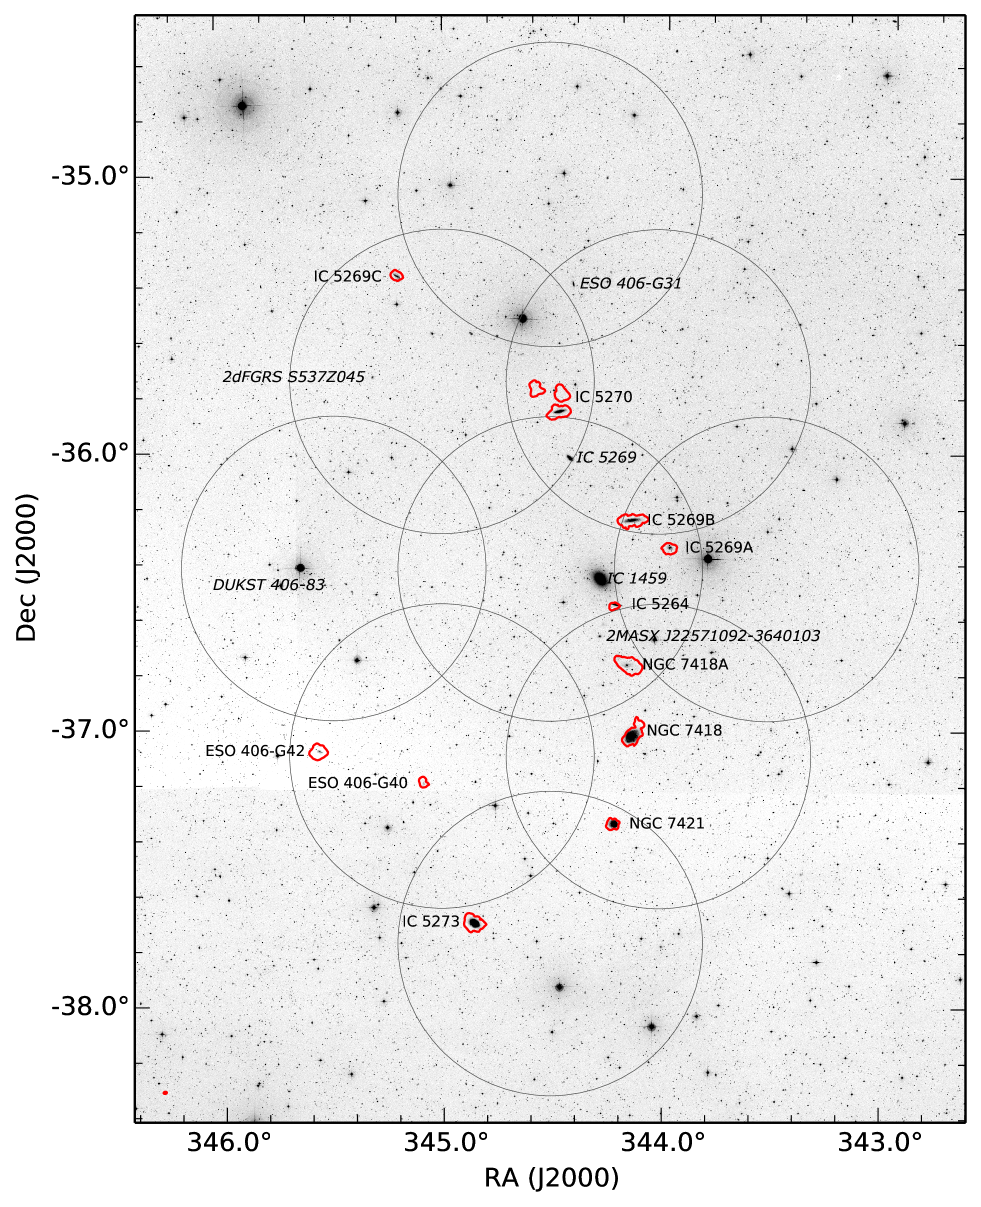
IC 1459 is a loose galaxy group hosting ten bright galaxies of mostly late morphological type (Brough et al., 2006). It is named after its central, luminous early-type member, which has a distance of 29 Mpc (Blakeslee et al., 2001; Tonry et al., 2001). The group is part of the larger-scale Grus cluster – a loose over-density hosting mostly spirals (Aaronson et al., 1981). A number of additional, fainter galaxies might be associated with IC 1459 based on their recessional velocity (e.g., Kilborn et al., 2009). Table LABEL:tab:memb lists all 17 galaxies brighter than mag and with recessional velocity below 4000 km s-1 within the field of view of our observations. Fig. 1 shows an image of the group. With the exception of IC 5269A, all galaxies are within from the central early-type IC 1459, where km s-1 is the group velocity dispersion (Brough et al., 2006). We adopt the same distance of 29 Mpc for all galaxies in the Table but note that IC 5269A may be in the background (its distance is 37 Mpc according to Springob et al. 2009).
The diffuse intra-group medium of IC 1459 is detected in X-rays (Osmond & Ponman, 2004). This dense medium should create an environment hostile to the survival of H i in the group. Yet IC 1459 is dominated by gas-rich, blue spirals. This suggests that the group may be in a relatively early stage of its assembly. Along the same line, there appear to be kinematically distinct subgroups as the 5 southernmost galaxies in Table LABEL:tab:memb all have recessional velocity below that of the central early-type (ESO 406-G40, ESO 406-G42, IC 5273, NGC 7418, NGC 7421). The observation of H i in the group could help clarify to what extent its members are interacting with one another as well as with the group’s gravitational potential and gaseous medium.
Kilborn et al. (2009) analyse the H i content of IC 1459 using the Parkes telescope as part of their study of galaxy groups in the GEMS sample (Osmond & Ponman, 2004). They report 18 H i detections over a field – all unresolved by the arcmin Parkes beam and all with an optical counterpart. They also find that galaxies in the group have fairly typical H i mass for their morphology, suggesting that gas removal in the group is not significant. In contrast with this result, an earlier study by Sengupta & Balasubramanyam (2006) based on shallower data from the H i Parkes All Sky Survey (Barnes et al., 2001) finds that the group members IC 5264 (a dusty early type), IC 5269B, IC 5269C, NGC 7418 and NGC 7421 (all late types) are H i deficient. This disagreement is most likely due to the large uncertainty on the H i deficiency of individual galaxies. More precise indications about the occurrence of gas removal in IC 1459 may come from the resolved study of the H i morphology with interferometry. This has been done for a few galaxies in the group.
Ryder et al. (1997) discuss signatures of ram pressure stripping in NGC 7421 using an H i image obtained with the Australia Telescope Compact Array (ATCA). They also mention (but do not show) the warped appearance of the H i disc of NGC 7418. Interestingly, data taken with both the Very Large Array (Walsh et al., 1990) and the ATCA (Oosterloo, Morganti & Sadler, 1999) reveal the presence of low-column-density ( cm-2), intra-group H i near the central galaxy IC 1459. This gas may have been lost by one of the spirals as it travelled across the group and could be related to the disturbed appearance of the early-type galaxy itself – it exhibits twisted isophotes (Williams & Schwarzschild, 1979), a counter-rotating stellar core (Franx, Illingworth & Heckman, 1989) and low-surface-brightness spiral-like features in deep optical imaging (Malin, 1985, see http://ftp.aao.gov.au/images/deep_html/i1459_gr_d.html). This galaxy also hosts an active galactic nucleus charactertised by two symmetric radio jets ( Jy at 1.4 GHz; Tingay & Edwards 2015), whose activity may have been triggered by the same events that gave the galaxy its peculiar morphology and kinematics. This body of evidence indicates that at least some interaction between galaxies is occurring within the group.
Finally, and although not the main focus of their respective articles, both Walsh et al. (1990) and Oosterloo, Morganti & Sadler (1999) show H i images of IC 5264, IC 5269B and NGC 7418A. The image of Oosterloo, Morganti & Sadler (1999) also includes IC 5269A. IC 5269B is imaged in H i by Sengupta, Balasubramanyam & Dwarakanath (2007), too, using data taken with the Giant Metrewave Radio Telescope. Among these systems, only NGC 7418A shows a disturbed gas morphology.
The field of view of the H i images mentioned above is too small to include other galaxies in the group. To the best of our knowledge, this paper is the first to show the H i morphology of ESO 406-G40, ESO 406-G42, IC 5269C, IC 5270, IC 5273 and NGC 7418.
3 Observations and data reduction
3.1 Beam forming and observations
We observe IC 1459 for a total of 30 h with ASKAP. This integration is divided into three individual observations of h carried out on 28 August, 2 September and 10 September 2014, respectively. Observations are performed at night. They cover the frequency range 1.223 to 1.527 GHz. This 304 MHz band is divided into 16,416 contiguous channels of width kHz, corresponding to km s-1 for H i at .
We distribute the 9 dual-polarisation beams available with ASKAP as shown in Fig. 1. This footprint is chosen to include as many known H i systems as possible. The spacing between beams is ( percent of the beam FWHM at 1.4 GHz). This is smaller than the spacing planned for future surveys, which will tile the field of view of ASKAP with 36 beams. The adopted spacing delivers a more uniform noise level across the observed field.
Beams are formed by computing a set of complex weights before the first and the third observation. The second observation uses the same beam weights as the first one. Briefly, for each of the 9 beams we position the Sun at the centre of the beam, observe it for 2 minutes and calculate the complex weights which give the maximum signal-to-noise ratio (S/N) at the beam centre, referenced to a noise measurement with the dish pointing south of the Sun. This calculation is performed in 64 1-MHz-wide channels distributed over the 304 MHz bandwidth and unevenly separated by an interval of 4 or 5 MHz. We refer to Hotan et al. (2014) for more details.
3.2 Bandpass and gain calibration
For the purpose of this work we reduce and analyse only 1,000 channels in the frequency range 1.4025 to 1.4210 GHz (18.5 MHz bandwidth). Data within this frequency range are essentially free from radio frequency interference, and flagging with a high amplitude threshold is sufficient to remove the few bad visibilities.
We reduce the data using the MIRIAD package (Sault, Teuben & Wright, 1995). In order to calibrate the bandpass and set the flux scale we observe PKS B1934-638 at the centre of each beam before each 10-h observation. We integrate 15 min per beam (135 min total). We calibrate each observation separately and assume that the bandpass does not vary during the 10 hours.
For each 10-h observation and each beam we calibrate the antenna-based gain phases as a function of time in two steps. First, we calibrate with a sky model built from the NRAO VLA Sky Survey (NVSS) image of the field (Condon et al., 1998). We construct the sky model by applying the ASKAP beam response at the appropriate position of the NVSS image. In doing so we assume a Gaussian beam with FWHM of at 1.4 GHz. The sky model consists of all pixels above in the resulting image. We treat these pixels as clean components and calibrate the gains on a time interval of 30 minutes. This initial calibration is sufficient to produce a reasonably good continuum image. In the second step of our procedure we clean this image and use the clean components to self-calibrate the gain phases on a time interval of 1 minute. The calibrated data are imaged and cleaned again, resulting in the final continuum image.
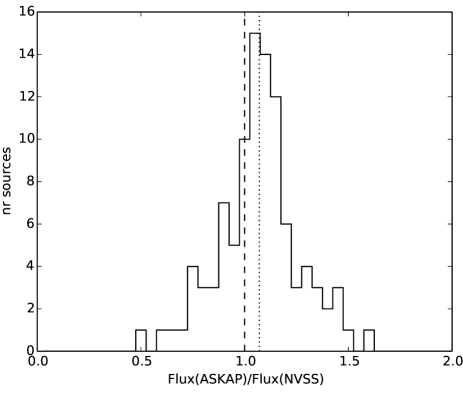
We evaluate the quality of our calibration/imaging procedure by comparing a linear mosaic formed with all single-beam, 10-h continuum images to NVSS. We build the continuum mosaic making the same assumptions about the ASKAP beam shape as above, and giving all images equal weights. (We describe a more accurate mosaicking method in Sec. 3.3 when discussing the H i mosaic.) The comparison with NVSS allows us to test the combined effect of our assumptions about the beam shape and size, which we implicitly take to be identical for all 9 beams on all 6 antennas and to be constant with time. The astrometry of our continuum mosaic is tied to that of NVSS by our gain calibration strategy (see above). Therefore, the good positional match between NVSS and ASKAP sources (a few arcsec) is expected. A more interesting comparison is that between the ASKAP and NVSS peak fluxes (Fig. 2). We find an average ASKAP-to-NVSS peak flux ratio of 1.07. The standard deviation is . This scatter is likely to reflect the limitations of our assumptions about the beams. However, it is comparable to the typical uncertainty on the H i mass of distant galaxies and, therefore, it has no significant impact on this work.
3.3 H i imaging
For each 10-h observation and each beam we obtain a spectral-line dataset by subtracting the clean components of the final continuum image from the calibrated visibilities. We subtract any remaining continuum emission from the visibilities using the MIRIAD task UVLIN. We fit a linear function excluding the central third of the band, which corresponds to a recessional velocity range of to km s-1 for the H i line.
We image H i in each beam by gridding all three 10-h continuum-subtracted visibility sets onto the same uv grid before Fourier transforming. We make H i cubes with a channel width of 8 km s-1, and apply natural weighting to obtain the maximum sensitivity to low-column-density H i emission. The large difference in baseline length between the shortest and the second-shortest baseline (37 m vs 144 m; Hotan et al., 2014) results in a natural point spread function (PSF) with high, broad sidelobes. This makes cleaning difficult, and for this reason we also make natural-weighted H i cubes excluding the shortest baseline. This lowers the number of baselines from 15 to 14, increasing the noise level in the resulting cubes by just a few percent. However, the PSF area is times smaller and, therefore, the column density sensitivity is worse by a similar factor. We base our study of the IC 1459 galaxy group on the latter cubes, although we inspect visually the cubes obtained including the 37-m baseline to look for additional faint, diffuse H i emission (see Sec. 4).
For each beam we construct a clean mask by selecting bright voxels in the H i cube smoothed with a circular Gaussian filter with FWHM of 1 arcmin and a Hanning filter of width 5 channels. We clean the H i cubes within these masks down to the r.m.s. noise in the 9 individual cubes ( mJy beam-1). We finally restore the clean components with an elliptical Gaussian PSF with major- and minor axis FWHM of arcsec and arcsec, respectively, and . The formal column density sensitivity of these cubes is cm-2 within 16 km s-1.
The 9 deconvolved H i cubes are combined to form the final H i mosaic cube. In standard mosaicking, deconvolved cubes (or images) are combined by linearly weighting each pixel by the inverse of the variance (e.g., Cornwell, 1988). Under the assumption of independent cubes, this method minimises the noise level in the mosaic. However, cubes created using data from phased-array feeds are not necessarily independent and a more general approach is needed. The mosaic with minimum noise level is given by:
| (1) |
where for each position in the cube, I and B are matrices representing the cubes to be mosaicked and the beams, respectively, and C is the image-plane noise covariance matrix (in our case ). This expression is equivalent to the traditional inverse-variance weighting if C is diagonal.
As above, we assume that the beams are Gaussian with independent of frequency within the 18.5 MHz band under consideration, and truncate them at a response level of 25 percent. Similarly, we assume that C does not depend on frequency. We calculate C separately for 50 channels devoid of H i emission in the individual cubes, and take a median across frequency. Under these assumptions, we obtain the frequency-independent mosaic noise image:
| (2) |
We measure correlation coefficients of 0.13 to 0.20 for pairs of adjacent beams, which are separated by (see Sec. 3.1). The variation from pair to pair may indicate that the beams are not circularly symmetric. The correlation is negligible for all other beam pairs. The noise level in the final mosaic H i cube is mJy beam-1 percent over a deg2 field. This is consistent with the K reported by Hotan et al. (2014). The noise level remains below twice this value within deg2 in the mosaic H i cube. Using the more common inverse-variance weighting instead of Eq. 1 would result in a mosaic with r.m.s. noise level mJy beam-1 higher in the inner part of the field.


4 H i in the IC 1459 group
4.1 H i source finding
We search for H i in the final mosaic cube using the SoFiA source-finding package (Serra et al., 2015). In order to take into account noise variations within the H i cube, we provide an input weights image equal to the inverse of the noise image obtained with Eq. 2, and we let SoFiA remove noise variations along the frequency axis. We use the smooth+clip source detection algorithm, which smooths the input (weighted) cube with a set of filters and detects emission above the required threshold after each smoothing step. In this case we smooth the cube on the sky and/or in velocity using, respectively, a Gaussian filter of FWHM = 3 pixels (the pixel size is 15 arcsec) and a box filter of width 3, 5, 9, 15 and 23 channels (the channel width is 8 km s-1), and adopt a detection threshold of .
We merge detected voxels into objects using a merging radius of 1 pixel and 3 channels. We reject objects with linear size smaller than 3 pixels and spanning less than 5 channels, and apply the Serra, Jurek & Flöer (2012) algorithm to reject detections less reliable than 99 percent. Finally, we dilate the mask of all reliable detections to recover their total H i flux. Mask dilation stops if the total source flux grows by less than 2 percent, resulting in a typical dilation of 2 pixels in each channel.
All the above processing is performed within SoFiA. We refer the reader to the paper describing this software package (Serra et al., 2015) for details on its working.
4.2 Mass, morphology and kinematics of the detected H i
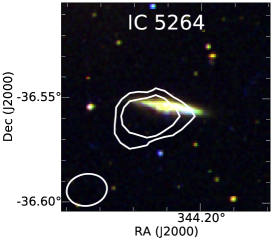
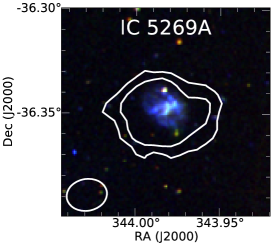
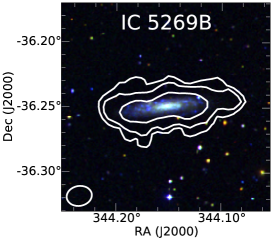
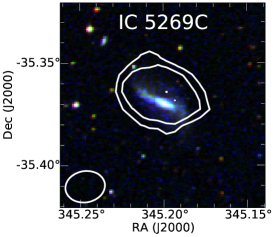
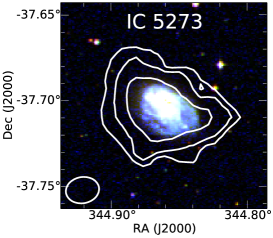
We detect H i in eleven galaxies. We show all detections in Fig. 1, where red contours represent H i at a column density of cm-2. As shown in the figure, we detect two H i clouds near the disc of IC 5270. The clouds are within a few arcmin north, and in the same recessional velocity range, of IC 5270. We detect an H i cloud at the north-west edge of NGC 7418, too. These two galaxies are of particular interest and we discuss them in detail in Sec. 4.3. Here we describe the other nine objects.
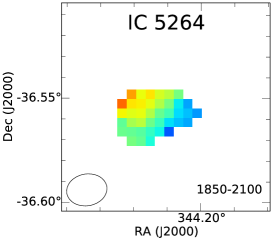
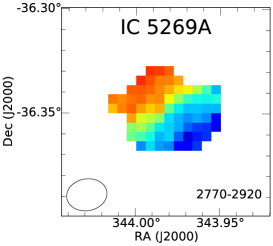
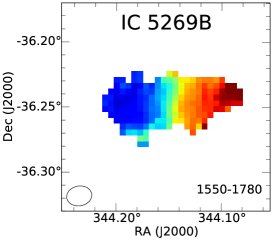
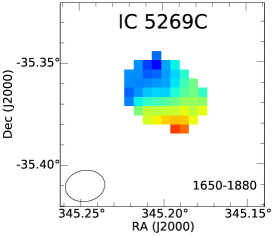
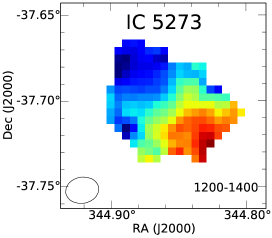
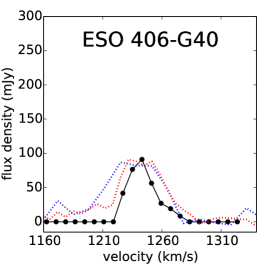
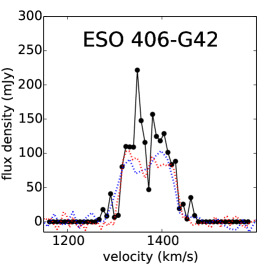
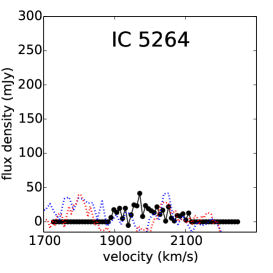
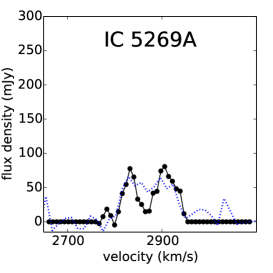
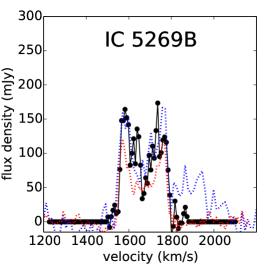
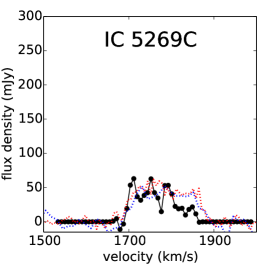
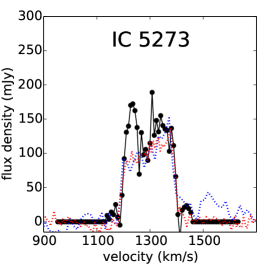
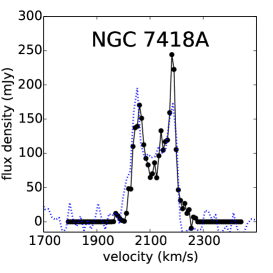
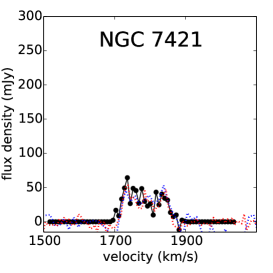
We show the H i images, velocity fields and integrated spectra of these nine detections in Figs. 3, 4 and 5 respectively. In the latter figure we also compare the ASKAP spectra to those obtained using the Parkes telescope as part of HIPASS (Barnes et al., 2001) and by Kilborn et al. (2009). Overall, the agreement between the ASKAP and Parkes spectra is good. This is confirmed in Table LABEL:tab:memb, where we compare the H i masses measured from the different datasets. The uncertainty on the ASKAP H i mass is obtained by summing in quadrature the 20 percent flux uncertainty caused by our limited knowledge of the formed beams’ shape (Sec. 3.2) and the uncertainty related to the presence of noise in the H i cube. For each detection, we estimate the latter term by placing the 3D mask produced by SoFiA at random positions in the mosaic cube, and measuring the scatter in the resulting distribution of H i mass values. This is typically percent of the source H i mass. The agreement between the ASKAP and Parkes H i masses is good within the errors.
As shown in Table LABEL:tab:memb, we fail to detect one previously known H i source: DUKST 406-83. The total H i flux and line width of this galaxy are Jy km s-1 and km s-1, respectively (Kilborn et al., 2009). This would imply an average flux density of mJy beam-1 across the H i profile ( per channel over ten channels in our cube) if the source is unresolved by the PSF of our H i cube. If the emission is resolved on the sky (within individual channels) the signal-to-noise ratio will be even lower. Visual inspection of the ASKAP H i cube at the location of DUKST 406-83 shows emission at the level in 4 consecutive channels at the galaxy’s recessional velocity – too faint to be detected reliably with our source-finding strategy (Sec. 4.1).
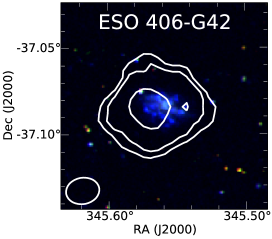
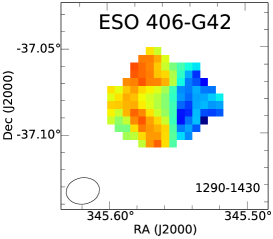
Excluding IC 5270 and NGC 7418 – which we discuss in Sec. 4.3 – the brightest sources in the ASKAP H i mosaic cube are ESO 406-G42, IC 5269B, IC 5273 and NGC 7418A. These objects have an H i mass of a few times M⊙ and a fairly typical H i spectrum. Among them, ESO 406-G42 stands out as one in relatively poor agreement with the Parkes spectra. Its H i velocity field appears noisy, too. This is explained by the position of this galaxy close to the edge of the observed field, in a region where the noise is percent higher than in the inner region of the mosaic. Some discrepancy between ASKAP and Parkes spectra can also be seen at the high-velocity end of the H i spectra of IC 5269B and IC 5273. In IC 5269B the emission at km s-1 recorded by the HIPASS spectrum is caused by confusion with H i in IC 5270. This emission is not visible in the spectrum from Kilborn et al. (2009) because they use a smaller aperture. In IC 5273 visual inspection of the HIPASS cube suggests that the emission at km s-1 is likely to be a noise peak, possibly combined with a non-flat spectral baseline. This emission is not detected in the spectrum of Kilborn et al. (2009).
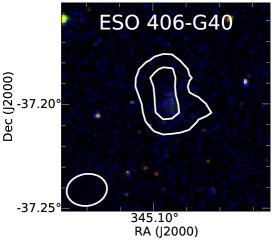
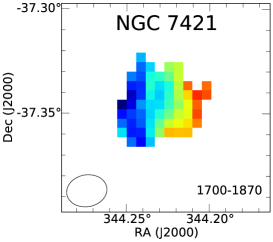
Other galaxies in Figs. 3 to 5 have an H i mass of M⊙ or less, and significantly lower S/N. This is reflected in the quality of their H i images and velocity fields. Yet, the agreement with the Parkes spectra is good even for very faint objects such as ESO 406-G40, IC 5269A, IC 5269C and NGC 7421. Some slight differences are visible for ESO 406-G40 and IC 5269C. In the former the ASKAP spectrum is narrower than the Parkes spectra. Following visual inspection of the ASKAP cube, the most probable explanation is that the ASKAP data miss some low column density H i emission at velocities away from systemic. An additional effect is that the ASKAP velocity resolution is times better than that of the Parkes data. This would be noticeable in particular for a narrow spectrum such as that of ESO 406-G40. In IC 5269C the optical disc is warped, and we seem to be missing the low-column-density, red-shifted, southern H i end of the warp. This galaxy is close to the edge of the mosaic, where the noise is higher than in the inner regions.
The most extreme case among the faint H i sources is IC 5264, as can be seen from the integrated spectrum in Fig. 5. This galaxy is nearly edge-on and, therefore, the low H i flux is spread over a large velocity range, km s-1 in our data. As a result, the peak H i emission in the ASKAP cube is . The ASKAP H i velocity range of IC 5264 is consistent with that shown by Walsh et al. (1990, km s-1) and with the H i spectrum that we obtain by reducing and imaging the ATCA data of Oosterloo, Morganti & Sadler (1999, ATCA project code C530). The detection of such faint, edge-on objects in future large surveys will require the use of multi-scale automated source-finding similar to the one used here (Sec. 4.1), as well as H i cubes relatively free from artefacts.
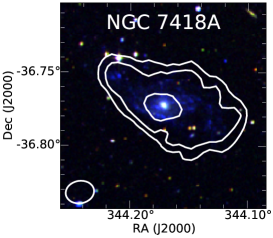
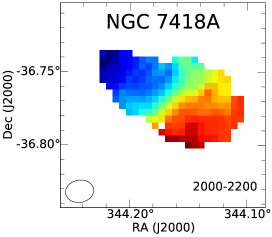
Our data show hints of a disturbed H i morphology in NGC 7418A, whose asymmetric H i disc follows the shape of the low surface brightness, extended, clumpy optical star-forming disc with prominent spiral arms. Thilker et al. (2007) classify it is as “mixed-type extended UV disc”, i.e., an object exhibiting “a large, blue low-surface-brightness zone and structured UV-bright complexes at extreme galactocentric distances beyond the traditional star-formation threshold”. The proximity of NGC 7418A to the (also disturbed) early-type central galaxy IC 1459 suggests that the two may have interacted recently. The intra-group H i detected by Walsh et al. (1990) and Oosterloo, Morganti & Sadler (1999) north of NGC 7418A may have been removed from this galaxy during such interaction. Alternatively, NGC 7418A may have recently accreted gas from this diffuse structure, and the faint, clumpy star formation in its outer disc may have been triggered by such accretion.
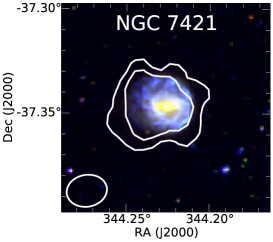
Another galaxy that may be undergoing some interaction with the group environment is IC 5273. Its H i morphology is suggestive of gas near the disc edge being pushed north-west relative to the stellar body. However, the signal in the gas disc outer regions is very low, and deeper, higher-resolution data would be needed to clarify the situation. Whether or not IC 5273 is losing some of its gas to the intra-group medium, we note that some ram-pressure stripping is definitely happening in this group, as demonstrated by Ryder et al. (1997) for NGC 7421. Their ATCA data show that H i at a column density below cm-2 is clearly being pushed off the galaxy in a eastward direction, consistent with the compressed, star-forming west side of the optical disc (Fig. 3). The column density sensitivity of our data is not sufficient to study this object in more detail, but the slight offset between H i and optical emission visible in Fig. 3 is in agreement with the deeper ATCA image.
Finally, the other bright and well-resolved galaxy in our data, IC 5269B, does not show any clear sign of a disturbed H i morphology; and the slight offset between H i and stellar body in ESO 406-G42 and IC 5264 is most likely due to the low S/N.
4.3 H i clouds in IC 5270 and NGC 7418
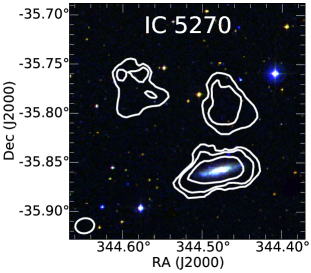
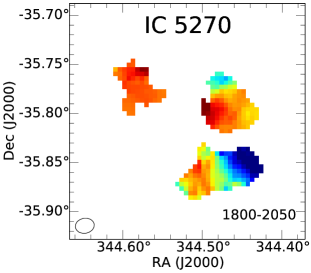
The most interesting result of these observations is the detection of a few H i clouds in the proximity of IC 5270 and NGC 7418 (Figs. 1 and 6). In the former we detect two clouds. The brightest of the two is arcmin north of IC 5270 and contains M⊙ of H i. The second cloud is arcmin north-east of IC 5270 and its H i mass is M⊙. The clouds account for of the total H i mass associated with IC 5270 in the ASKAP data (Table LABEL:tab:memb).
Available images at ultraviolet (GALEX), optical (DSS) and infrared (WISE) wavelengths do not reveal any bright counterparts to these H i clouds. There are a few, very faint GALEX catalogued sources within arcmin of both clouds, but their association with the H i is not obvious. The main limitation is that the total integration time of the combined far- and near-UV GALEX image is just a few hundred seconds. A much deeper observation is available for the group central region but IC 5270 is just outside this field. Similarly, DSS optical imaging is not very sensitive, and the deep optical image made by Malin (1985) stops just south of IC 5270. Therefore, while we find no obvious stellar counterpart, deeper images may be necessary to definitively establish that the H i clouds are not gas-rich dwarf neighbours of IC 5270.
Another possibility is that the clouds are truly “dark”, and are the densest clumps of a larger, low-column-density H i structure – possibly made of H i stripped from IC 5270. Star-less clouds with a similar H i mass are known to exist around other galaxies, and our detections would not be exceptional in this respect (e.g., Kilborn et al., 2006; Oosterloo et al., 2007). These clouds are often found in the presence of other signs of tidal interaction, which we may not be able to see in existing, shallow images of IC 5270 (e.g., Koribalski, Gordon & Jones 2003; English et al. 2010; Serra et al. 2013; Lee-Waddell et al. 2014; for a simulations perspective see, e.g., Bekki et al. 2005). Some indications in favour of this hypothesis come from a joint analysis of ASKAP and HIPASS data.
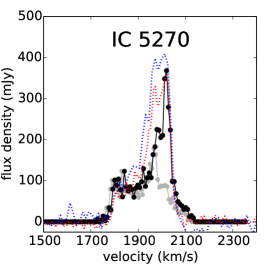
Firstly, with the knowledge of our ASKAP results, the detection of the clouds becomes clear also in the HIPASS data. The HIPASS detection associated with IC 5270 is spatially resolved and extended towards the north-east. An elliptical Gaussian fit to the H i image of this source returns a central position which is offset from the optical position of IC 5270 by 2.6 arcmin. This offset is significantly larger than for all other HIPASS sources in the field, which match the optical position of their host galaxy to better than 1 arcmin (in agreement with the distribution of offsets between optical and HIPASS positions presented for larger samples by Koribalski et al. 2004 and Wong et al. 2009). Furthermore, the HIPASS spectrum is in good agreement with the sum of the ASKAP spectra of IC 5270 and the two clouds, as shown in Fig. 6. In that figure we also show the ASKAP spectrum of IC 5270 alone (grey line) – something that we can only do thanks to the higher angular resolution of these data. The obvious conclusion is that the H i clouds are responsible for the strong peak above 1900 km s-1, which gives the spectrum its unusually asymmetric appearance. While the Parkes data alone were not sufficient to unambiguously resolve the clouds from H i in IC 5270 on the sky or in velocity, the new ASKAP data allow us to interpret unambiguously the shape of the HIPASS spectrum.
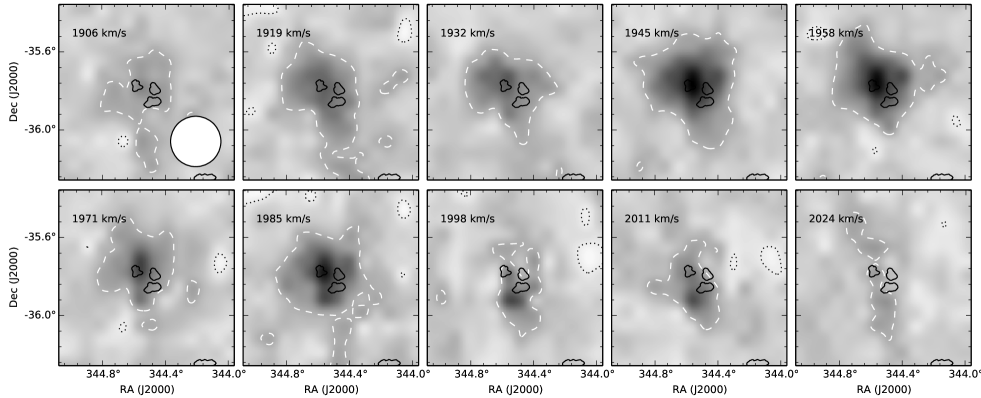
Further insight comes from the observation that the HIPASS spectrum contains some additional H i emission missing from the ASKAP spectrum at velocities between 1900 and 2000 km s-1 (Fig. 6). What is the nature of this emission, and does it tell us anything important about this system? We investigate this aspect by convolving and regridding the ASKAP cube to the resolution and coordinate grid of the HIPASS cube, and subtracting the former from the latter111A possible caveat in this procedure is that we assume the HIPASS PSF to be Gaussian. In fact, the PSF is not exactly Gaussian, and its shape depends on the S/N and shape of the H i source (Barnes et al., 2001).. We show channel maps of the residual cube in Fig. 7. Despite the low angular resolution, the figure reveals that the excess HIPASS emission is clearly located outside the main body of IC 5270. This emission must have a column density below cm-2, else it would have been detected in the ASKAP cube. We conclude that the H i clouds detected by ASKAP are just the densest clumps of a diffuse, extended distribution of H i, which according to the Parkes spectrum should contain an additional M⊙ of gas.
We note that at least part of this faint, diffuse H i emission is detected by the shortest baseline in our observation (37 m), and is visible in the natural-weighted cube made including this baseline. However, cleaning this emission proves extremely challenging because of the high, broad PSF sidelobes (see Sec. 3.3). The full ASKAP will sample the inner regions of the plane in a much more complete way and will therefore be able to image such emission with relative ease.
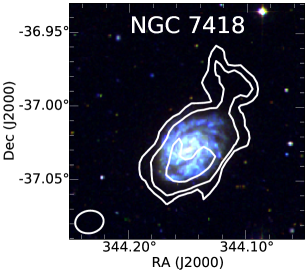
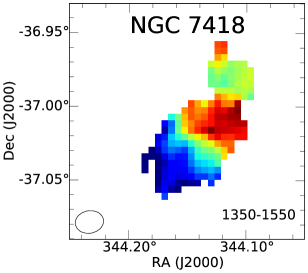
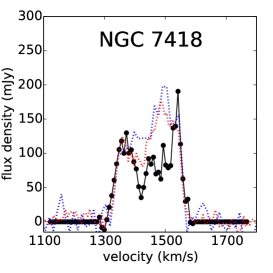
The other galaxy where we detect an H i cloud is NGC 7418. The H i disc of this object has similar size as the stellar disc, and we detect the cloud at the disc’s north-west edge (Fig. 6). The cloud is clearly a separate gas system as it is kinematically distinct from the disc rotation. It hosts M⊙ of H i, about 13 percent of the total, and its velocity is close to systemic. As in the case of IC 5270, we find no obvious stellar counterpart to the H i cloud in available GALEX, DSS and WISE images. However, in this case the GALEX image has a relatively long exposure ( s), and no stellar counterpart is visible in the deep optical image by Malin (1985) either. This suggests that the cloud is not a dwarf companion of NGC 7418.
Similar to the case of IC 5270, the Parkes spectrum of NGC 7418 shows some excess emission relative to the ASKAP spectrum (see velocities between 1400 and 1500 km s-1 in Fig. 6), and the HIPASS detection is resolved by the 15.5 arcmin PSF. Therefore, it is possible that the H i cloud of NGC 7418, too, is embedded in an underlying, low-column-density gas distribution. Observations with better H i column-density sensitivity would be needed to explore this possibility in more detail and to investigate the connection between this cloud and the diffuse intra-group H i detected further north by Walsh et al. (1990) and Oosterloo, Morganti & Sadler (1999).
5 Summary and conclusions
We present H i imaging of the IC 1459 galaxy group obtained with six ASKAP antennas equipped with phased-array feeds. We detect H i in 11 galaxies down to a column density of cm-2 within a field of deg2, with a resolution of arcmin on the sky and km s-1 in velocity. These are the first resolved H i images for 6 of the 11 detections.
Our data reveal the presence of a M⊙ H i cloud in the proximity of NGC 7418 and of two M⊙ clouds around IC 5270. The former amounts to percent of the total H i associated with NGC 7418. The two clouds around IC 5270 make up of the total H i mass associated with this galaxy by low resolution H i observations, and explain the asymmetric Parkes H i spectrum of this object. Based on a comparison between ASKAP and HIPASS data we conclude that the clouds around IC 5270 are the densest clumps of a larger H i distribution below the column density sensitivity of the ASKAP data. We estimate this diffuse gas system to contain M⊙ of gas in addition to the mass of the two clouds. The cloud around NGC 7418, too, may be part of a larger distribution of low-column-density gas.
The detection of intra-group H i nearby IC 5270 as well as NGC 7418 adds to the body of evidence suggesting significant interaction between galaxies and their environment in the IC 1459 galaxy group. Previous results include the detection of intra-group, low-column-density H i between the early-type IC 1459 and the peculiar NGC 7418A (Walsh et al., 1990; Oosterloo, Morganti & Sadler, 1999) and evidence of ram-pressure stripping in NGC 7421 (Ryder et al., 1997). Altogether, the total mass of H i residing outside galaxies in this group is several times M⊙. This is at least 10 percent of the H i mass contained inside galaxies in the group. This estimate should be seen as a conservative lower limit because of the limited column density sensitivity of our data. Given that we are observing just a short snapshot in the long assembly history of this particular galaxy group, our estimate implies a substantial flow of H i in and out of group galaxies over a period of several billion years.
Overall, these results demonstrate the good performance of phased-array feeds and give a taste of what the full ASKAP will be able to do on much larger areas of the sky. Considering its larger number of antennas, lower and larger number of simultaneous beams, the full ASKAP will be able to reach the same column-density sensitivity of our 30-h observation (inclusive of the shortest baseline) over a 5 times larger area of the sky and with twice the angular resolution in just a few hours. Longer integrations over large areas will make it be possible to measure the mass of H i outside galaxies – and firmly establish or rule out evidence of gas accretion and stripping – for thousands of galaxies like the ones studied here.
Acknowledgments
We acknowledge useful discussions with Phil Edwards and Ron Ekers. The Australian SKA Pathfinder is part of the Australia Telescope National Facility which is funded by the Commonwealth of Australia for operation as a National Facility managed by CSIRO. This scientific work uses data obtained from the Murchison Radio-astronomy Observatory (MRO), which is jointly funded by the Commonwealth Government of Australia and State Government of Western Australia. The MRO is managed by the CSIRO, who also provide operational support to ASKAP. We acknowledge the Wajarri Yamatji people as the traditional owners of the Observatory site. This work was supported by iVEC through the use of advanced computing resources located at The Pawsey Centre. Parts of this research were conducted by the Australian Research Council Centre of Excellence for All-sky Astrophysics (CAASTRO), through project number CE110001020.
References
- Aaronson et al. (1981) Aaronson M., Dawe J. A., Dickens R. J., Mould J. R., Murray J. B., 1981, MNRAS, 195, 1P
- Barnes et al. (2001) Barnes D. G. et al., 2001, MNRAS, 322, 486
- Bekki et al. (2005) Bekki K., Koribalski B. S., Ryder S. D., Couch W. J., 2005, MNRAS, 357, L21
- Binney (1977) Binney J., 1977, ApJ, 215, 483
- Blakeslee et al. (2001) Blakeslee J. P., Lucey J. R., Barris B. J., Hudson M. J., Tonry J. L., 2001, MNRAS, 327, 1004
- Bravo-Alfaro et al. (2000) Bravo-Alfaro H., Cayatte V., van Gorkom J. H., Balkowski C., 2000, AJ, 119, 580
- Brough et al. (2006) Brough S., Forbes D. A., Kilborn V. A., Couch W., 2006, MNRAS, 370, 1223
- Butcher & Oemler (1984) Butcher H., Oemler, Jr. A., 1984, ApJ, 285, 426
- Chung et al. (2009) Chung A., van Gorkom J. H., Kenney J. D. P., Crowl H., Vollmer B., 2009, AJ, 138, 1741
- Condon et al. (1998) Condon J. J., Cotton W. D., Greisen E. W., Yin Q. F., Perley R. A., Taylor G. B., Broderick J. J., 1998, AJ, 115, 1693
- Cornwell (1988) Cornwell T. J., 1988, A&A, 202, 316
- Cowie & Songaila (1977) Cowie L. L., Songaila A., 1977, Nature, 266, 501
- Dressler (1980) Dressler A., 1980, ApJ, 236, 351
- English et al. (2010) English J., Koribalski B., Bland-Hawthorn J., Freeman K. C., McCain C. F., 2010, AJ, 139, 102
- Franx, Illingworth & Heckman (1989) Franx M., Illingworth G., Heckman T., 1989, ApJ, 344, 613
- Gunn & Gott (1972) Gunn J. E., Gott, III J. R., 1972, ApJ, 176, 1
- Hay & O’Sullivan (2008) Hay S. G., O’Sullivan J. D., 2008, Radio Science, 43, n/a, rS6S04
- Hotan et al. (2014) Hotan A. W. et al., 2014, PASA, 31, 41
- Johnston et al. (2007) Johnston S. et al., 2007, PASA, 24, 174
- Johnston et al. (2008) Johnston S. et al., 2008, Experimental Astronomy, 22, 151
- Kereš et al. (2005) Kereš D., Katz N., Weinberg D. H., Davé R., 2005, MNRAS, 363, 2
- Kilborn et al. (2009) Kilborn V. A., Forbes D. A., Barnes D. G., Koribalski B. S., Brough S., Kern K., 2009, MNRAS, 400, 1962
- Kilborn et al. (2006) Kilborn V. A., Forbes D. A., Koribalski B. S., Brough S., Kern K., 2006, MNRAS, 371, 739
- Koribalski, Gordon & Jones (2003) Koribalski B., Gordon S., Jones K., 2003, MNRAS, 339, 1203
- Koribalski (2012) Koribalski B. S., 2012, PASA, 29, 359
- Koribalski et al. (2004) Koribalski B. S. et al., 2004, AJ, 128, 16
- Kreckel et al. (2011) Kreckel K. et al., 2011, AJ, 141, 4
- Lee-Waddell et al. (2014) Lee-Waddell K. et al., 2014, MNRAS, 443, 3601
- Malin (1985) Malin D. F., 1985, in Lecture Notes in Physics, Berlin Springer Verlag, Vol. 232, New Aspects of Galaxy Photometry, Nieto J.-L., ed., pp. 27–32
- Nulsen (1982) Nulsen P. E. J., 1982, MNRAS, 198, 1007
- Oosterloo, Morganti & Sadler (1999) Oosterloo T., Morganti R., Sadler E. M., 1999, in Astronomical Society of the Pacific Conference Series, Vol. 163, Star Formation in Early Type Galaxies, Carral P., Cepa J., eds., p. 72
- Oosterloo & van Gorkom (2005) Oosterloo T., van Gorkom J., 2005, A&A, 437, L19
- Oosterloo et al. (2007) Oosterloo T. A., Morganti R., Sadler E. M., van der Hulst T., Serra P., 2007, A&A, 465, 787
- Osmond & Ponman (2004) Osmond J. P. F., Ponman T. J., 2004, MNRAS, 350, 1511
- Ryder et al. (1997) Ryder S. D., Purcell G., Davis D., Andersen V., 1997, PASA, 14, 81
- Sancisi et al. (2008) Sancisi R., Fraternali F., Oosterloo T., van der Hulst T., 2008, A&AR, 15, 189
- Sault, Teuben & Wright (1995) Sault R. J., Teuben P. J., Wright M. C. H., 1995, in Astronomical Society of the Pacific Conference Series, Vol. 77, Astronomical Data Analysis Software and Systems IV, R. A. Shaw, H. E. Payne, & J. J. E. Hayes, ed., pp. 433–+
- Sengupta & Balasubramanyam (2006) Sengupta C., Balasubramanyam R., 2006, MNRAS, 369, 360
- Sengupta, Balasubramanyam & Dwarakanath (2007) Sengupta C., Balasubramanyam R., Dwarakanath K. S., 2007, MNRAS, 378, 137
- Serra, Jurek & Flöer (2012) Serra P., Jurek R., Flöer L., 2012, PASA, 29, 296
- Serra et al. (2013) Serra P. et al., 2013, MNRAS, 428, 370
- Serra et al. (2012) Serra P. et al., 2012, MNRAS, 422, 1835
- Serra et al. (2015) Serra P. et al., 2015, MNRAS, 448, 1922
- Springob et al. (2009) Springob C. M., Masters K. L., Haynes M. P., Giovanelli R., Marinoni C., 2009, ApJS, 182, 474
- Thilker et al. (2007) Thilker D. A. et al., 2007, ApJS, 173, 538
- Tingay & Edwards (2015) Tingay S. J., Edwards P. G., 2015, MNRAS, 448, 252
- Tonry et al. (2001) Tonry J. L., Dressler A., Blakeslee J. P., Ajhar E. A., Fletcher A. B., Luppino G. A., Metzger M. R., Moore C. B., 2001, ApJ, 546, 681
- Toomre & Toomre (1972) Toomre A., Toomre J., 1972, ApJ, 178, 623
- Verdes-Montenegro et al. (2001) Verdes-Montenegro L., Yun M. S., Williams B. A., Huchtmeier W. K., Del Olmo A., Perea J., 2001, A&A, 377, 812
- Verheijen et al. (2008) Verheijen M. A. W., Oosterloo T. A., van Cappellen W. A., Bakker L., Ivashina M. V., van der Hulst J. M., 2008, in American Institute of Physics Conference Series, Vol. 1035, The Evolution of Galaxies Through the Neutral Hydrogen Window, Minchin R., Momjian E., eds., pp. 265–271
- Verheijen & Zwaan (2001) Verheijen M. A. W., Zwaan M., 2001, in Astronomical Society of the Pacific Conference Series, Vol. 240, Gas and Galaxy Evolution, J. E. Hibbard, M. Rupen, & J. H. van Gorkom, ed., pp. 867–+
- Walsh et al. (1990) Walsh D. E. P., van Gorkom J. H., Bies W. E., Katz N., Knapp G. R., Wallington S., 1990, ApJ, 352, 532
- Williams & Schwarzschild (1979) Williams T. B., Schwarzschild M., 1979, ApJ, 227, 56
- Wong et al. (2009) Wong O. I., Webster R. L., Kilborn V. A., Waugh M., Staveley-Smith L., 2009, MNRAS, 399, 2264