A systematic study of the isothermal crystallization of the mono-alcohol n-butanol monitored by dielectric spectroscopy
Abstract
Isothermal crystallization of the mono-hydroxyl alcohol n-butanol was studied with dielectric spectroscopy in real time. The crystallization was carried out using two different sample cells at 15 temperatures between 120 K and 134 K. For all temperatures, a shift in relaxation times to shorter times was observed during the crystallization process, which is characterized by a drop in relaxation strength. The two different sample environments induced quite different crystallization behaviors, consistent and reproducible over all studied temperatures. An explanation for the difference was proposed on the background of an Avrami and a Maxwell-Wagner analysis. Both types analysis suggest that the morphology of the crystal growth changes at a point during the crystallization. The differences between the cells can be explained by this transition taking place at different times for the two cells.
All liquids can be supercooled Tammann (1925); Kauzmann (1948); Debenedetti (1996). In fact, crystallization rarely takes place exactly at the melting temperature upon cooling, because the crystal nuclei formed dissolve before they grow to a stable size Becker and Döring (1935). Some liquids, like water, crystallize readily at moderate supercooling and need fast quenching below the melting temperature in order to avoid crystallization. Others, like the prototype glass-former glycerol, supercool easily and require a careful protocol to crystallize Yuan et al. (2012). But the true thermodynamic equilibrium state for all supercooled liquids and glasses is unarguably the crystal, and thus crystallization is their eventual inevitable fate.
For many applications the life-time of the glassy or meta-stable liquid state is a key issue and the ability to predict and control crystallization properties is desired. But understanding the crystallization process is also interesting from a fundamental point of view. Crystallization studies are however difficult to carry out in a controlled and reproducible manner, because many factors influence the initiation and course of crystallization, such as sample preparation, thermal history, presence of impurities, container geometry, etc (Rabesiaka and Kovacs, 1961; Yuan et al., 2012; Napolitano and Wübbenhorst, 2006).
Dielectric spectroscopy is a convenient and fairly common probe for studying crystallization kinetics in real time, see e.g. Refs. (Massalska-Arodz et al., 1999; Alie et al., 2003; Adrjanowicz et al., 2010; Dantuluri et al., 2011; Kothari et al., 2014; Sibik et al., 2014). The sign of crystallization is a decrease in intensity of the signal, and the crystal fraction/concentration of the sample is often obtained by assuming that the relaxation strength is proportional to the volume fraction of liquid in the sample Ezquerra et al. (1994); Viciosa et al. (2009); Adrjanowicz et al. (2014). But the microscopic interpretation of dielectric spectra is not straight-forward Kremer (2003), especially when studying a heterogeneous mixture.
We present a thorough dielectric study of the temperature dependence of the crystallization process in n-butanol. Supercooled n-butanol has an intense low-frequency dielectric signal – the so-called Debye-process – characteristic of many monohydroxyl alcohols Böhmer et al. (2014). It also exhibits a slow crystallization process upon reheating after a rapid quench below (Shmyt’ko et al., 2010; Derollez et al., 2013). At 10 K above the glass transition temperature the crystallization can take several days to finish, and at temperatures close to the glass-transition, the crystallization process stops before the sample is fully crystallized Hedoux et al. (2013). These two properties, a large dielectric signal and slow crystallization, makes n-butanol an ideal candidate for monitoring isothermal crystallization in real time by dielectric spectroscopy. Crystallization of n-butanol has previously been studied with x-ray diffraction (Shmyt’ko et al., 2010; Derollez et al., 2013), infrared spectroscopy (Wypych et al., 2007; Hedoux et al., 2013), calorimetric methods (Hassaine and Ramos, 2011), and phase contrast microscopy (Kurita and Tanaka, 2005). However, no systematic study of the temperature dependence and reproducibility of the crystallization kinetics has been reported. We used two different dielectric measuring cells with different geometry and different electrode material in an attempt to disentangle effects that are intrinsic to the sample and effects that are due to macroscopic boundary conditions.
I Experiment and materials
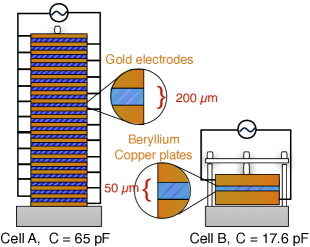
All measurements were carried out in the same experimental set-up (described in detail in Ref. Igarashi et al., 2008), including a custom-built nitrogen cryostat capable of keeping the temperature stable within 50 mK over weeks. Two different sample cells were used. Cell A is a 22-layered gold-plated parallel plate capacitor with 0.2 mm between each set of plates and a geometrical capacitance of 64 pF. Each plate is a semi-circle which can be rotated to overlap each other (identical to the capacitors used in old radios). Cell B is a parallel plate capacitor with circular beryllium-copper plates separated by 50 m sapphire spacers. The cells are sketched in Fig. 1.
The sample n-butanol (, ) was purchased from Sigma Aldrich’s at purity and used without further purification.
The same protocol was followed for each crystallization measurement; a new sample was quenched to 85 K (roughly 25 K below ) and kept at this temperature for (at least) 120 minutes, then heated to the target temperature where the crystallization process was followed. The heating took less than five minutes. Frequency scans were made continuously as soon as heating from 85 K initiated and until no further changes in the spectrum occurred. The frequency range of the scans was adjusted for each temperature to keep the scan as short – and thereby as fast – as possible, while still keeping both and in the frequency window. The sample cells were emptied and cleaned between each measurement.
Isothermal crystallization was followed at 15 different temperatures between 134 and 120 K. The exact temperatures in Kelvin are: 134, 133, 132, 131, 130, 129, 128.5, 127.5, 126, 125, 124, 123, 122.5, 121, 120. The 133 K measurement has only been done with cell A, while the 132 K measurement has only been done with cell B. For reference, a fully crystallized sample was made by quenching to 85 K and reheating to 170 K, and a spectrum was measured at all temperatures included in the study.
II Experimental results and data analysis
II.1 Phenomenological fits of the spectra
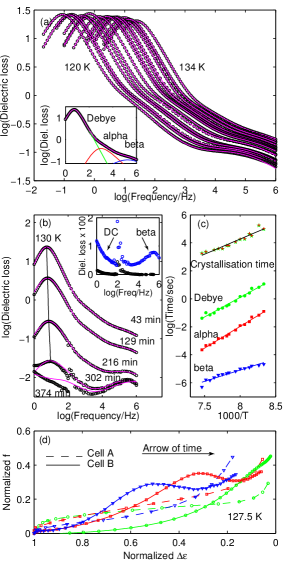
In n-butanol there are three visible processes – Debye, alpha, and beta process – in the measured frequency window, see Fig. 2(a). The crystallization, signaled by a decrease of relaxation strength, also induces a shift in the loss peak for the three processes. To quantify how the crystallization influences each of these processes, we fitted the spectra to a sum of three relaxation processes. Since the processes are not well separated, we aimed at limiting the number of free fitting parameters by the following procedure: First the Debye process is fitted by a Cole-Cole function. The Debye process broadens during the crystallization and thus a pure exponential function would not give a good fit. The result of the Debye fit is then subtracted from the data and the alpha and beta processes are fitted simultaneously as a sum. The beta process is fitted to a Cole-Cole function with a fixed shape parameter, . The alpha process is fitted to a dielectric version of the Extended Bell (EB) model (see Ref. Saglanmak et al., 2010), in which the imaginary part of the dielectric constant is given by:
| (1) |
where is the relaxation strength and is the relaxation time, controls the width of the peak, and gives the high-frequency power law behavior of the alpha peak. This model for the alpha relaxation gives good fits even when the shape parameters are fixed such that only the relaxation strength and relaxation time is fitted. The slope parameter was fixed to Nielsen et al. (2009) and . The Cole-Davidson function resulted in poorer fits, even with the shape parameter varying freely. Thus, we fitted the imaginary part to a total of seven parameters: a relaxation time, , and a relaxation strength, , for each process ( denoting Debye, alpha, or beta), and a broadening parameter for the Debye process.
The procedure gives excellent fits of over the frequency range explored as shown in Fig. 2(a), where the first dielectric spectrum at every annealing temperature is shown as well as the fits resulting from the described fitting procedure. The inset shows a spectrum at 130 K with each of the individual fitted relaxation processes.
The same fitting procedure was applied to the isothermal crystallization spectra to study the temporal evolution of the three processes during crystallization. This is shown in Fig. 2(b) at 130 K using cell B. As the crystallization proceeds the strength of the Debye and alpha relaxation processes decrease continuously to disappear entirely by the termination of the crystallization process. This is also to be expected, since there should be no large-scale rearrangement of the molecules in the crystal. The beta relaxation process, however, remains active by the termination of the crystallization process. The inset of Fig. 2(b) shows the last scan at 130 K together with a measurement of the full crystal at the same temperature, clearly demonstrating that the crystallization process stops before the sample is fully crystallized and that there is still some molecular mobility left. The results from the fitting routine establish the general behavior of the spectra during the crystallization, but we refrain from analyzing the finer details, especially towards the end of the crystallization process, where Debye and alpha process has vanished and the fits become unreliable (the lowest curve in Fig. 2(b)).
Using the relaxation strength, , as an indicator of the degree of crystallinity, we define a characteristic crystallization time as the time the for to decay to half of its initial value. Figure 2(c) shows the crystallization time derived from both Debye and alpha relaxation strength as a function of inverse temperature, and it is evident that the two measures are identical within the accuracy of our measurements.
Along with the crystallization time, we show the relaxation times obtained from the fits to the first (uncrystallized) spectrum. Clearly, the Debye, alpha, and beta processes as well as the crystallization process are all slowed down with decreasing temperature and consequently the different characteristic time scales would all appear to be correlated (at least in this temperature range), but it does not necessarily imply any causation. For the studied temperature span, all the shown time scales are Arrhenius within the noise, although with very different pre-factors.
Focusing now on how the two sample environments influence the crystallization process, we define the relaxation frequency as the inverse of the fitted relaxation times, . The evolution of both the relaxation strength and relaxation frequency differ for the two cells. Fig. 2(d) shows a parameterised plot of the fitted relaxation frequency (normalized to the initial value) as a function of the fitted normalized relaxation strength for each of the three processes from measurements at 127.5 K with both cell A and B. In cell A, there is a shift in the relaxation frequency, , quite early in the crystallization process, then it remains relatively unchanged for all three relaxation processes until an increase sets in again towards the end of the crystallization. In cell B, the shift in relaxation frequency is more gradual. For the Debye process the shift is monotonous, but for the alpha and the beta process the shift displays a non-monotonous behavior. The curve peaks in Fig. 2(d) occurs roughly the same waiting time for the alpha and beta process.
The different progress of the crystallization process for the two cells suggests a macroscopic/mesoscopic rather than microscopic explanation since a slight difference in sample geometries is not expected to affect the behavior of individual molecules.
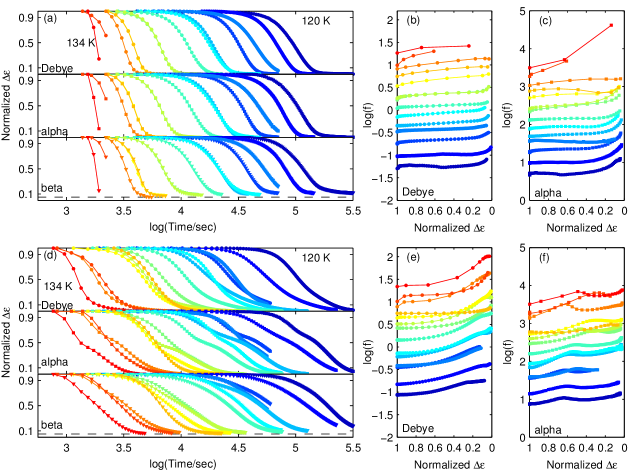
The full set of fitted parameters normalized to the initial value is shown as a function of waiting time in Fig. 3. The colors of the curves indicate the temperature with blue being the lowest (120 K) and red being the highest (134 K). In both cells, lower temperatures lead to longer crystallization times, as was shown in Fig. 2(c).
For cell A (Fig. 3(a)) the fitted relaxation strengths for each of the three processes appear similar, except at long waiting times, where the beta relaxation strength levels off at instead of decaying all the way to zero. The final level for the beta relaxation is marked by a dashed line in the third panel of Fig. 3(a). For cell B (Fig. 3(d)), the Debye and alpha relaxation strengths follow each other until roughly halfway through the crystallization, where a shoulder emerges in the alpha relaxation strength curve, which then proceeds like a two-step relaxation. As in cell A, the beta relaxation strength does not decay to zero and levels off at the same value as for cell A. Comparing Fig. 3(a) and (d), we see that the curves for cell B are significantly more stretched than the corresponding curves for cell B, which means that crystallization proceeds at a consistently slower rate in cell B compared to cell A. Consequently, our definition of crystallization time may give roughly the same for the two cells, however total crystallization time is much longer in cell B.
Figure 3(b+c) and (e+f) show the parameterized plot introduced in Fig. 2(d) for all temperatures, i.e., normalized relaxation frequencies as a function of relaxation strength, but now separating the two cells and the Debye and alpha process. (The relaxation frequency of the beta process is not shown, because it does not vary in a systematic way, making further interpretation unjustified.)
In cell A, the general behavior is that the relaxation frequencies have a slight shift to higher frequencies at the onset of the crystallization, but only increase a little during the remainder of the crystallization. In cell B, the relaxation frequency of Debye and alpha processes do not change in the beginning of the crystallization process, but shifts gradually to higher frequencies. A ’bump’ occurs in alpha relaxation strength around a normalized relaxation strength of , showing that the behavior observed in Fig. 2(d) is general.
The differences between the two cells are thus reproduced for all the studied temperatures. One mesoscopic explanation for the observed difference in the evolution of the relaxation strength and relaxation times for the two cells could be that the two cells induce different kinds of crystal growth.
II.2 Maxwell-Wagner analysis
For heterogeneous material, a difference in the conductivity of the different domains in the material leads to build-up of charges at the interfaces between domains. This gives rise to a polarization effect known as Maxwell-Wagner (MW) polarization Schüller et al. (1995); Kremer (2003).
In the present case the heterogeneity is caused by the formation of crystallites in the sample. As domains of crystal grow in the liquid the dielectric constant for the composite will change. The details of the change will depend on the difference between the dielectric constant of the liquid, , and that of the crystal, , the shape of the crystal domain, and the volume fraction taken up by the crystal.
The two simplest cases of crystal domains growing in the liquid are that of a crystal layer growing from one (or both) of the electrodes, a heterogeneous nucleation picture, and the case of crystal spheres in a liquid matrix, a homogeneous nucleation picture.
In the first case, no approximation is involved in deriving the expression for the composite dielectric constant. The two materials (liquid and crystal) in a layered construction are simply modeled by two capacitors connected in series. Thus the resulting composite dielectric constant is given by
| (2) |
where is the relative thickness of the crystal layer. Since and can be measured independently this model has one free parameter (assuming the distance between the electrodes is fixed, or equivalently that total thickness of crystal and liquid layer is unchanged during crystallization).
Inserting the measured spectrum of (at time before crystallization initiates) and (spectrum of the fully crystallized sample), this model produces a large shift in the peak frequency for even small values of . Thus, the model is unable to capture both the observed decrease in relaxation strength and the shift in peak frequency at the same time, and this scenario alone is not sufficient to explain what we observe.
In the case of crystal domains dispersed in a liquid a mean-field approximation is used to arrive at the composite dielectric constant Wagner (1914)
| (3) |
where is the concentration of the crystal domains. This model also contains a single fitting parameter, . The mean field approximation is only accurate up to (Kremer, 2003), but in the following we allow to go all the way up to 1.
Inserting the measured spectra of and in Eq. 3 does not produce a frequency shift. Consequently, this model cannot account for what we observe either.
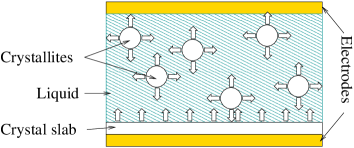
Instead, we propose to combine the two models such that a crystal layer is growing from the electrodes, while spherical crystallites are forming in the remaining liquid, see Fig. 4. This is modeled by combining Eq. (2) and Eq. (3) such that in Eq. (2) is given by the composite dielectric constant from Eq. (3). This model has two parameters: the relative thickness of the crystal layer, , and the concentration of crystal spheres in the liquid, .
Examples of fits to isothermal crystallization spectra for cell A and cell B are shown in Fig. 5(a) and (b), respectively. The fits are focused on the Debye process by only fitting to the points within the two dotted lines. Having two fitting parameters gives sufficient flexibility to account for both the decrease in relaxation strength as well as the change in peak frequency of the Debye peak. However, the combined model does not adequately explain the behaviour of the entire spectrum; it does not capture the behaviour of the alpha and beta relaxation processes during the crystallization or the broadening of the Debye process. Despite these limitations, the models ability to describe the behaviour of the Debye relaxation strength and peak position may be used to shed some light on the observed phenomena.
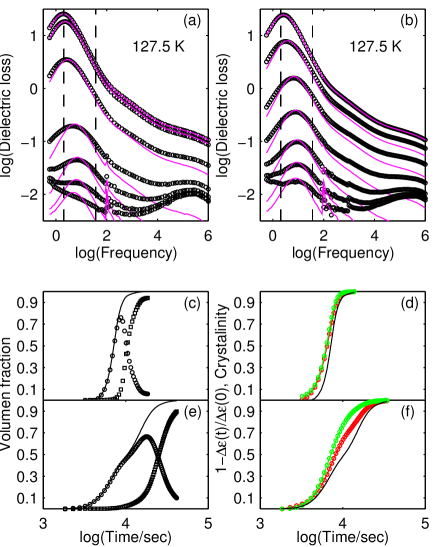
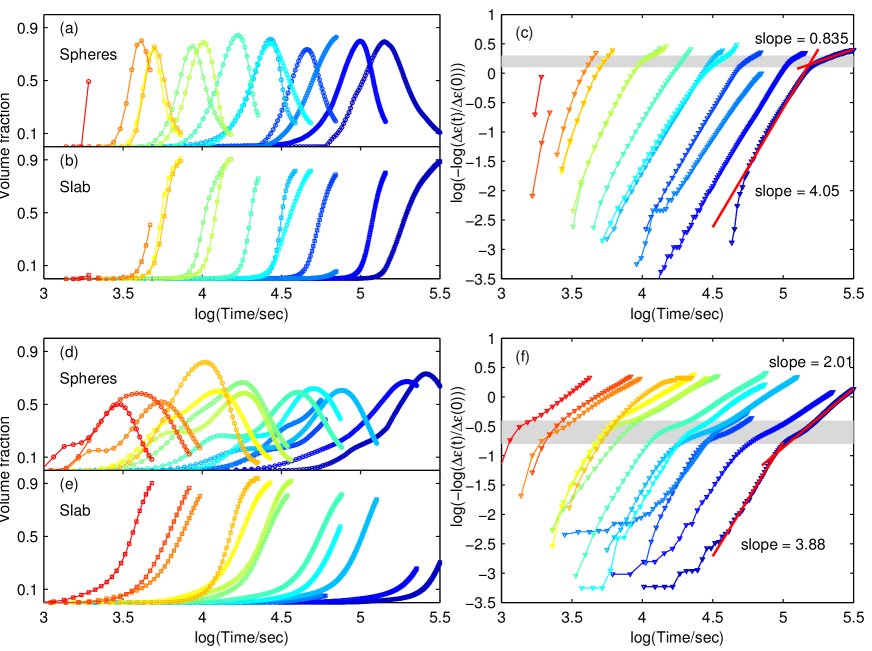
The total crystallized volume fraction according to the model can be calculated as and the volume fraction taken up by the spheres alone as . Figure 5(c) and (e) shows the volume fraction of the crystal layer and the spherical crystallites as well as the total crystal volume fraction. For both cells it seems that the onset of crystallization is dominated by nucleation and growth of crystal spheres, and when a large fraction of the sample has crystallized (80-90%), the slab growth takes over. However, the growth of crystal spheres starts earlier but proceeds at a slower rate in cell B compared to cell A. This difference in crystallization behavior in the two cells that is reproduced at all temperatures (see Fig. 6).
The total degree of crystallinity as calculated from the MW fits is plotted together with the normalized Debye and alpha relaxation strengths for cell A in Fig. 5 (d) and for cell B in Fig. 5(f). Again, the curves are clearly different for the two cells; in cell A Debye and alpha relaxation strengths give almost identical curves that agree qualitatively with crystal fraction obtained in the MW fit, although the relaxation strength decreases faster than crystal fraction initially. In cell B, all three curves starts out in the same way but separates later in the process, where both Debye and alpha relaxation strengths overestimates the degree of crystallinity. The MW crystallinity curve has a kink occurring approximately when there is a bump in the alpha relaxation strength, while this two-step behavior is not clearly seen in the Debye relaxation strength. The behavior of crystallization process at 127.5 K and the MW analysis demonstrated in Fig. 5 is general for all the studied temperatures as can be seen in Fig. 6.
The proposed MW analysis qualitatively and quantitatively agrees with using the decrease of the alpha relaxation strength rather than the Debye relaxation strength as a measure of the crystallinity of the sample. However, neither reflect the fact that sample does not crystallize fully. This is because both the Debye and the alpha process vanish during crystallization, while only the beta process survives. The analysis does not account for that, a fact that is already clear from the fits in Fig. 5(a+b).
II.3 Avrami analysis
Another independent – and more routinely used – way of evaluating the crystal growth is through the Johnson-Mehl-Avrami-Kolmogorov (JMAK) equation originally developed by Avrami (Avrami, 1939, 1940, 1941). In this analysis, the volume fraction taken up by crystallites, is expressed in terms of a growth rate constant , an induction time , and the Avrami parameter as follows
| (4) |
The value of depends on the crystal morphology and crystallization mechanism, but it is not straight forward to interpret the meaning of this parameter. Originally, it was a number between 1 and 4 such that with being the dimensionality of the growth and being a number that represents the nucleation rate. For a constant nucleation rate and if nucleation stops when the crystallization starts. More recently has been found to be a number between 1 and 7 (Viciosa et al., 2009; Dantuluri et al., 2011).
When dielectric spectroscopy is used to study crystallization the common practice is to assume that the alpha relaxation strength roughly corresponds to the degree of crystallinity, , and then use that for the Avrami analysis. Since the MW model also gives some support for the alpha rather than the Debye relaxation strength is expressing the degree of crystallinity in the sample, we will adopt this approach.
One way to obtain an estimate of the parameter is through the Avrami–Mehl–Johnson plot, which plots versus . This procedure avoids fitting Eq. (4) to data and is directly obtained as the slope of the curve. The Avrami-Mehl-Johnson plots for cell A and B is shown in Fig. 6. In both cases, we see a transition from a relatively high value to a low value . This observations suggests a change from higher dimensionality of growth to lower, which is consistent with the MW analysis suggesting a change from spherical to slab growth. Moreover, the data suggest that this transition happens earlier in the crystallization process for cell B compared to cell A, which could explain why the crystallization slows down and takes much longer in cell B.
III Discussion
Both the Debye process and the alpha process vanish during the crystallization, while the beta process survives. Thus we confirm earlier findings that the crystallization process at temperatures near stops before the sample is completely crystallized. Hedoux et al report signs of an aborted or frustrated crystallization process, signaled by a amorphous halo persisting in the x-ray spectra Hedoux et al. (2013). This slow and frustrated crystallization process has also been interpreted as a polyamorph transformation between two meta-stable liquid phases (Dzhonson and Bol’shakov, 2003; Bol’shakov and Dzhonson, 2005; Kurita and Tanaka, 2005; Zgardzinska et al., 2010). Based on the dielectric spectra presented here it is perhaps difficult to distinguish between the two scenarios, but the fact that the structural relaxation peaks disappear entirely combined with the emergence of Bragg peaks as documented in Ref. Hedoux et al. (2013), point to a non-trivial crystallization process as the most obvious explanation for the observations.
It is however interesting that the aborted crystallization is seen in the dielectric spectra as the survival of the beta-process. If we envision the end product as a frustrated crystal, unable to tile space, then the liquid signal – in our case the beta relaxation – could originate from small pockets of liquids between crystal grains. This picture supports the idea of the beta relaxation being a local phenomenon, in favor of the “islands of mobility” suggested by Johari and co-workers Johari and Goldstein (1970); Johari (2002).
The mono-hydroxyl alcohols in general are interesting because of their anomalous (and usually intense) relaxation process at frequencies lower than the structural alpha relaxation – the so called Debye relaxation – which is believed to be due to supra molecular hydrogen bonded structures in the liquid Gainaru et al. (2014); Böhmer et al. (2014). We observe that the Debye process vanishes faster than the alpha during crystallization, and that the alpha intensity seems to give a better measure for the degree of crystallinity. Sanz et al Sanz et al. (2004) made similar observations for another monohydroxyl alcohol. They studied crystallization of isopropanol in real time by simultaneous dielectric spectroscopy and neutron diffraction measurements, and thus had a direct measure of the degree of crystallinity that could be correlated with the relaxation strength of the Debye and alpha process. They observed that the Debye intensity dropped rapidly at the onset of crystallization, while the alpha intensity followed the crystallization. Their intuitive and appealing interpretation was, that the breakage of the hydrogen-bonded network is a precursor of the crystallization, and that the molecules leaving the network did not immediately go into a crystalline structure. The MW polarization effects lends itself to a different – macroscopic – interpretation of the observations. Irrespective of how the crystal growth is modeled in the MW framework, there cannot be proportionality between dielectric intensity and liquid fraction in the sample. The deviation from linearity depends on the specific model for the growth morphology and on the intensity of the process: the higher intensity, the stronger the deviation from linearity. Thus the MW analysis provides a simple explanation for why the most intense process vanish before the less intense one. The MW analysis does at the same account for the observed frequency shifts of the relaxation processes.
On the basis of MW fits, we suggested that the observed difference in crystallization behavior between the two cells could be rationalized by a transition from having primarily a growth of crystal spheres, a homogeneous nucleation and growth, to a growth of a crystal slab. This could be a slab growing from the electrodes, but could also be a certain point in the process where crystal grains percolate and effectively create a crystal layer in the liquid-crystal mixture. The difference between the cells would then be explained by a difference in the degree of crystallization when this transition takes place. The idea that the crystal growth changes from a higher dimensional growth to a low dimensional growth was supported by the Avrami–Mehl–Johnson analysis that also points to such a transition taking place at different crystallization degrees in the two sample cells. The overall validity of JMAK equation has been questioned, see e.g. Refs. Todinov, 2000; Fanfoni and Tomellini, 1998, and of course we need to be cautious when making conclusions, based on the MW analysis where the limits of applicability of the mean-field approximations was pushed. But since both types of analyses point with this picture, we believe that the proposed conception of a change in morphology of the crystal growth is consistent and sound. It remains to be shown how general this behavior is. It would be interesting to apply this procedure to a simpler sample to study the influence of sample cell geometry on the crystallization process.
Irrespective of the generality of the particular behavior found here, our study shows that one needs to be very cautious about making detailed microscopic interpretations of the crystallization mechanisms based on dielectric spectroscopy alone, because MW polarization effects of the mixed phase requires knowledge about the crystal growth morphology. In addition, we have also shown that the crystallization is extremely sensitive to the specific sample environment. Thus, it would require extensive investigations of different environments and perhaps even different probes to disentangle microscopic from macroscopic effects.
IV Conclusion
We have studied isothermal crystallization process in the deeply supercooled region of the mono-alcohol n-butanol in real time at 15 different temperatures using dielectric spectroscopy. Two different sample cells have been used to look for the effects of the sample environment on the crystallization process. We found that the time evolution of the relaxation strengths differs for the two cells in a consistent and reproducible way for all temperatures.
On the basis of the Maxwell-Wagner analysis, we suggest that the crystallization behavior can be explained by a transition from primarily growth of crystal spheres to growth of a crystal layer. The difference between the cells in this framework is the difference in when in the crystallization process this transition takes place. This picture was supported by an Avrami–Mehl–Johnson analysis that also suggests a transition from higer dimensional growth to a lower one.
The Maxwell-Wagner analysis can also account for the shift in peak frequency observed for the three processes during the course of crystallization, and thus a microscopic interpretation of the peak shift is not needed.
V Acknowledgements
Tina Hecksher is sponsored by DNRF Grant no 61. The authors thank Ranko Richert for useful discussions and valuable comments.
References
- Tammann (1925) G. Tammann, J. Soc. Glass Technol. 9, 166 (1925).
- Kauzmann (1948) W. Kauzmann, Chemical Review 43, 219 (1948).
- Debenedetti (1996) P. G. Debenedetti, Metastable liquids : concepts and principles (Princeton, N.J. : Princeton University Press, 1996).
- Becker and Döring (1935) R. Becker and W. Döring, Annalen der Physik 416, 719 (1935).
- Yuan et al. (2012) H.-F. Yuan, T. Xia, M. Plazanet, B. Deme, and M. Orrit, J. Chem. Phys. 136, 041102 (2012).
- Rabesiaka and Kovacs (1961) J. Rabesiaka and A. J. Kovacs, J. Appl. Phys. 32, 2314 (1961).
- Napolitano and Wübbenhorst (2006) S. Napolitano and M. Wübbenhorst, Macromolecules 39, 5967 (2006).
- Massalska-Arodz et al. (1999) M. Massalska-Arodz, G. Williams, D. K. Thomas, W. J. Jones, and R. Dabrowski, J. Phys. Chem. B 103, 4197 (1999).
- Alie et al. (2003) J. Alie, J. Menegotto, P. Cardon, H. Duplaa, A. Caron, C. Lacabanne, and M. Bauer, J. Pharm. Sci. 93, 218 (2003).
- Adrjanowicz et al. (2010) K. Adrjanowicz, K. Kaminski, Z. Wojnarowska, M. Dulski, L. Hawelek, S. Pawlus, M. Paluch, and W. Sawicki, J. Phys. Chem. B 114, 6579 (2010).
- Dantuluri et al. (2011) A. K. R. Dantuluri, A. Amin, V. Puri, and A. K. Bansal, Mol. Pharm. 8, 814 (2011).
- Kothari et al. (2014) K. Kothari, V. Ragoonanan, and R. Suryanarayanan, Mol. Pharm. 11, 3048 (2014).
- Sibik et al. (2014) J. Sibik, M. J. Sargent, M. Franklin, and J. A. Zeitler, Mol. Pharm. 11, 1326 (2014).
- Ezquerra et al. (1994) T. A. Ezquerra, J. Majszczyk, F. J. Balta-Calleja, L.-C. E., K. H. Gardner, and B. S. Hsiao, Phys. Rev. B 50, 6023 (1994).
- Viciosa et al. (2009) M. T. Viciosa, N. T. Correia, M. S. Sanchez, A. L. Carvalho, M. J. Romão, J. L. Gómez Ribelles, and M. Dionísio, J. Phys. Chem. B 113, 14209 (2009).
- Adrjanowicz et al. (2014) K. Adrjanowicz, A. Grzybowski, K. Grzybowska, J. Pionteck, and M. Paluch, Cryst. Growth Des. 14, 2097 (2014).
- Kremer (2003) F. Kremer, ed., Broadband Dielectric Spectroscopy (Springer Science & Business Media, 2003).
- Böhmer et al. (2014) R. Böhmer, C. Gainaru, and R. Richert, Physics Reports 545, 125 (2014).
- Shmyt’ko et al. (2010) I. M. Shmyt’ko, R. J. Jiménez-Riobóo, M. Hassaine, and M. A. Ramos, J. Phys.: Condens. Matter 22, 195102 (2010).
- Derollez et al. (2013) P. Derollez, A. Hedoux, Y. Guinet, F. Danede, and L. Paccou, Acta Cryst. B 69, 195 (2013).
- Hedoux et al. (2013) A. Hedoux, Y. Guinet, L. Paccou, P. Derollez, and F. Danede, J. Chem. Phys. 138, 214506 (2013).
- Wypych et al. (2007) A. Wypych, Y. Guinet, and A. Hedoux, Phys. Rev. B 76, 144202 (2007).
- Hassaine and Ramos (2011) M. Hassaine and M. A. Ramos, Phys. Status Solidi A 208, 2245 (2011).
- Kurita and Tanaka (2005) R. Kurita and H. Tanaka, J. Phys.: Condens. Matter 17, L293 (2005).
- Igarashi et al. (2008) B. Igarashi, T. Christensen, E. H. Larsen, N. B. Olsen, I. H. Pedersen, T. Rasmussen, and J. C. Dyre, Rev. Sci. Instrum. 79, 045105 (2008).
- Saglanmak et al. (2010) N. Saglanmak, A. I. Nielsen, N. B. Olsen, J. C. Dyre, and K. Niss, J. Chem. Phys. 132, 024503 (2010).
- Nielsen et al. (2009) A. I. Nielsen, B. Jakobsen, K. Niss, N. B. Olsen, R. Richert, and J. C. Dyre, J. Chem. Phys. 130, 154508 (2009).
- Schüller et al. (1995) J. Schüller, R. Richert, and E. W. Fischer, Phys. Rev. B 52, 15232 (1995).
- Wagner (1914) K. W. Wagner, Archiv fur Elektrotechnik 8, 371 (1914).
- Avrami (1939) M. Avrami, J. Chem. Phys. 7, 1103 (1939).
- Avrami (1940) M. Avrami, J. Chem. Phys. 8, 212 (1940).
- Avrami (1941) M. Avrami, J. Chem. Phys. 9, 177 (1941).
- Dzhonson and Bol’shakov (2003) A. G. Dzhonson and B. V. Bol’shakov, Dokl. Phys. Chem. 393, 318 (2003).
- Bol’shakov and Dzhonson (2005) B. V. Bol’shakov and A. G. Dzhonson, J. Non-Cryst. Solids 351, 444 (2005).
- Zgardzinska et al. (2010) B. Zgardzinska, M. Paluch, and T. Goworek, Chem. Phys. Lett. 491, 160 (2010).
- Johari and Goldstein (1970) G. P. Johari and M. Goldstein, J. Chem. Phys. 53, 2372 (1970).
- Johari (2002) G. P. Johari, J. Non-Cryst. Solids 307-310, 317 (2002).
- Gainaru et al. (2014) C. Gainaru, R. Figuli, T. Hecksher, B. Jakobsen, J. C. Dyre, and M. A. B. Wilhelm, Phys. Rev. Lett. 112, 098301 (2014).
- Sanz et al. (2004) A. Sanz, M. Jiménez-Ruiz, A. Nogales, D. Martín y Marero, and T. A. Ezquerra, Phys. Rev. Lett. 93, 015503 (2004).
- Todinov (2000) M. T. Todinov, Acta Mater. 48, 4217 (2000).
- Fanfoni and Tomellini (1998) M. Fanfoni and M. Tomellini, Il Nuovo Cimento D 20, 1171 (1998).