Keck Spectroscopy of Millisecond Pulsar J2215+5135: a Moderate-, High-Inclination Binary
Abstract
We present Keck spectroscopic measurements of the millisecond pulsar binary J2215+5135. These data indicate a neutron-star (NS) mass , much less than previously estimated. The pulsar heats the companion face to K; the large heating efficiency may be mediated by the intrabinary shock dominating the X-ray light curve. At the best-fit inclination , the pulsar should be eclipsed. We find weak evidence for such eclipses in the pulsed gamma-rays; an improved radio ephemeris allows use of up to 5 times more Fermi-LAT gamma-ray photons for a definitive test of this picture. If confirmed, the gamma-ray eclipse provides a novel probe of the dense companion wind and the pulsar magnetosphere.
Subject headings:
gamma rays: stars — pulsars: general1. Introduction
PSR J2215+5135 is a recycled millisecond pulsar (MSP) with ms and (where is the neutron star [NS] moment of inertia in units of ), in a hr orbit with a heated low-mass stellar companion. This “redback” (RB) system was discovered in 350 MHz Green Bank Telescope (GBT) observations (reported by Ray et al. 2012) of an unidentified Fermi-LAT (Large Area Telescope, Atwood et al., 2009) gamma-ray source. The radio dispersion measure () provides a distance estimate kpc, and this relatively close and bright system can be subject to detailed study.
Schroeder & Halpern (2014, hereafter SH14) obtained high-quality light curves of the companion over many orbits. It varies from to 20.2 mag and thus is well measured with modest-aperture telescopes. Fitting these light curves with the ELC code (Orosz & Hauschildt, 2000) and a photometry table generated from the PHOENIX model atmospheres (Husser et al., 2013), SH14 inferred a low system inclination and large pulsar mass, . This is potentially very important, since it would be one of the highest-known NS masses. Such objects can provide strong constraints on the equation of state at supernuclear densities (Lattimer & Prakash, 2007; Steiner et al., 2013).
However, their fit showed several peculiarities. The unheated “night” face of the companion was found to have K and the heated “day” side K in the ELC fits, in poor agreement with the observed bluer colors. The light curve seemed shifted by with respect to the radio-pulse ephemeris. SH14 suggest that the blue colors could be a hot quiescent disk, while the phase shift may be an effect of an intrabinary shock. Also, Gentile et al. (2014) observed the system in the X-rays with CXO, finding an X-ray minimum near orbital phase (pulsar superior conjunction, radio eclipse), which they interpret as due to variable obscuration of emission from an intrabinary shock around the companion.
To probe these peculiarities, we have obtained Keck spectra across the binary orbit. Our data show no evidence for disk or shock emission lines, but imply much higher system inclination, with higher companion temperatures and stronger pulsar heating. This lowers the inferred pulsar mass, but raises the possibility that the pulsed magnetospheric emission is eclipsed by the companion star. Gamma-ray data currently show limited evidence for such eclipse, but additional observations can test this hypothesis.
2. Keck Spectroscopy
The system was observed on three occasions. In each case we aligned the long slit at position angle (N through E) to include two bracketing stars for monitoring purposes (see the finder chart in Breton et al. 2013). The mag star at USNO-B1 J2000 position , (C1) appears to show radial-velocity (RV) variations between epochs, so we use the mag star away at J2000 position , (C2) as our reference object.
First, using the DEep Imaging Multi-Object Spectrograph (DEIMOS; Faber et al. 2003) on Keck-II, we obtained s exposures covering 4450–9060 Å on 2014 October 2 (UT dates are used throughout this paper; MJD 56932) with Å resolution through a -wide slit. These data covered –1.025, where is optical maximum (“Noon”) and the pulsar ascending node is at . The radio ephemeris defines MJD and d. For improved blue coverage, we observed again on 2014 October 24 (MJD 56954) by taking s exposures with the Low Resolution Imaging Spectrometer (LRIS; Oke et al. 1995) on Keck-I using the slit and the 5600 Å dichroic splitter. The blue-camera 600/4000 grism provided Å resolution, while the red-camera 400/8500 grating delivered Å resolution. These data covered wavelengths –10,260 Å and orbital phases . Finally, we observed with the same setup on 2014 November 20 (MJD 56981), covering orbital phase by taking s exposures. Calibration spectra of blue (BD) and red (BD) spectrophotometric standards were obtained during each run. The spectra were subject to standard IRAF reductions, including optimal extraction.
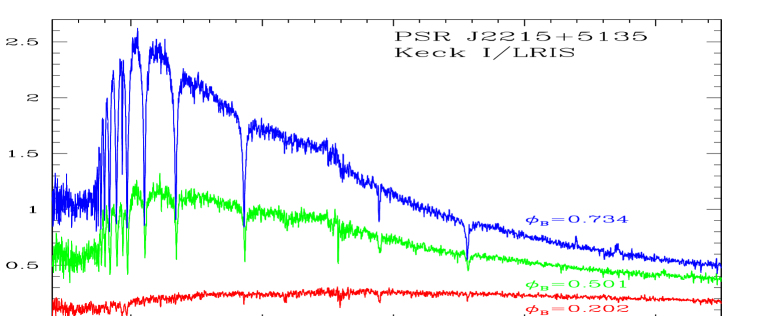
Figure 1 shows the reduced, calibrated LRIS spectra at three orbital phases. The companion is significantly hotter than the SH14 ELC solution, with an effective spectral class A2 V near optical maximum brightness ( K) and G0 V near minimum ( K), as determined by line-ratio comparison with spectral standards. No strong emission lines or nonthermal component are seen, although a weak variable blue continuum peaking at is not at present excluded.
The spectra show a wealth of stellar absorption features, and so we measure the RV variation using the IRAF XCASO script (Kurtz & Mink, 1998). The templates were drawn from the Indo-US library of Coudé Feed spectra (Valdes et al., 2004), selecting dwarf stars with known RV from a range of well-determined spectral classes. The cross-correlation statistic was –60 for the day-phase October 24 LRIS data and –25 for the night-phase November 20 spectra. With the more-limited blue coverage on October 2, the cross correlations were weaker, giving –20 and larger RV uncertainties. Since C1 shows RV variation between epochs, we relied on C2 for our RV tie. This star matched best to a K0 V spectrum. Cross correlation delivered velocity uncertainties of (LRIS) and –4.0 (DEIMOS). To remove residual drift in the wavelength solution, we corrected the pulsar companion velocities to bring the measured C2 velocities into agreement. The C2 measurement errors, plus systematic errors estimated from the variance between cross correlations with different templates, were added in quadrature to the individual RV uncertainties to produce the final RV uncertainty. These RVs and errors are plotted in Figure 2 as a function of orbital phase computed from the barycentered times of the exposure midpoints. Lacking velocity-standard observations spanning the companion spectral class during each run, we may have additional systematic uncertainty in the absolute RV.
3. Light-Curve Comparison and Modeling Constraints
To compare with the light-curve data, we plot the phased magnitudes and uncertainties published in Figure 2 of SH14; we ignored upper-limit points (generally from epochs of poor photometry), extracting 103 , 55 , and 113 magnitudes. These data and our new RV measurements were analyzed with two popular light-curve modeling programs: the ELC code and the ICARUS code (Breton et al. 2011). For both we can run in “MSP” mode, with the projected pulsar orbit lt-s from the radio ephemeris. Both codes model pulsar heating of the companion as illumination by a point (X-ray) source, generating filter-specific light-curve models and estimating binary-system parameters via model fits. The temperature model is determined by the underlying temperature of the star (actually of the unheated “night” face), and a heating flux denoted . The observed light curves are then sensitive to the orbital inclination and the mass ratio . The heating power can be related to the effective temperature of the heated face by
(effective albedo = 0). The Roche lobe filling factor is also relevant; as concluded by SH14, ELC fits require . It is also large () in the ICARUS fits. SH14 find that the heating center is phase shifted. We concur, but find , smaller than the of their Table 2.
The two codes have some model differences. For the ELC code, one can simultaneously fit the observed RV points, giving additional sensitivity to and direct estimates of the component masses. However, the code fits normalized light curves for each band separately, ignoring the instantaneous colors and observed magnitude. When searching high-quality data for the minimum near a correct physical model, this normalization should not affect the fit values and insulates the results from systematic interband photometry errors. The ICARUS code, in contrast, fits the observed magnitudes directly, using the instantaneous colors and providing estimates of the distance modulus and the extinction.
For the ELC modeling, we wish to compare with the SH14 results, and so we used the same color table (kindly shared by J. Schroeder) generated from the PHOENIX atmosphere models (Husser et al., 2013) with an extension to 10,000 K from the ATLAS9 atmospheres (Castelli & Kurucz, 2004). For the ICARUS code we collected Harris color tables from the PHOENIX models tabulated at the Spanish Virtual Observatory (svo2.cab.inta-csis.es). Our results are summarized in Table 1 and Figure 3.
Our ELC fit to the magnitudes finds parameters similar to those of SH14, except that their solution lies to the side of a broad minimum; the global minimum lies at considerably higher , with (the minimum in their estimated contours is ). These values are about twice those reported by SH14, but the model light curves and residual plots look quite similar to their results across this range of . These ELC photometry fits give much lower temperatures and heating powers than allowed by our Keck spectra. The ICARUS photometry fit gives a dramatically different picture, finding K, much more consistent with the spectral estimate. is also much larger. The fit does not strongly constrain . The best fits prefer large extinctions; we fix mag, the maximum in this direction from the Schlafly & Finkbeiner (2011) models. The distance modulus is 12.98 mag or kpc, not inconsistent with the dispersion-measure estimate.
We next explored ELC fits of the combined photometry and spectroscopy RV datasets. Since there are only 18 velocity points, these could be overwhelmed by the photometric data. Accordingly, we fit using the RV points 5 times each, effectively increasing the weights to compete with the photometry sets. Testing with only 1 and as many as 10 RV sets revealed that the fit results are insensitive to this choice, but the fitting converged more rapidly to the minima with the increased RV weights.
| Param. | SH14 | PaaP: ELC photometric fit | P/Sbb P/S:ELC photometric/spectral fit (“Best” in Figure 3.) | HiTccHiT ELC photometric/spectral fit w/ K constraint. | ICARUS |
|---|---|---|---|---|---|
| 51.8 | 52.0 | 88.8 | 75–90 | ||
| 7.50 | 7.35 | 6.89 | (0.87–0.99)ddRoche fill factor. increases with ; all imply . | ||
| (K) | 3780 | 3780 | 6220 | ||
| Log() | 33.79 | 33.79 | 33.77 | 34.71 | 34.76 |
| [3.29]eeOur fit value; SH14 report . | 3.25 | 2.98 | 4.36 | 5.05 | |
| 4.14 | 3.88 | 1.59 | – | ||
| 0.55 | 0.53 | 0.23 | – |
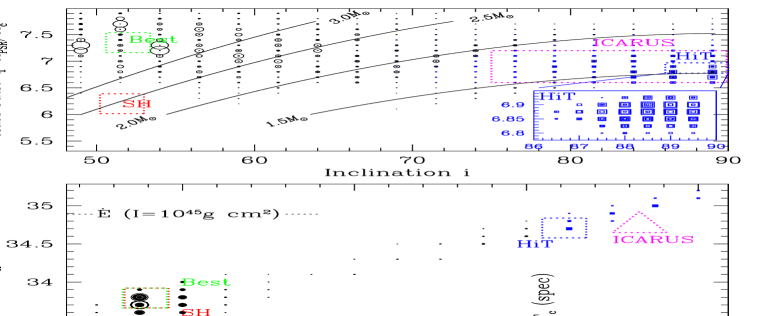
Figure 3 illustrates the results from our combined photometry/RV fits, with two panels showing the projected from a grid of models in four fit parameters. The points are scaled so that large sizes correspond to lower . With a minimum , we must conclude that the models are inadequate (or the error bars are underestimated). Thus, no particular fit value or formal uncertainty should be believed. Nevertheless, the global picture of a pulsar-heated companion is surely correct, and the distribution of best (albeit inadequate) fits in parameter space gives a guide to future precise solutions.
First, we note the strong correlation of the “good” solutions in the – plane. Recalling that ELC fits the normalized light curves, we can understand that this simply preserves the height of the light-curve peak; with higher , larger is needed for the same maximum. The best light-curve fits are indeed for low solutions, as found by SH14. However there is a shallower minimum at , consistent with the colors and spectroscopic temperatures. This local minimum is not evident when fitting only photometry. The RV data require substantially larger than in the pure photometry fits, but remains poorly constrained, with a wide swath of moderate displaying many local minima. The small SH14 value is excluded, but the global minimum is quite similar to the best-fit photometry-only solution. This solution has an unphysically large pulsar mass .
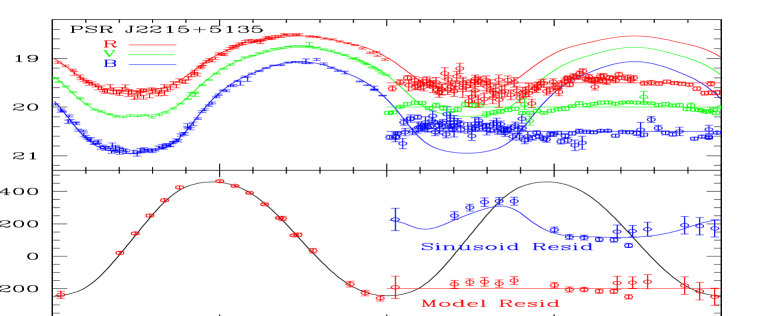
However, if we restrict attention to solutions with K, consistent with the spectroscopic classification (square dots), these form a minimum at large inclination , and . This shallower but well-defined minimum, shown in detail in the upper-panel inset of Figure 3, has a much more modest . In Figure 2, we show the light-curve and RV models for this solution, and the fit residuals. Note the systematic residuals over optical maximum, especially in and . This indicates an incorrect heating model. The correct heating pattern (likely mediated by an intrabinary shock; see below) should have a surface temperature distribution allowing a better match to the light-curve peak. The RV residuals show similar systematic departures. We also plot the RV points and model after the same best-fit sinusoid has been removed. This shows that the basic nonsinusoidal terms in the center-of-light velocity are well detected in our spectra.
This solution has very large , raising the interesting possibility of a pulsar eclipse.
4. The High-Energy Orbital Light Curve
At our large (“HiT”) fit minimum, we expect the companion to eclipse the pulsar for . The radio-pulse emission is undetected for over half the orbit. However, the ionized companion winds of RB and black-widow pulsars generally prevent radio-pulse detection for sight lines passing well outside the companion Roche lobe, so this alone does not indicate true eclipse.
We have re-examined the 17.0 ks CXO ACIS exposure of PSR J2215+5135 (ObsID = 12466), starting on MJD 55697.1821 and covering 1.14 orbits. As noted by Gentile et al. (2014), there is a clear shallow modulation with a minimum at pulsar superior conjunction (Figure 4). This shallow modulation might be best interpreted as variable viewing of an X-ray emitting intrabinary shock.
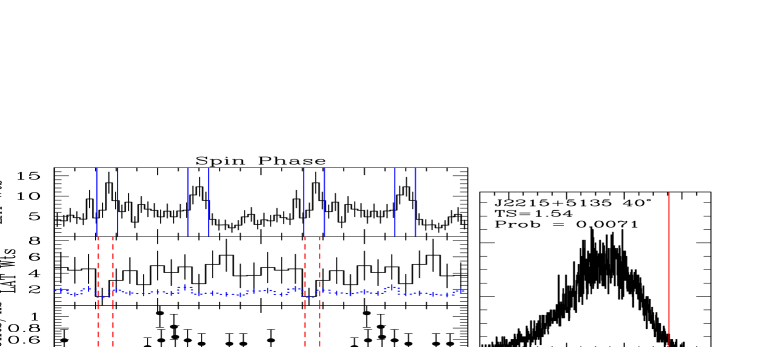
A powerful intrabinary shock can also produce GeV LAT photons (Xing & Wang, 2015). However, since an appreciable fraction of the object’s gamma-ray flux is pulsed, we can select the magnetospheric component and search for a true pulsar eclipse. Unfortunately, as for many RB MSPs, the wind obscuration and fluctuations make radio timing very difficult. At present, the best ephemeris available is that of Abdo et al. (2013, 2PC), valid MJD 55346–55911, about a fifth of the LAT mission to date. We selected 10,951 –30 GeV Pass 7 reprocessed ‘Source class’ LAT photons within this date window and within of the pulsar. We compute weights , the probability of being pulsar photons, with the LAT tool gtsrcprob using the Acero et al. (2015) source spectrum parameters and the local background model; the mean source probability was . The spin-phase weighted light curve shows two peaks consistent with 2PC results ( and relative to the radio-pulse peak). If we extrapolate this ephemeris to the full LAT dataset, the peaks are lost. We select windows centered on the 2PC pulse peaks, to obtain events most dominated by magnetospheric emission. Other phases represent pulsed bridge flux, unpulsed flux from the intrabinary shock (if any), and unmodeled background emission. The middle panel shows the weighted binary light curve from the peak phase window; intriguingly, the minimum bin is at , pulsar superior conjunction. The full spin-phase light curve shows no strong eclipse. This suggests an additional uneclipsed gamma-ray component.
Binning clearly affects the minimum’s appearance, so we desire an unbinned test for the eclipse significance. For an eclipse width , we form the test statistic
where the first sum is over the uneclipsed window and the second is over the eclipse window. Exposure variations are already very small (% in the binned light curve), but the likelihood ratio test used here is insensitive to even these, since the variations are common to both the null and eclipse scenarios. To estimate the probability distribution of this statistic, we scrambled weights among the pulse peak photons and recomputed TS 10,000 times. At , we find a chance probability of 0.080 (). However, the companion wind and photon opacity may widen the gamma-ray eclipse. Indeed, somewhat wider eclipses, to , show larger significance. The best detection is at , illustrated in the histogram at right, with a 0.7% (, single trial) probability of a false-positive detection. This is intriguing, but hardly definitive. However, an improved radio ephemeris should provide a factor of more photons and better pulse phase isolation, allowing a sensitive test for a magnetospheric (pulse phased) eclipse.
5. Conclusions
Our spectroscopic study of the RB MSP J2215+5135 does not support the inference, based on companion light-curve-shape fits, that it is a particularly massive pulsar. Instead, the results suggest a modest NS mass. However, the present fit is based on a clearly inadequate heating model assuming direct (X-ray) pulsar illumination. Of course, for all viable ELC model fits the heating flux is much larger than the of the CXO observation. Indeed, as found for PSR J1311–3430 (Romani, Filippenko, & Cenko 2015), we find that the heating power into the companion solid angle is a large fraction of the spin-down flux (Figure 3, bottom); we argue that this indicates indirect heating by emission reprocessed in an intrabinary shock.
With the present direct heating model, the fits are inadequate and the critical binary inclination is not robustly determined. Accordingly, the fit masses are indicative only, and the statistical errors are not useful. There is a clear lesson here: with an inappropriate physical model, simple ELC fits to only the light-curve shape can deliver fit minima far from the true solution. Using the observed colors, as in ICARUS, certainly helps, but spectroscopic constraints are also essential. Of course, amendment of the physical model should greatly improve the fit quality and may allow photometry-only solutions with high-quality data.
Our temperature-constrained fits do suggest that the system is viewed nearly edge-on. If so, this presents the interesting possibility that the pulsar magnetosphere will be eclipsed by the companion. Limited by the radio ephemeris available, present evidence for such eclipses is suggestive, but not definitive. However, additional radio data and further analysis of the Fermi LAT photons can produce a strong test of the eclipse hypothesis. If well measured, the width and spectrum of the pulsed flux eclipse can provide an important new tomographic probe of the MSP magnetosphere and of the evaporative companion wind.
We thank J. Schroeder for comments about ELC fitting and for sharing the PHOENIX table, WeiKang Zheng for assistance with the Keck observations, and Paul Ray for a careful review of the manuscript. This work was supported in part by NASA grant NNX11AO44G. A.V.F. and M.L.G. were supported by Gary and Cynthia Bengier, the Christopher R. Redlich Fund, the TABASGO Foundation, and NSF grant AST-1211916. Some of the data presented herein were obtained at the W. M. Keck Observatory, which is operated as a scientific partnership among the California Institute of Technology, the University of California, and NASA; the Observatory was made possible by the generous financial support of the W. M. Keck Foundation.
The Fermi-LAT Collaboration acknowledges support for LAT development, operation, and data analysis from NASA and DOE (United States), CEA/Irfu and IN2P3/CNRS (France), ASI and INFN (Italy), MEXT, KEK, and JAXA (Japan), and the K.A. Wallenberg Foundation, the Swedish Research Council, and the National Space Board (Sweden). Science analysis support in the operations phase from INAF (Italy) and CNES (France) is also gratefully acknowledged.
References
- Abdo et al. (2013) Abdo, A. A., Ajello, M., Allafort, A., et al. 2013, ApJS, 208, 17
- Acero et al. (2015) Acero, F., Ackermann, M., Ajello, M., et al. 2015, ApJS, in press
- Atwood et al. (2009) Atwood, W.B., Abdo, A.A., Ackermann, M., et al. 2009, ApJ, 697, 1071
- Breton et al. (2013) Breton, R. P., et al. 2013, ApJ, 769, 108
- Castelli & Kurucz (2004) Castelli, F., & Kurucz, R. L. 2004, arXiv:astro-ph/0405087
- Faber et al. (2003) Faber, S. M., et al. 2003, SPIE, 4841, 1657.
- Gentile et al. (2014) Gentile, P. A., Roberts, M. S. E., McLaughlin, M. A., et al. 2014, ApJ, 783, 69
- Husser et al. (2013) Husser, T.-O., Wende-von Berg, S., Dreizler, S., et al. 2013, AA, 533, A6.
- Kurtz & Mink (1998) Kurtz, M. J., & Mink, D. J. 1998, PASP, 110, 934
- Lattimer & Prakash (2007) Lattimer, J. M., & Prakash, M. 2007, PhR, 442, 109L
- Oke et al. (1995) Oke, J. B., et al. 1995, PASP, 107, 375
- Orosz & Hauschildt (2000) Orosz, J. A., & Hauschildt, P. H. 2000, AA, 364, 265
- Ray et al. (2012) Ray, P. S., et al. 2012, arXiv1205.3089
- Romani et al. (2015) Romani, R. W., Filippenko, A. V., & Cenko, S. B. 2015, ApJ, 804, 115
- Schlafly & Finkbeiner (2011) Schlafly, E. F., & Finkbeiner, D. P. 2011, ApJ, 737, 103
- Schroeder & Halpern (2014) Schroeder, J., & Halpern, J. P. 2014, ApJ, 793, 78
- Steiner et al. (2013) Steiner, A. W., Lattimer, J. M., & Brown, E. F. 2013, ApJ, 765, L5
- Valdes et al. (2004) Valdes, F., Gupta, R., Rose, J. A., Singh, H. P., & Bell, D. J. 2004, ApJS, 152, 251.
- Xing & Wang (2015) Xing, J., & Wang, Z. 2015, arXiv 1502.04783v2