High pressure specific heat spectroscopy reveals simple relaxation behavior of glass forming molecular liquid
Abstract
The frequency dependent specific heat has been measured under pressure for the molecular glass forming liquid 5-polyphenyl-4-ether in the viscous regime close to the glass transition. The temperature and pressure dependence of the characteristic timescale associated with the specific heat is compared to the equivalent timescale from dielectric spectroscopy performed under identical conditions. It is shown that the ratio between the two timescales is independent of both temperature and pressure. This observation is non-trivial and demonstrates the existence of specially simple molecular liquids in which different physical relaxation processes are both as function of temperature and pressure/density governed by the same underlying “inner clock”. Furthermore, the results are discussed in terms of the recent conjecture that van der Waals liquids, like the measured liquid, comply to the isomorph theory.
The viscosity of liquids close to the glass transition is strongly temperature dependent – just a few percent decrease in temperature can lead to several decades increase in viscosity. Coupled to the increase in viscosity is a slowing down of the molecular structural relaxation time (the alpha relaxation time), leading to a timescale separation between the fast iso-structural degrees of freedom and the slow structural degrees of freedom. The glass transition occurs at the temperature where the slow degrees of freedom are no longer accessible on the experimental timescale. This gives rise to a drop in the measured specific heat which is a classical signature of the glass transition Kauzmann (1948). The time scale separation in the highly viscous liquid just above the glass transition temperature leads to time or equivalently frequency dependence of physical properties which couple to the structural relaxation; the mechanical moduli and the dielectric constant are for example frequency dependent. Even though heat capacity is a classical probe of the glass transition, the awareness of the fact that the specific heat is also a frequency dependent response function which shows relaxation is surprisingly young and only dates back to the 80’es (some of the earliest discussions are given in Refs. Gobrecht, Hamann, and Willers, 1971; Angell and Torell, 1983; Birge and Nagel, 1985; Christensen, 1985; Birge, 1986; Nielsen and Dyre, 1996). The first experimental specific heat spectroscopic techniques for studying viscous liquids were also developed in the 80’es by Birge and Nagel Birge and Nagel (1985) and Christensen Christensen (1985). The amount of data on frequency dependent specific heat is still very limited today 30 years later, probably because no standard commercial technique has been available. (The following list is not a comprehensive list of all specific heat spectroscopy studies of glass forming liquids, but covers to the best of our knowledge all groups that have addressed the issue, Refs. Christensen, 1985; Birge and Nagel, 1985; Settles et al., 1992; Moon, Jeong, and Kwun, 1996; Christensen and Olsen, 1998; Carpentier, Bustin, and Descamps, 2002; Bentefour et al., 2003; Minakov, Adamovsky, and Schick, 2003; Jakobsen, Olsen, and Christensen, 2010).
The workhorse in the study of frequency dependent response of glass forming liquids is dielectric spectroscopy both when it comes to studies of the temperature dependence of the alpha relaxation (e.g. Refs. Richert and Angell, 1998; Hecksher et al., 2008; Elmatad, Chandler, and Garrahan, 2009) and the spectral shape of the relaxation (e.i. stretching Bohmer et al. (1993); Nielsen et al. (2009) and beta-relaxation Johari and Goldstein (1970)). The use of dielectric spectroscopy is particularly dominant when it comes to high pressure studies, which have become increasingly important during the last couple of decades. Today it is clear that the dynamics of viscous liquids should be understood as function of both temperature and pressure/density because this is the only way to disentangle the effect of density from that of thermal energy. Two key findings from high pressure studies are: Density scaling (e.g. Refs. Dreyfus et al., 2003; Alba-Simionesco et al., 2004; Casalini and Roland, 2004; Roland et al., 2005 ), and isochronal superposition (e.g. Refs. Tölle, 2001; Roland, Casalini, and Paluch, 2003; Pawlus et al., 2003; Ngai et al., 2005; Roland et al., 2008; Roed et al., 2013). These results are almost exclusively based on dielectric data because dielectric spectroscopy is easily adapted to high pressure and commercial equipment is available 111Examples of commercial high pressure dielectric equipment are a full dielectric high pressure system from “NOVOCONTROL Technologies GmbH” and high pressure vessels with electrical feed throughs from “Unipress Equipment”..
Different physical properties probe the microscopic dynamics in different ways. An example is that dielectric spectroscopy only is sensitive to degrees of freedom which involve reorientation of dipoles in the liquid while specific heat measures those degrees of freedom which couple to changes in energy. This naturally leads to differences in the observed characteristic time scales for different properties it is e.g. well-known that shear-mechanical relaxation is faster than dielectric relaxation (e.g. Ref. Jakobsen, Niss, and Olsen, 2005 and references therein).
While all the liquid dynamics slows down upon cooling (or compression) it is by no means trivial that all time scales follow each other as a function of temperature and pressure. A well-known example is the pronounced decoupling between translational and rotational motions which has been confirmed in many systems, also under pressure (e.g. Ref. Bielowka et al., 2001). Even time scales which at a first coarse look seem to follow each other over many decades, have been shown to have differences in the temperature dependence when analyzed in detail (e.g. Refs. Stickel, Fischer, and Richert, 1996; Jakobsen, Niss, and Olsen, 2005). Moreover, there is an increasing amount of evidence for dynamical heterogenities in viscous liquids (e.g. Ref. Ediger, 2000). Different physical properties will a priori “see” and average differently over the dynamical heterogeneities. This would imply different temperature-dependence of the timescales as the dynamical heterogenities evolve with cooling and lead to the picture suggested by Angell in 1991, namely a series of decoupling temperatures as the liquid is cooled downAngell (1991).
An example of the pitfall of exclusively basing analysis on one response function is the understanding of the dynamics in monohydroxy alcohols. It was for a long time thought that the main dielectric relaxation peak was the signature of the structural relaxation, leading to puzzling observations about monohydroxy alcohols (e.g. in Ref. Bohmer et al., 1993). This was only resolved when other response functions were analyzed, showing that the dominant process in the dielectric spectrum is not related to the structural molecular relaxation Böhmer, Gainaru, and Richert (2014) seen in specific heat Huth et al. (2007) and shear modulus Jakobsen et al. (2008); Hecksher and Jakobsen (2014).
It is in itself a fundamental question whether the liquid relaxation seen in different techniques behaves in the same way. Additionally, it is important to establish whether dielectric results especially at elevated pressures can be generalized and viewed as generic information about the alpha relaxation.
Experimentalists have often attempted to find general (universal) behaviors and correlations in the effort to guide theory and models for the viscous slowing down Bohmer et al. (1993); Sokolov et al. (1993); Scopigno et al. (2003); Novikov and Sokolov (2004). However, as more and more systems are studied, these results are usually found to hold only for a limited class of systems Yannopoulos and Papatheodorou (2000); Huang and McKenna (2001); Buchenau and Wischnewski (2004); Niss et al. (2007); Dalle-Ferrier et al. (2010). Another trend is to focus on exotic phenomena seen in complicated systems like the notorious counter example water Debenedetti (2003); Angell (2008). The emerging picture is that while the viscous slowing down and the glass transition as such are universal features which (at least in principle) can be observed in all systems independent of chemical details, there is also a myriad of specific behaviors and it seems unlikely to capture all this in one simple model. Based on this understanding our proposal is to address the question of what the simplest behavior is? Or put in other words what are the features that should be included in the “ideal gas model” of glass forming liquids?
In this work we present frequency dependent specific heat measurements taken as function of both temperature and pressure up to 300 MPa on the molecular glass former 5-polyphenyl-4-ether (5PPE) and compare to existing dielectric data Roed (2012); Roed et al. (2013) taken in the same pressure equipment ensuring consistency of absolute temperature and pressure. To the best of our knowledge these are the first ever high pressure data where both dielectric and specific heat spectroscopy are taken under identical conditions, allowing for a detailed comparison.
5PPE has been studied intensively by the “Glass and time” group over the past years (at atmospheric pressure Niss, Jakobsen, and Olsen (2005); Jakobsen, Niss, and Olsen (2005); Hecksher et al. (2010); Jakobsen, Olsen, and Christensen (2010); Jakobsen et al. (2012); Hecksher et al. (2013), and at high pressures Gundermann (2013); Roed et al. (2013); Xiao et al. (2015)), and has been found to have a particular simple behavior. One of these findings was that no decoupling is seen in 5PPE when comparing the temperature dependence of 6 different timescales Jakobsen et al. (2012). This result was later supported by result from the group of C. Schick who compared dielectric and specific heat spectroscopy with lower accuracy but over larger range in dynamics Shoifet, Schulz, and Schick (2015).
The data in the current paper extends these studies to high pressures. Hereby addressing the question of whether the alpha relaxation time is uniquely determined independent of probe in the entire phase space.
The strong temperature dependence of the characteristic timescales of liquids close to the glass transition, has the consequence that even small temperature/pressure differences will lead to large errors in the measured timescales. In order to make detailed comparisons it is therefore crucial to measure different response functions under the same conditions (see e.g. Ref. Richert, 1992). To the best of our knowledge there is only one previous study of frequency dependent specific heat at elevated pressures, in which Leyser et al. Leyser et al. (1995) 20 years ago investigated orthoterphenyl in a limited pressure range up to 105 MPa, and compared to existing literature data Naoki, Endou, and Matsumoto (1987). Their data show that the timescales do follow rather closely along the investigated paths in phase space, however some systematic changes are seen. Due to the limited pressure/temperature range investigated and the fact that the dielectric data they compare to is from a different study, it is not possible to conclude if the ratio between the two timescales is constant or changing for this liquid.
Our unique specific heat spectroscopy technique is based on measuring the thermal impedance at a spherical surface in the liquid (the relation between heat flow into the liquid from the surface, and the temperature at the same surface). The method is inspired by the method developed by Birge and Nagel 30 years ago Birge and Nagel (1985); Birge, Dixon, and Menon (1997). Our version of the technique Jakobsen, Olsen, and Christensen (2010) utilize a spherical geometry, and a liquid layer much thicker than the thermal wavelength (the thermally thick limit). In this case the outer thermal and mechanical boundaries do not influence the measured property Christensen and Dyre (2008). What is measured is the longitudinal volume specific heat Christensen, Olsen, and Dyre (2007); Christensen and Dyre (2008) which is approximately equal to the isobaric specific heat 222The longitudinal volume specific heat is related to the isochoric specific heat () by where and respectively are the adiabatic and the isothermal bulk moduli, and is the shear modulus. At state points where relaxation occurs will differ from 0, which means that and differs. However, the difference in characteristic timescale is very small (see supplementary material of Jakobsen et al., 2012).. By the 3omega technique a temperature dependent resistor is utilized as heat generator and thermometer simultaneous Birge, Dixon, and Menon (1997); Jakobsen, Olsen, and Christensen (2010).
The method is well suited to be adopted to different sample environments with little requirements to the mechanical properties of the sample cell and electrical connections. Altogether this makes the method perfect for integration in existing pressure equipment.
The measurements were performed using commercial high-pressure equipment from Unipress Equipment (Warsaw, Poland). The pressure is applied using a pressure liquid, which is separated from the sample cell by a shielding of rubber and Teflon. Pressures go up to 600 MPa with a stability of 3 MPa, temperatures ranges from 233 to 333 K (for further details see Refs. Igarashi et al., 2008; Gundermann, 2013; Roed, 2012). A spherical NTC-thermistor bead (a temperature dependent resistor, with “Negative Temperature Coefficient”) is used as heat generator and thermometer and is placed in the middle of the sample cell with a distance of mm from the closest sides ensuring approximately thermally thick conditions down to the millihertz range. The 5PPE liquid studied is the diffusion pump oil 5-polyphenyl-4-ether acquired from Santovac. The liquid was dried for one hour under vacuum before use.
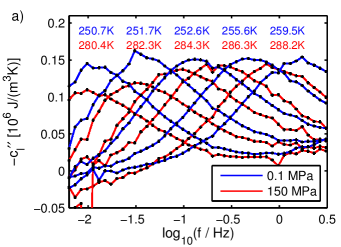
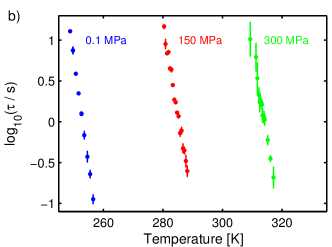
The specific heat measurements are performed at different temperatures along the isobars; 0.1 MPa (atmospheric pressure), 150 MPa, and 300 MPa. The initial data analysis was performed as in Ref. Jakobsen, Olsen, and Christensen, 2010. Examples of the imaginary part of the frequency dependent longitudinal specific heat at different temperatures and pressures are shown in Fig. 1a. The peak frequency of the imaginary part, (the loss-peak frequency) defines a directly experimental accessible characteristic timescale () for the specific heat relaxation. Figure 1b. shows the relaxation times for all measured temperatures and pressures. The extreme temperature and pressure dependence of the relaxation time is clearly seen in this representation. The shown error bars refer to limitations in precision of the specific heat technique Jakobsen, Olsen, and Christensen (2010). There is moreover approximately 0.1 decade uncertainty on the relaxation time due to the limited stability of the pressure of 3MPa.
The comparable dielectric spectroscopy measurements were taken in relation to Refs. Roed et al., 2013; Roed, 2012 utilizing the same pressure equipment. The dielectric measurements were performed along the isobars; 0.1 MPa, 100 MPa, 200 MPa, 300 MPa, and 400 MPa. The relaxation time is again defined from the loss-peak frequency (). Figure 2 shows the relaxation time as a function of temperature at the different pressures for both the specific heat and for the dielectric measurements. As mentioned earlier the fact that the data are taken under the same thermal and pressure conditions gives a unique possibility for directly comparing the temperature and pressure dependence of the timescale from dielectric and specific heat spectroscopy over a rather wide pressure range.
From Fig. 2 it is seen that the temperature dependence of the relaxation times from the two methods closely follows each other at all investigated pressures. It is also seen that the dielectric relaxation time is faster than the specific heat relaxation time at all pressures. This shows that the ambient pressure observation of identical temperature dependence of dielectric and specific heat relaxation time presented by some of us in Jakobsen et al. (2012) Jakobsen et al. (2012) on 5PPE also holds at elevated pressures.
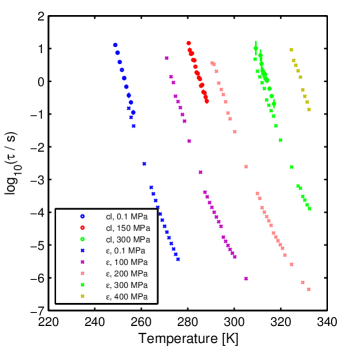
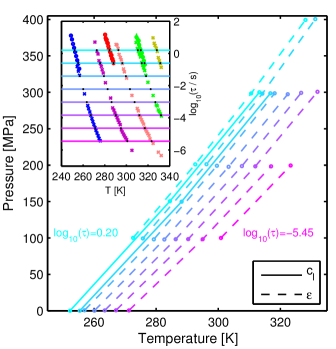
Figure 3 presents the same data using isochrones, which are lines in the phase diagram of constant relaxation time; that is contour lines of the relaxation time map, . The isochrones are illustrated for both methods, and it is seen that the isochrones for the two response functions are parallel.
The main result of this article is that the ratio is constant within error bars for all investigated temperatures and pressures for 5PPE. This result is obtained by combining the observation from Fig. 2 (and Ref. Jakobsen et al., 2012) and Fig. 3 as described below. Combining the data from the present study and from Ref. Jakobsen et al., 2012 yields , with the major contribution to the uncertainty coming from pressure instabilities.
The relaxation time is a smooth function of temperature and pressure, and parallel isochrones therefore imply that an isochrone for one of the two response functions is also an isochrone for the other but with a different timescale, as the dielectric relaxation is faster than the specific heat relaxation at a given state point.
The difference between the timescales associated with the isochrones is not a priory the same for different isochrones. The observation that the ratio is constant along the isobars as shown on Fig. 2 (and illustrated even more clearly at atmospheric pressure in Ref. Jakobsen et al., 2012) is therefore an additional simplicity. Since any isobar crosses all the isochrones, we can conclude that the timescale difference associated with the isochrones indeed is the same in all of the explored part of the phase diagram for this liquid (it is enough to shown that it is constant along one curve, crossing the isochrones).
The observation that the isochrones from one of the methods are also isochrones for the other method is a direct prediction of the isomorph theory developed in the “Glass and Time” group Gnan et al. (2009); Dyre (2014); Schrøder and Dyre (2014). The theory predicts the existence of isomorphs which are curves in the phase diagram of simple (called Roskilde simple) liquids along which a number of properties are invariant. The isochrones of any response function will in the viscous regime (or in reduced units) coincide with an isomorphs, which means that an isochrone from one response function is also an isochrone for another response function, as all dynamics are invariant along an isomorph Roed et al. (2013).
Simple van der Waals liquids as 5PPE are expected to be Roskilde simple Gnan et al. (2009); Ingebrigtsen, Schrøder, and Dyre (2012); Dyre (2014). We have in Refs. Gundermann, 2013; Xiao et al., 2015; Roed et al., 2013 shown that 5PPE corroborates other isomorph predictions, this together with the present result indicating that 5PPE indeed is a good example of a Roskilde simple liquid.
In Jakobsen et al. (2012)Jakobsen et al. (2012) some of us showed that at ambient pressure, not only specific heat and dielectric, but also several other thermo-viscoelastic responses have timescales which follow closely with temperature for 5PPE. Based on this we hypothesize that the timescales of all the frequency dependent response functions of 5PPE have a common temperature and pressure dependence in the viscous regime. An interpretation of this observation is that the structural relaxation time is governed by one “inner clock” and implies a greater simplicity than predicted by the isomorph theory. It is also a challenge to understand how all response functions can couple so closely if the underlying dynamics is heterogeneous with a growing length scale along with viscous slowing down — since the different macroscopic responses could very well average differently over the heterogeneities.
5PPE has other simple behaviors which are beyond isomorph theory. The spectral shape of the dielectric signal obeys Time Temperature Pressure Superposition (TTPS), thus it is independent of pressure and temperature in a range where changes by 7 orders of magnitude Roed (2012); Roed et al. (2013). Time Temperature Superposition is moreover found in frequency dependent bulk modulus and the shear mechanical relaxation, and these two moduli in fact have the same spectral shape Hecksher et al. (2013). Finally 5PPE is also found to obey Time Aging Time Superposition Hecksher et al. (2010).
The simple behavior of 5PPE is obviously not universal for all glass-forming liquids, it might not even be a general behavior of van der Waals bonded liquids. Yet 5PPE exhibits the hallmarks of glass forming liquids; it has a non-Arrhenius temperature dependence (fragility index m=80–85)Niss and Jakobsen (2003) and a non-exponential relaxation (high frequency power law -0.5)Jakobsen, Niss, and Olsen (2005). This means that models and theories for understanding non-Arrhenius non-exponential relaxation need to be consistent with a simple behavior where there is no decoupling of different timescales and no increase in the broadening of the relaxations in the entire viscous range (defined as timescales ranging from a microsecond up to a kilosecond).
To summarize, we have presented specific heat spectroscopy data over an unprecedented pressure range, with accompanying dielectric data taken under the same thermal and pressure conditions. The main experimental results are that the characteristic timescale of the specific heat and the dielectric relaxation follow each other closely as function of temperature at all investigated pressures, and that isochrone curves for specific heat and dielectric spectroscopy coincide. The consequence of these two observations is that the ratio is constant over the investigated temperature and pressure range, with the dielectric spectroscopy being the fastest.
Altogether 5PPE seems to have the simplest possible behavior in respect to differences in timescales between response functions, namely that one common inner clock controls the different relaxations, and the only difference is a temperature and pressure independent ratio between the different timescales.
Acknowledgements.
L. A. R. and K. N. wish to acknowledge The Danish Council for Independent Research for supporting this work. The center for viscous liquid dynamics “Glass and Time” is sponsored by the Danish National Research Foundation’s Grant No. DNRF61.References
- Kauzmann (1948) W. Kauzmann, Chem. Rev. 43, 219 (1948).
- Gobrecht, Hamann, and Willers (1971) H. Gobrecht, K. Hamann, and G. Willers, J. Phys. E: Sci. Instrum. 4, 21 (1971).
- Angell and Torell (1983) C. A. Angell and L. M. Torell, J. Chem. Phys. 78, 937 (1983).
- Birge and Nagel (1985) N. O. Birge and S. R. Nagel, Phys. Rev. Lett. 54, 2674 (1985).
- Christensen (1985) T. Christensen, J. Phys. (Paris) Colloq. 46, C8-635 (1985).
- Birge (1986) N. O. Birge, Phys. Rev. B 34, 1631 (1986).
- Nielsen and Dyre (1996) J. K. Nielsen and J. C. Dyre, Phys. Rev. B 54, 15754 (1996).
- Settles et al. (1992) M. Settles, F. Post, D. Muller, A. Schulte, and W. Doster, Biophys. Chem. 43, 107 (1992).
- Moon, Jeong, and Kwun (1996) I. K. Moon, Y. H. Jeong, and S. I. Kwun, Rev. Sci. Instrum. 67, 29 (1996).
- Christensen and Olsen (1998) T. Christensen and N. B. Olsen, J. Non-Cryst. Solids 235-237, 296 (1998).
- Carpentier, Bustin, and Descamps (2002) L. Carpentier, O. Bustin, and M. Descamps, J. Phys. D - Appl. Phys. 35, 402 (2002).
- Bentefour et al. (2003) E. H. Bentefour, C. Glorieux, M. Chirtoc, and J. Thoen, J. Appl. Phys. 93, 9610 (2003).
- Minakov, Adamovsky, and Schick (2003) A. A. Minakov, S. A. Adamovsky, and C. Schick, Thermochim. Acta 403, 89 (2003).
- Jakobsen, Olsen, and Christensen (2010) B. Jakobsen, N. B. Olsen, and T. Christensen, Phys. Rev. E 81, 061505 (2010).
- Richert and Angell (1998) R. Richert and C. A. Angell, J. Chem. Phys. 108, 9016 (1998).
- Hecksher et al. (2008) T. Hecksher, A. I. Nielsen, N. B. Olsen, and J. C. Dyre, Nature Phys. 4, 737 (2008).
- Elmatad, Chandler, and Garrahan (2009) Y. S. Elmatad, D. Chandler, and J. P. Garrahan, J. Phys. Chem. B 113, 5563 (2009).
- Bohmer et al. (1993) R. Bohmer, K. L. Ngai, C. A. Angell, and D. J. Plazek, J. Chem. Phys. 99, 4201 (1993).
- Nielsen et al. (2009) A. I. Nielsen, T. Christensen, B. Jakobsen, K. Niss, N. B. Olsen, R. Richert, and J. C. Dyre, J. Chem. Phys. 130, 154508 (2009).
- Johari and Goldstein (1970) G. P. Johari and M. Goldstein, J. Chem. Phys. 53, 2372 (1970).
- Dreyfus et al. (2003) C. Dreyfus, A. Aouadi, J. Gapinski, M. Matos-Lopes, W. Steffen, A. Patkowski, and R. M. Pick, Phys. Rev. E 68, 011204 (2003).
- Alba-Simionesco et al. (2004) C. Alba-Simionesco, A. Cailliaux, A. Alegría, and G. Tarjus, Europhys. Lett. 68, 58 (2004).
- Casalini and Roland (2004) R. Casalini and C. M. Roland, Phys. Rev. E 69, 062501 (2004).
- Roland et al. (2005) C. M. Roland, S. Hensel-Bielowka, M. Paluch, and R. Casalini, Rep. Prog. Phys. 69, 1405 (2005).
- Tölle (2001) A. Tölle, Rep. Prog. Phys. 64, 1473 (2001).
- Roland, Casalini, and Paluch (2003) C. Roland, R. Casalini, and M. Paluch, Chem. Phys. Lett. 367, 259 (2003).
- Pawlus et al. (2003) S. Pawlus, M. Paluch, M. Sekula, K. L. Ngai, S. J. Rzoska, and J. Ziolo, Phys. Rev. E 68, 021503 (2003).
- Ngai et al. (2005) K. L. Ngai, R. Casalini, S. Capaccioli, M. Paluch, and C. M. Roland, J. Phys. Chem. B 109, 17356 (2005).
- Roland et al. (2008) C. M. Roland, R. Casalini, R. Bergman, and J. Mattsson, Phys. Rev. B 77, 012201 (2008).
- Roed et al. (2013) L. A. Roed, D. Gundermann, J. C. Dyre, and K. Niss, J. Chem. Phys. 139, 101101 (2013).
- Note (1) Examples of commercial high pressure dielectric equipment are a full dielectric high pressure system from “NOVOCONTROL Technologies GmbH” and high pressure vessels with electrical feed throughs from “Unipress Equipment”.
- Jakobsen, Niss, and Olsen (2005) B. Jakobsen, K. Niss, and N. B. Olsen, J. Chem. Phys. 123, 234511 (2005).
- Bielowka et al. (2001) S. H. Bielowka, T. Psurek, J. Ziolo, and M. Paluch, Phys. Rev. E 63, 062301 (2001).
- Stickel, Fischer, and Richert (1996) F. Stickel, E. W. Fischer, and R. Richert, J. Chem. Phys. 104, 2043 (1996).
- Ediger (2000) M. D. Ediger, Annual Review of Physical Chemistry 51, 99 (2000).
- Angell (1991) C. A. Angell, J. Non-Cryst. Solids 131-133, 13 (1991).
- Böhmer, Gainaru, and Richert (2014) R. Böhmer, C. Gainaru, and R. Richert, Phys. Rep. 545, 125 (2014).
- Huth et al. (2007) H. Huth, L.-M. Wang, C. Schick, and R. Richert, J. Chem. Phys. 126, 104503 (2007).
- Jakobsen et al. (2008) B. Jakobsen, C. Maggi, T. Christensen, and J. C. Dyre, J. Chem. Phys. 129, 184502 (2008).
- Hecksher and Jakobsen (2014) T. Hecksher and B. Jakobsen, J. Chem. Phys. 141, 101104 (2014).
- Sokolov et al. (1993) A. P. Sokolov, E. Rössler, A. Kisliuk, and D. Quitmann, Phys. Rev. Lett. 71, 2062 (1993).
- Scopigno et al. (2003) T. Scopigno, G. Ruocco, F. Sette, and G. Monaco, Science 302, 849 (2003).
- Novikov and Sokolov (2004) V. N. Novikov and A. P. Sokolov, Nature 431, 961 (2004).
- Yannopoulos and Papatheodorou (2000) S. N. Yannopoulos and G. N. Papatheodorou, Phys. Rev. B 62, 3728 (2000).
- Huang and McKenna (2001) D. H. Huang and G. B. McKenna, J. Chem. Phys. 114, 5621 (2001).
- Buchenau and Wischnewski (2004) U. Buchenau and A. Wischnewski, Phys. Rev. B 70, 092201 (2004).
- Niss et al. (2007) K. Niss, C. Dalle-Ferrier, G. Tarjus, and C. Alba-Simionesco, J. Phys.: Condens. Matter 19, 076102 (2007).
- Dalle-Ferrier et al. (2010) C. Dalle-Ferrier, K. Niss, A. P. Sokolov, B. Frick, J. Serrano, and C. Alba-Simionesco, Macromol. 43, 8977 (2010).
- Debenedetti (2003) P. G. Debenedetti, J. Phys.: Condens. Matter 15, R1669 (2003).
- Angell (2008) C. A. Angell, Science 319, 582 (2008).
- Roed (2012) L. A. Roed, Isochronal Superposition - an experimental test of a prediction from the isomorph theory, Master’s thesis, NSM, IMFUFA, Physics, Roskilde University, Denmark (2012).
- Niss, Jakobsen, and Olsen (2005) K. Niss, B. Jakobsen, and N. B. Olsen, J. Chem. Phys. 123, 234510 (2005).
- Hecksher et al. (2010) T. Hecksher, N. B. Olsen, K. Niss, and J. C. Dyre, J. Chem. Phys. 133, 174514 (2010).
- Jakobsen et al. (2012) B. Jakobsen, T. Hecksher, T. Christensen, N. B. Olsen, J. C. Dyre, and K. Niss, J. Chem. Phys. 136, 081102 (2012).
- Hecksher et al. (2013) T. Hecksher, N. B. Olsen, K. A. Nelson, J. C. Dyre, and T. Christensen, J. Chem. Phys. 138, 12A543 (2013).
- Gundermann (2013) D. Gundermann, Testing predictions of the isomorph theory by experiment, Ph.D. thesis, Roskilde University, DNRF Centre "Glass & Time", IMFUFA, NSM (2013).
- Xiao et al. (2015) W. Xiao, J. Tofteskov, T. V. Christensen, J. C. Dyre, and K. Niss, J. Non-Cryst. Solids 407, 190 (2015).
- Shoifet, Schulz, and Schick (2015) E. Shoifet, G. Schulz, and C. Schick, Thermochimica Acta 603, 227 (2015).
- Richert (1992) R. Richert, Chem. Phys. Lett. 199, 355 (1992).
- Leyser et al. (1995) H. Leyser, A. Schulte, W. Doster, and W. Petry, Phys. Rev. E 51, 5899 (1995).
- Naoki, Endou, and Matsumoto (1987) M. Naoki, H. Endou, and K. Matsumoto, J. Phys. Chem. 91, 4169 (1987).
- Birge, Dixon, and Menon (1997) N. O. Birge, P. K. Dixon, and N. Menon, Thermochim. Acta 304–305, 51 (1997).
- Christensen and Dyre (2008) T. Christensen and J. C. Dyre, Phys. Rev. E 78, 021501 (2008).
- Christensen, Olsen, and Dyre (2007) T. Christensen, N. B. Olsen, and J. C. Dyre, Phys. Rev. E 75, 041502 (2007).
- Note (2) The longitudinal volume specific heat is related to the isochoric specific heat () by where and respectively are the adiabatic and the isothermal bulk moduli, and is the shear modulus. At state points where relaxation occurs will differ from 0, which means that and differs. However, the difference in characteristic timescale is very small (see supplementary material of \rev@citealpnumjakobsen2012).
- Igarashi et al. (2008) B. Igarashi, T. Christensen, E. H. Larsen, N. B. Olsen, I. H. Pedersen, T. Rasmussen, and J. C. Dyre, Rev. Sci. Instrum. 79, 045106 (2008).
- Gnan et al. (2009) N. Gnan, T. B. Schrøder, U. R. Pedersen, N. P. Bailey, and J. C. Dyre, J. Chem. Phys. 131, 234504 (2009).
- Dyre (2014) J. C. Dyre, J. Phys. Chem. B 118, 10007 (2014).
- Schrøder and Dyre (2014) T. B. Schrøder and J. C. Dyre, J. Chem. Phys. 141, 204502 (2014).
- Ingebrigtsen, Schrøder, and Dyre (2012) T. S. Ingebrigtsen, T. B. Schrøder, and J. C. Dyre, Phys. Rev. X 2, 011011 (2012).
- Niss and Jakobsen (2003) K. Niss and B. Jakobsen, Dielectric and Shear Mechanical Relaxation in Glass Forming Liquids — A thorough analysis and experimental test of the DiMarzio-Bishop model, Master thesis, Roskilde University (2003), text nr. 424 in "Tekster fra IMFUFA".