Defying jet-gas alignment in two radio galaxies at z2 with extended light profiles: Similarities to brightest cluster galaxies ††thanks: Based on observations carried out with the Very Large Telescope of ESO under Program IDs 079.A-0617, 084.A-0324, 085.A-0897, and 090.A-0614.
We report the detection of extended warm ionized gas in two powerful high-redshift radio galaxies, NVSS J210626-314003 at z2.10 and TXS 2353-003 at z1.49, that does not appear to be associated with the radio jets. This is contrary to what would be expected from the alignment effect, a characteristic feature of distant, powerful radio galaxies at z0.6. The gas also has smaller velocity gradients and line widths than most other high-z radio galaxies with similar data. Both galaxies are part of a systematic study of 50 high-redshift radio galaxies with SINFONI, and are the only two that are characterized by the presence of high surface-brightness gas not associated with the jet axis and by the absence of such gas aligned with the jet. Both galaxies are spatially resolved with ISAAC broadband imaging covering the rest-frame R band, and have extended wings that cannot be attributed to line contamination. We argue that the gas and stellar properties of these galaxies are more akin to gas-rich brightest cluster galaxies in cool-core clusters than the general population of high-redshift radio galaxies at z2. In support of this interpretation, one of our sources, TXS 2353-003, for which we have H narrowband imaging, is associated with an overdensity of candidate H emitters by a factor of 8 relative to the field at z1.5. We discuss possible scenarios of the evolutionary state of these galaxies and the nature of their emission line gas within the context of cyclical AGN feedback.
Key Words.:
galaxies: formation, galaxies: high-redshift, quasars: emission lines, galaxies: kinematics and dynamics1 Introduction
Powerful radio galaxies at redshifts z1-2 (HzRGs) are particularly massive (several M⊙, e.g., Seymour et al., 2007; De Breuck et al., 2010), intensely star-forming (on the order of 1000 M⊙ yr-1 Archibald et al., 2001; Reuland et al., 2004; Seymour et al., 2012; Ivison et al., 2012; Barthel et al., 2012; Drouart et al., 2014), relatively evolved (Nesvadba et al., 2011a) galaxies. Many are surrounded by overdensities of satellite galaxies, making them interesting tracers of overdense regions in the early Universe that may ultimately evolve into massive, rich galaxy clusters (e.g., Chambers et al., 1996; Le Fevre et al., 1996; Kurk et al., 2004a; Venemans et al., 2007; Galametz et al., 2012; Wylezalek et al., 2013). Their co-moving number density corresponds to that of massive clusters, when corrected for duty-cycle effects (Venemans et al., 2007; Nesvadba et al., 2008). Particularly detailed studies of individual HzRGs suggest that at least one subset of this population could be the progenitors of the central galaxies in massive clusters in the nearby Universe (e.g., Hatch et al., 2009). They follow the low-redshift Kormendy relation of powerful radio and brightest cluster galaxies when allowing for passive luminosity evolution (Targett et al., 2011). Many HzRGs are themselves gas rich (e.g., van Ojik et al., 1997; Nesvadba et al., 2008; Ogle et al., 2012; Emonts et al., 2014), and while they have no well established, virialized halos of hot gas (Overzier et al., 2005), HzRGs do have extended (few 100 kpc) reservoirs of diffuse warm ionized gas (Villar-Martín et al., 2003) with embedded clouds or filaments of neutral (van Ojik et al., 1997; Adams et al., 2009) and molecular gas (Nesvadba et al., 2009; De Breuck et al., 2003; Emonts et al., 2014). As suggested by, e.g., Villar-Martín et al. (2003) these could be the vestiges of the gaseous reservoirs from which the brightest cluster and other galaxies formed.
The central, high surface-brightness regions of HzRGs are well fitted with de Vaucouleurs profiles with relatively large radii, R8 kpc (Targett et al., 2011), but extended, often irregular line and continuum emission in HzRGs is found preferentially along the radio jet axis (e.g., Cimatti et al., 1993). The reasons for this alignment effect are still not fully understood. Polarimetry suggests that light scattering on dust grains could be the origin of at least some of the extended continuum light; other authors favor jet-triggered star formation (Chambers et al., 1988; Klamer et al., 2005) as the cause of the extended continuum emission.
The kinematics in the extended gas around HzRGs are often strongly perturbed (e.g., Baum & McCarthy, 2000; Villar-Martín et al., 2003). SINFONI imaging spectroscopy showed this is the case in individual regions of these galaxies, and throughout their extended emission-line gas (Nesvadba et al., 2006, 2008). Warm ionized gas seems to be a major component of the ISM in these galaxies, with ionized gas masses of up to M⊙ in some cases (Nesvadba et al., 2008, 2006), comparable to the molecular gas masses found in some HzRGs (e.g., Emonts et al., 2014; Nesvadba et al., 2009; De Breuck et al., 2005). Broad line widths and abrupt velocity offsets of up to 2000 km s-1 found in this gas are not reconcilable with gravitational motion. Instead they suggest that a small part of the kinetic energy release from the AGN, through powerful radio jets, accelerates large fractions of the ISM in these galaxies to velocities well above the escape velocity from the underlying dark-matter halo, thereby driving winds and removing the fuel for subsequent star formation. This scenario is broadly supported by hydrodynamic models showing that jets may indeed accelerate relatively dense gas to the observed velocities of a few 100 km s-1 (Wagner et al., 2012).
Using VLT near-infrared imaging spectroscopy we have carried out a large survey of the rest-frame optical line emission of the warm ionized gas in a set of 50 radio-selected HzRGs at z2 spanning three orders of magnitude in radio power from a few times to a few times W Hz-1 at 1.4 GHz in the rest frame, and more than two orders of magnitude in radio size, from 1 kpc to about 300 kpc (Collet et al. 2015, submitted, Nesvadba et al. 2015, in prep.). Emission-line regions are well aligned with the radio jet axis in all but two galaxies with extended line emission, which in addition to kinematic, energy, and timing arguments suggests that this gas represents outflows of warm ionized gas driven by the overpressurized cocoon of hot plasma inflated by the radio source. These galaxies are described in greater detail in Nesvadba et al. (2006, 2007, 2008, 2011a) and Collet et al. (2015).
Here we discuss the two radio galaxies, TXS 2353003 and NVSS J210626314003, that do not follow these global trends. Their extended regions of warm ionized gas with similar surface brightness to the other sources show strong offsets in position angle to the radio jet axis, contrary to what is expected from the alignment effect and observed in the other galaxies within the SINFONI sample. Gas associated with the radio jet axis, if present at all, is not a distinctive component compared to gas along other directions in our SINFONI data. Gas that is seen in projection to be associated with the jet axis may or may not imply a physical association; however, it is clear that gas that is globally and significantly offset from the jet axis as projected on the sky is not reconcilable with a scenario where the gas is embedded in an overpressured cocoon inflated by the on-going jet activity. In addition, the line widths are low compared to the rest of our sample. Line widths near the nucleus are higher, and may be affected by the central radio source.
TXS 2353-003 and NVSS J210626-314003 are among the sources with the largest radio sizes in our sample, with largest angular sizes LAS38.8″ and 24.2″ at 4.86 GHz (De Breuck et al., 2001) and 2.368 GHz, respectively (corresponding to 310 kpc and 190 kpc at their redshifts of z=1.49 and z=2.10, respectively). Both have very regular centimeter radio morphologies (Collet et al. 2015, Nesvadba et al. 2015 in prep.), and do not have bright radio cores. Both are associated with overdensities seen in projection along nearby lines of sight of distant (z1.3) IRAC sources in the CARLA survey of Wylezalek et al. (2013). TXS 2353-003 is within the densest region of their overall sample of 200 HzRGs. We highlight the similarities between our galaxies and brightest cluster galaxies at low redshift, including the extended emission-line gas, which resembles the warm ionized gas in and around the central galaxies of cool-core clusters in several respects.
We describe our SINFONI and ISAAC observations and data reduction in §2, and discuss the results of these observations in §3 for the line emission and in §4 for the continuum, where we also fit surface brightness profiles. In §5 we present our narrowband search for line emitters around TXS 2353-003 and argue that this galaxy is surrounded by an overdensity of line emitters, like many other HzRGs at somewhat greater redshifts. We compare these results with the IRAC results obtained as part of the CARLA survey (Wylezalek et al., 2013) in §6. In §7 we discuss several hypotheses regarding the nature of the emission-line regions in these two galaxies, which, given their strong misalignment relative to the jet axis, are unlikely to be directly associated with an expanding cocoon driving an outflow. We summarize our results in §8. Throughout our analysis we adopt a flat cosmology with H0 = 70 km s-1 Mpc-1, =0.7, . For NVSS J210626-314003 at z=2.1, this corresponds to D 16.6 Gpc, and for TXS 2353003 at z=1.49 to DL=10.8 Gpc, respectively; 1″ corresponds to 8.4 kpc for both galaxies.
2 Observations and data reduction
2.1 VLT/SINFONI imaging spectroscopy
We observed both galaxies with the near-infrared imaging spectrograph SINFONI on UT 4 of the Very Large Telescope (VLT) of ESO. The NVSS J210626-314003 data were taken on 2009 October 12, and those of TXS 2353-003 on 2010 August 13. The data were obtained as part of a comprehensive observational program to study the emission-line gas kinematics of 50 powerful radio galaxies at z2. We used the HK band covering a spectral range of 1.45-2.45m at a spectral resolving power R1500. The data were taken during good to moderate observing conditions, with a typical point spread function of 1″1″ along right ascension and declination, dominated by the seeing. We used the 250 mas pixel scales with a field of view of 8″8″, covering a field of 67 kpc67 kpc at z2.
Total integration times were 145 min for TXS 2353-003 and 120 min for NVSS J210626-314003, and were obtained in one-hour sequences of individual 300 s exposures. Our data reduction relied on a combination of IRAF and IDL routines (for details see, e.g., Nesvadba et al., 2011a, b). The absolute flux scale was measured by comparing our data with observations of standard stars with known magnitudes from the 2MASS survey that were observed at the end of each observing session. We also determined the size of the seeing disk from these stars.
2.2 VLT/ISAAC imaging
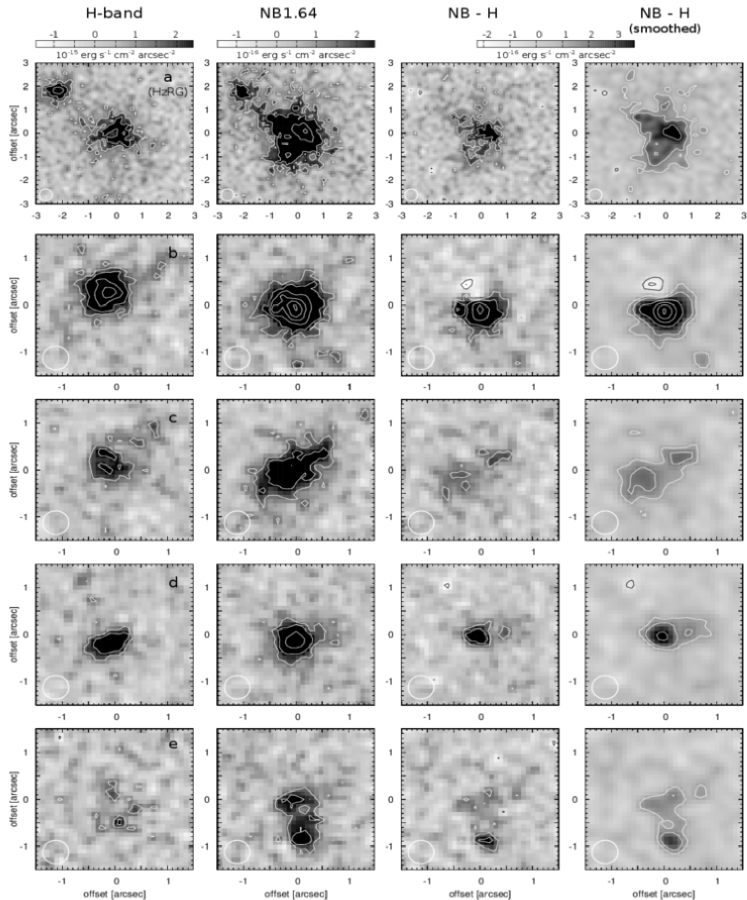
Both galaxies were also observed with ISAAC on UT 3 of the VLT between 2012 September 30 and 2012 October 2 through the service-mode program 090.A-0614. TXS 2353003 was observed in the H band and through the narrowband FeII filter (NB 1.64) with FWHMm (corresponding to a velocity range of 4570 km s-1), so we cover H and [NII] at z1.49. NVSS J210626-314003 was only observed in the Ks band. Both broadband images cover roughly the rest-frame R band.
With the NB 1.64 filter we obtained a total of 248 minutes of on-source observing time of TXS 2353003 split into 99 exposures with individual observing times of 150 seconds, and grouped into observing sequences of one hour each. After visual inspection we discarded 17 of these frames because of residuals from a strongly saturated star. The on-source observing time was thus 205 minutes.
In the H band we obtained 29 exposures for TXS 2353-003 with individual observing times of 72 seconds, corresponding to six detector readouts after 12 seconds. We discarded one frame which contained the trail of a satellite. In the K band for NVSS J210626314003, we obtained 25 exposures of 90 seconds, corresponding to six detector readouts after 15 seconds. Total observing times in the H and K bands were therefore 35 minutes and 38 minutes for TXS 2353003 and NVSS J210626314003, respectively.
Data were dark-subtracted and flat-fielded, where we constructed the
sky flats directly from the science data. All frames were then
combined with the IRAF task dimsum }. Flu calibration relied
on standard stars observed during the same night and at similar air
mass to the science data. We used the Starlink GAIA software
(Draper et al., 2014) to calculate the astrometry relative to 2MASS
reaching rms0.07″ for TXS 2353003, and
rms0.3″ for NVSS J210626314003, respectively. We also
used 2MASS to verify our flux calibration, finding a good agreement
within 10%. The sizes of stars in the image suggest the seeing
was FWHM0.5″ in the H-band and NB 1.64 image of
TXS 2353003, and of FWHM0.4″ in the Ks-band image of
NVSS J210626-314003. The limiting rms surface brightness in these images
is 26.2 mag arcsec-2 and 23.6 mag arcsec-2 in the narrow
and broadband image of TXS 2353003, respectively. For the Ks-band
image of NVSS J210626314003, we find 23.7 mag arcsec-2.
2.3 Narrowband observations of TXS 2353003
To construct a continuum-subtracted line image from the narrowband image of TXS 2353-003, we approximate the underlying continuum in the narrowband filter by a scaled version of the flux measured through the broadband filter, taking into account the relative filter bandwidths of the narrow and broadband filters, and their transmission. Here we assume that the continuum is flat and uniform across the H-band filter.
We measured the zero points in the narrowband filter from standard stars. From the zero points in each filter, filter bandwidths, and transmissions of the narrow and broadband filters, we determine that the continuum flux density observed through the narrowband image corresponds to about 7.2% of the flux density measured through the broadband image. We would therefore need to scale the broadband image by this value before subtracting it from the narrowband image to obtain the flux density from the emission lines. When directly comparing the flux density of 12 stars in both images, we empirically find that a very similar scaling factor of 7.6% is best to minimize the residuals of the stellar continuum after the subtraction, and this is the factor that we used.
The redshifted wavelength of H in the radio galaxy is slightly blueshifted relative to the wavelength of peak throughput of the narrowband filter. Comparing this with the flux measured in the SINFONI data cube, and assuming that the relative flux calibration between both images is perfect, we find that we are missing between 20 and 25% of the line flux in the continuum-subtracted line image. For other H emitters (§5), for which we have no precise redshift estimates, we would first need to obtain spectroscopy before we can make similar corrections.
To evaluate the completeness limit of our data, we added faint artificial sources with the size of the seeing disk at sky positions in each frame of the narrow- and broadband images before re-reducing these data and extracting sources in the same way as for the final scientific analysis. We used fluxes between 2 and 11 times the rms in the central regions of the image. Adding the artificial sources to the individual frames rather than the final image helps to take misalignments between frames into account. We find that we recover 90% of sources with surface brightness above erg s-1 cm-2 Å-1 arcsec-2 (or above 23.6 magAB arcsec-2).
3 Imaging spectroscopy of the warm ionized gas
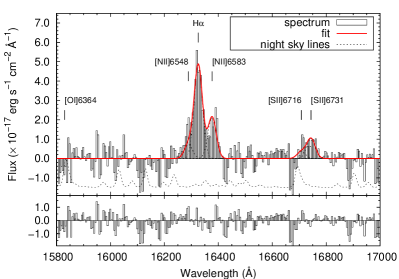
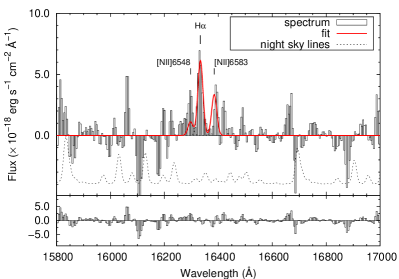
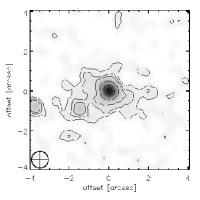
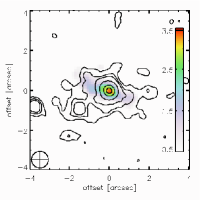
The SINFONI maps of NVSS J210626-314003 and TXS 2353-003 are shown in Figs. 1 and 2, respectively. In NVSS J210626314003 at z2.104, [OIII]4959,5007 and H fall into the H band, and H, [NII], and [SII] fall into the K band, both of which we cover with our data cubes. In TXS 2353003, we identify H and [NII] at wavelengths corresponding to a redshift of z1.49. At this redshift, [OIII] and H fall at redshifts below the lower wavelength cutoff of our grating, m.
Our redshift measurement for TXS 2353-003 does not agree with the previous redshift of z2.59 measured with longslit spectroscopy, which was thought to have detected Ly in the observed optical wavelength range (De Breuck et al., 2001), but was in hindsight probably affected by a Cosmic ray. We did not identify any possible emission line consistent with the previous redshift z2.59, although [OIII]4959,5007 and H should fall into the H band, and [NII]6548,6583, and H should fall into the K band at that redshift. The rest-frame UV spectrum shows no other line candidate consistent with z2.59; the value for Ly at the redshift we measure here falls well below the UV atmospheric cutoff.
Both galaxies have bright, spatially well-resolved line emission. We fitted the extended line emission in both galaxies with single Gaussian profiles. Spectra were extracted from small apertures of 0.4″0.4″, which helps to reduce the strongest pixel-to-pixel noise while safely oversampling the seeing disk so that no spatial information is lost. The data were also smoothed in the spectral direction by three pixels, without loss of spectral resolution. Our fitting routine interpolates over wavelength ranges dominated by bright night-sky line residuals, and we only map spatial pixels where a line was detected at a S/N 3.
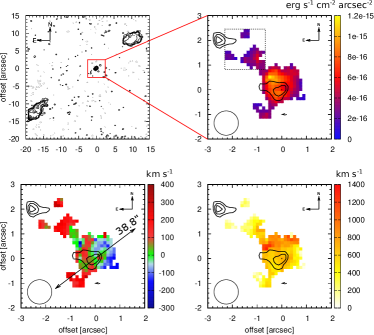
Line emission extends beyond the bright continuum seen in the SINFONI cubes (but not in the ISAAC broadband image which we will discuss later in more detail and show in Figs. 7 and 8, which is deeper in the continuum). The sizes of the extended emission-line regions of NVSS J210626-314003 and TXS 2353003 are 5.3″2.0″ (44 kpc17 kpc) and 2.5″2.0″(21 kpc17 kpc) along the major and minor axis, respectively, and down to surface-brightness limits of erg s-1 cm-2 arcsec-2 and erg s-1 cm-2 arcsec-2.
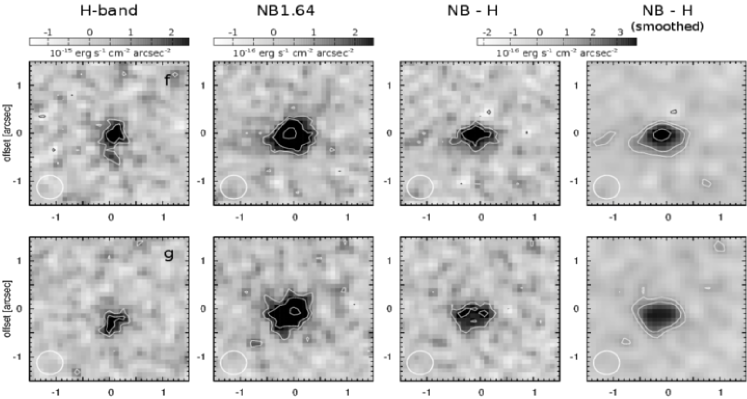
In NVSS J210626314003 the emission-line region is roughly centered on the continuum peak. In TXS 2353003, the gas appears more lopsided. This is also seen in the continuum-subtracted ISAAC narrowband image (source in Fig. 12). The morphology of the ionized gas in both observations is fairly consistent: a bright emission-line region associated with the radio galaxy, more extended toward the southeast and northwest. The integrated spectrum extracted from this fainter region, shown as a dashed region in Fig. 1, clearly shows H and [NII]6583 (Fig. 3). Fluxes and other line properties are listed for both galaxies in Table 1. In TXS 2353003, we note a faint continuum emitter along the direction of extended gas, but at a larger distance. In NVSS J210626314003 no further continuum source is observed along the major axis of the emission-line region.
In the SINFONI cube, NVSS 210626-3134003 shows a smooth velocity gradient of about 600 km s-1 over 25 kpc. In TXS 2353003 we observe a more irregular velocity pattern, which could be at least in part due to the lower signal-to-noise ratio and irregular line profiles. In NVSS J210626-3134003, where we observe [OIII]5007 and H at good signal-to-noise ratios, the gas kinematics and morphologies are similar in both lines.
Both galaxies have broad line widths with FWHM800 km s-1 around the continuum peak which we associate with the central regions of the galaxies. These lines are broader than those of star-forming galaxies at similar redshifts, including the most massive, intensely star-forming dusty galaxies such as submillimeter galaxies (e.g., Swinbank et al., 2006), and are consistent with those found in other powerful radio galaxies at similar redshifts (e.g., Nesvadba et al., 2008; Collet et al., 2015). Following the arguments given in these studies, we consider the broad line widths as evidence that the gas in the central regions of our sources is stirred up by the transfer of kinetic energy from the radio source.
The gas kinematics at larger radii are more quiescent in both sources. Line widths in the extended gas of NVSS J210626-314003 and TXS 2353-003 are FWHM300-400 km s-1 (Figs. 1 and 2), more akin to those observed in a quasar illumination cone at z2 (Lehnert et al., 2009) and Ly blobs without a powerful central radio source (e.g., Wilman et al., 2005; Overzier et al., 2013), than to powerful radio galaxies, including the central regions of our two sources here.
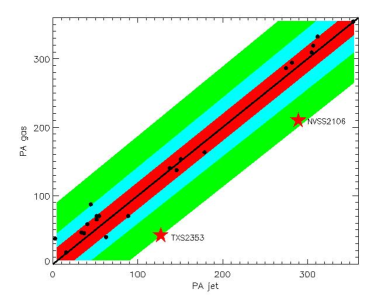
A marked difference to other HzRGs with similar data is that most of the emitting gas is at large position angles from the radio jet axis. Typically, the jet axis and the semi-major axis of the gas are aligned within about 20∘-30∘ (Fig. 4, see also Collet et al. 2015, Nesvadba et al. 2015 in prep.). Given the size of the minor axis of the extended line emission of up to kpc and beam smearing effects in the radio and near-infrared, this range is on the order of what would be expected if gas and jet were associated with each other, for example, if the jet inflated a hot bubble of overpressurized gas like in the cocoon model (Begelman & Cioffi, 1989). In NVSS J210626314003 and TXS 2353003; however, the relative position angle between extended gas and radio jet axis is much larger, 60∘ and 90∘, respectively, and the jet is not embedded within the emission line gas, as expected from a cocoon inflated by the jet. Figure 4 shows that both galaxies clearly stand out from the overall sample of HzRGs with SINFONI observations.
3.1 Line diagnostics
The ratios of bright optical line emission provide important constraints on the ionizing source and other gas properties in the extended emission-line regions of galaxies (Baldwin et al., 1981; Veilleux & Osterbrock, 1987; Kewley et al., 2006). Collet et al. (2015) discussed the emission-line ratios of NVSS J2106-314003 in the context of their overall sample of moderately powerful HzRGs, finding [NII]/H and [OIII]/H ratios that correspond to neither the classical starburst nor the AGN branch. They investigate several potential reasons for this, including low metallicites, relatively diffuse gas clouds, high gas pressures, or a mixture of heating from shocks and photoionization. In TXS 2353-003, we only have [NII] and H measured with a fairly high ratio of [NII]/H=0.7 in the extended gas (Fig. 3), which alone is sufficient to safely attribute the line emission to either shocks or photoionization from the AGN (Fig. 5). Off-axis gas not aligned with the radio jet axis and out to a galactocentric radius of 65 kpc in the radio galaxy 3C265 at z=0.8 may indeed be powered by shocks, perhaps with additional photoionization from soft X-ray emission from the precursor of the shock (Solórzano-Iñarrea et al., 2002). However, as argued by Le Tiran et al. (2011) and Nesvadba et al. (2006), it is difficult to reach high H surface brightnesses as observed with shocks. The same is the case for shock-heated, likely infalling clouds in the cluster central galaxy NGC 4696 (Farage et al., 2010).
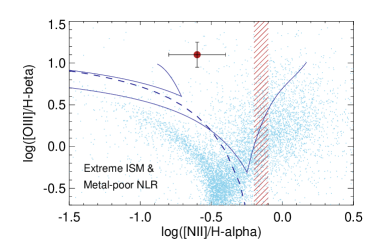
Like TXS 2353-003, NVSS J210626-314003 also falls outside the star formation branch; however, it also falls outside the sequence formed by low-redshift AGN in the SDSS. The line ratios are consistent with low-metallicity gas photoionized by an AGN, as expected in the models of Groves et al. (2006) and Kewley et al. (2013), and as shown with the solid blue lines in Fig. 5. These lines show the range of line ratios expected for galaxies at z=1.5 with intense star formation typical for galaxies at these redshifts, and AGN with metal-poor narrow line regions and a metal enrichment history predicted by cosmological models of galaxy evolution (Davé et al., 2011). These conditions are referred to as “model 4” by Kewley et al. (2013). J-band spectroscopy would be required to investigate whether TXS 2355-003 falls onto the low-redshift AGN branch or above.
4 Continuum morphologies
4.1 Line-free continuum images from SINFONI
We also constructed line-free continuum images from our SINFONI cubes (shown as contours in Figs. 1 and 2) for both galaxies by collapsing the data cubes along the spectral direction over all wavelengths that are free from emission lines and prominent night-sky line residuals. We consider the continuum peak in the cube to be the location of the galaxy nucleus, which may be dominated either by stellar light or the AGN. At a projected distance of about 3″ (24 kpc) northeast of TXS 2353-003, we find another, fainter H-band source. We do not detect any line emission from this galaxy, so we cannot determine whether it is physically associated with the radio galaxy, or an interloper along the line of sight. NVSS J210626314003 appears to be an isolated source, except for two much fainter sources at 1.7″ and 3.9″ toward the southeast (corresponding to projected separations of 14.3 kpc and 32.8 kpc at z2.1, respectively), which however are not aligned with the extended emission-line regions. We do not detect any line emission from the nearer source, and the more distant source falls outside the field of view of SINFONI. It is therefore not clear if they are associated with the radio galaxy. For TXS 2353-003, for which we do not have broadband K-band imaging, we measure a K-band magnitude of 18.10.2 mag from our SINFONI data cube within a 3″ aperture.
4.2 ISAAC broadband imaging
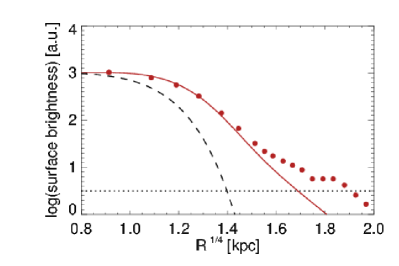
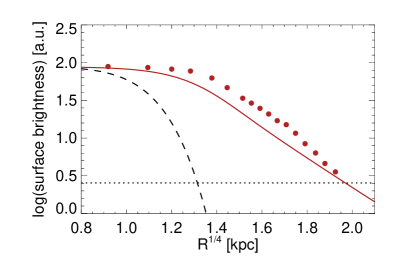
In Figs. 7 and 8, we have already shown the rest-frame R-band morphologies of TXS 2353003 and NVSS J210626-314003 observed in the H and Ks band, respectively. Both galaxies are clearly spatially resolved, even with ground-based, seeing-limited images. This is best seen in Fig. 6 which shows the azimuthally averaged surface-brightness profiles of both sources compared to the profiles of nearby stars taken from the same images, showing a clear excess of continuum emission out to large radii in both galaxies.
Both galaxies have a bright central region (which is more regular in NVSS J210626-314003 than in TXS 2353003) surrounded by extended, low-surface-brightness halos. This is remarkable, given that the general population of passively evolving early-type galaxies at high redshift tends to be more compact than their local analogs (e.g., Daddi et al., 2005; van Dokkum et al., 2008; Schawinski et al., 2011; Whitaker et al., 2012). Furthermore, although about 1/3 of HzRGs are still actively star-forming (Drouart et al., 2014), their molecular gas reservoirs of a few M⊙ (e.g., Emonts et al., 2014) compared to few M⊙ of stellar mass (Seymour et al., 2007; De Breuck et al., 2010) suggest that most of their stellar mass growth has already been completed. Targett et al. (2011) found extended broadband emission when stacking 13 HzRGs at redshifts between z=1.5 and 2.0 (as did Best et al., 1998, at slightly lower redshifts). However, only Hatch et al. (2009) have so far reported a qualitatively similar surface-brightness profile in an individual radio galaxy, MRC 1138262 at z=2.16. Previous studies, e.g., Pentericci et al. (2001), have drawn attention to the irregularity of broadband morphologies in many cases, which they attributed to the presence of on-going mergers.
4.3 Surface brightness profiles
Both galaxies are spatially resolved into four or five resolution elements in the ISAAC images, which enables us to do a basic analysis of their surface-brightness profiles shown in Fig. 6. The goal of this analysis is to demonstrate that the extended low-surface brightness regions seen in the broadband images are not just the faint extensions of the surface-brightness profiles of the central regions, but separate components of the light profiles. We are mainly interested in whether (and over what radii) the profiles are consistent with the or de Vaucouleurs profile typical of early-type galaxies, corresponding to a Sersic profile with index n4 (Sérsic, 1963, 1968).
The profiles shown in
Fig. 6 were obtained
with the IRAF task Ellipse (Freudling, 1993), measuring
the surface brightness in circumnuclear elliptical annuli with radii
increasing in steps of 0.1″. Ellipse fits the ellipticity
of these annuli, finding between 0.05 and 0.4 in our case. Solid red
lines in Fig. 6 show the
expected curves of n4 Sersic profiles that match the central
1″ of the light profile, with effective radii R261 kpc
and R15 kpc for TXS 2353-003 and NVSS J21062-314003,
respectively. These effective radii are consistent with those we
found with two-dimensional fits using Galfit (Peng et al., 2002, 2010), which we ran on images that were slightly smoothed to
minimize pixel-to-pixel noise (by convolution with a 33 pixel
Gaussian) and where we left all parameters free, except imposing that
n4.
The comparison between the expected profiles for n4 and the observations shown in Fig. 6 illustrates that only the inner regions of NVSS J210626314003 can be fitted with a de Vaucouleurs profile, with radius kpc. However, the extended halo produces residuals greater than . For TXS 2353003, the surface-brightness contrast between the central regions and the extended outer halo is lower, resulting in a very large size of kpc for a de Vaucouleurs profile, which matches the central and outermost isophotes, but also leads to significant residuals at intermediate radii. This is in agreement with the visual impression that only NVSS J210626314003 has a distinctive, high-surface brightness core, whereas TXS 2353003 is more diffuse. High-resolution imaging with the Hubble Space Telescope, for example, would be needed for a full analysis of the surface-brightness profiles in the inner regions of our galaxies. Nonetheless, these results already show that both galaxies show important departures from simple de Vaucouleurs profiles at intermediate and large radii. Such extended wings are characteristic of central cluster galaxies (e.g., Schombert, 1987).
4.4 Line contamination
Line emission in high-z radio galaxies can reach high equivalent widths and might therefore be a significant contaminant in morphology measurements through broadband filters (Pentericci et al., 2001; Nesvadba et al., 2008; Targett et al., 2011). We will now investigate the significance of this contamination in our analysis.
¿From our SINFONI imaging spectroscopy we know the line fluxes of the most prominent optical emission lines in both galaxies, H, [NII]6548,6583, and [OIII]4959,5007. In TXS 2353-003, the combined flux of all emission lines in the H band reaches an average surface brightness of erg s-1 cm-2 arcsec-2 in a 2.15″ aperture around the center of the galaxy, and erg s-1 cm-2 arcsec-2 along the northeastern extension. Outside this region, line emission is not detected and must therefore be below the 3 upper surface-brightness limit of erg s-1 cm-2 arcsec-2.
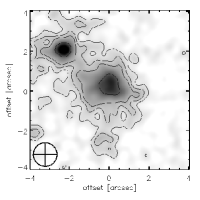
The broadband morphology of TXS 2353003 is shown in the left panel of Fig. 7 as a gray scale image and contours. The image was convolved with a two-dimensional Gaussian to a resolution of 1.2″, to match the size of the seeing disk of the H and [NII]6583 line image shown in the right panel of Fig. 7, and to enhance the contrast of the faint extended emission in the broadband image against the background noise.
The right panel of Fig. 7 shows the H+[NII] line image of TXS 2353003, obtained by collapsing the data cube along the spectral direction over wavelengths where H+[NII] is detected. This makes the line morphology measurement more robust than the maps obtained from Gaussian fits to each individual pixel, in particular in the faint outer parts of the emission-line regions, and allows the measurement of the upper limits from the same image that is also used to estimate the emission-line surface brightness. Dividing by the 2700 Å width of the H-band filter of ISAAC111http://www.eso.org/sci/facilities/paranal/decommissioned/ isaac/inst/isaac_img.html, we find that line emission contributes on average 2.75 10-19 erg s-1 cm-2 arcsec-2 Å-1 to the measured flux density in the H band near the center of TXS 2353003, and of erg s-1 cm-2 arcsec-2 Å-1 in the northeastern periphery. Outside this extended emission-line region, the flux densities from emission lines drop to below erg s-1 cm-2 arcsec-2 Å-1 (our 3 limit). H-band surface brightnesses at the location of the extended H emission-line region are above erg s-1 cm-2 Å-1 arcsec-2, which suggests that line contamination does not dominate the overall broadband morphology of TXS 2353003.
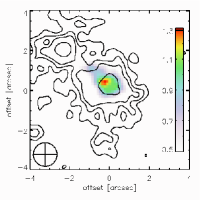
The broadband image of NVSS J210626314004 is shown in Fig. 8 as a gray scale image with contours (left panel), and as contours on top of the H and [NII] line image (right panel), which was constructed in the same way as described above for TXS 2353003. The line emission is closely approximated by Gaussian line profiles, and we therefore use the emission-line map derived from those fits and shown in Fig. 2. In a 2.15″ aperture around the nucleus, we find an average surface brightness of H and [NII] of erg s-1 cm-2 arsec-2 and erg s-1 cm-2 arcsec-2 in the periphery, respectively. This corresponds to a surface flux density of and erg s-1 cm-2 Å-1 arcsec-2, respectively, after dividing by the filter width of the ISAAC K-band filter, 3000 Å1. Outside the ridge of extended line emission, the K-band flux densities from the lines drop to below erg s-1 cm-2 Å-1 arcsec-2 (our 3 limit on the emission-line surface brightness).
Line emission in NVSS J210626314003 extends over regions of broadband isophotes of erg s-1 cm-2 and brighter (Fig. 8). This comparison suggests that, outside the brightest areas seen in the H line image near the galaxy center, line emission is not a major contaminant of the broadband morphology in NVSS J210626314003.
The diffuse Ly halos discovered by Villar-Martín et al. (2002) and Villar-Martín et al. (2003) would also produce fainter emission-line surface brightnesses than we observe here. For a typical erg s-1 cm-2 arcsec-2, we would expect H surface brightnesses between erg s-1 cm-2 arcsec-2, assuming typical Ly/H ratios of 813 (Villar-Martín et al., 2003). Dividing by the 2700Å filter width of the ISAAC H-band filter, this would correspond to erg s-1 cm-2 Å-1 arcsec-2, much lower than the surface brightness seen in the broadband filter.
5 H candidates surrounding TXS 2353-003
Narrowband imaging is a standard way of identifying emission-line galaxies at high redshifts, and has been successfully used to identify over-densities of actively star-forming galaxies around high-redshift galaxies for almost two decades (e.g., Chambers et al., 1996; Le Fevre et al., 1996; Kurk et al., 2004a; Venemans et al., 2007; Hatch et al., 2011; Koyama et al., 2013; Hayashi et al., 2012; Cooke et al., 2014). Most of these observations were carried out for HzRGs at z2, where H falls in the K band, which is relatively free from telluric night-sky lines.
We also obtained H narrow-band imaging of TXS 2353-003, where H falls fortuitously into the NB 1.64 filter (although not perfectly into the center). Our main goal was to search for possible bright emission-line gas outside the small SINFONI field of view of 8”x8”, that would be associated with the environment rather than the radio galaxy itself. This also enables us to identify emission-line galaxies that are within the same dark-matter environment, and within a velocity range of 1580 km s-1 to 3000 km s-1 from the HzRG. Typical galaxy overdensities around HzRGs have velocity dispersions of 900 km s-1 (Venemans et al., 2007), which suggests that the asymmetry of the velocity range in our case does not hinder our detection of a potential overdensity of line emitters around the radio galaxy out to several times the velocity dispersion of the cluster. We present the results of both parts of this narrow-line imaging project in this section.
5.1 Identification of candidate H emitters
We identified candidate emission-line galaxies associated with the dark-matter environment of TXS 2353-003 candidate HAEs in two different ways. The first is a method introduced by Bunker et al. (1995) that searches for a flux excess in the narrow compared to the broadband image, and the second is the direct inspection of the continuum-subtracted line image described in §2.3.
For the flux excess method of Bunker et al. (1995), we used SExtractor
v.2.5.0 (Bertin & Arnouts, 1996) to construct catalogs from the
narrow- and broadband images, setting the parameters
DETECT_THRESH = 2.0 and ANALYSIS_THRESH = 2.0, while
leaving all others at their default values. We then take the positions
of the galaxies in the catalog extracted from the broadband image to
perform aperture photometry within 2″ apertures in both
images. Using fixed apertures is appropriate for marginally or
unresolved galaxies like ours, and has the advantage of providing
errors that are independent of galaxy size (see
also Kurk et al., 2004a). Selecting our candidates from the broadband image, rather
than the narrowband, is different from many other narrowband
searches, but makes our selection particularly robust, since it
requires independent detections in two images. The disadvantage is
that we might miss galaxies with particularly high emission-line
equivalent widths. However, comparison of the catalogs extracted from
the two images shows that this was not the case in our analysis.
We use the “significance of excess”, , as defined by Bunker et al. (1995), i.e., “the number of standard deviations between the counts measured in the broadband and the number expected on the basis of the narrowband counts (assuming a flat spectrum)”, to select the best H candidates. In addition, and again following Bunker et al. (1995) we require that the sources fall above a given equivalent width threshold. Following Kurk et al. (2004a), we choose EW50Å and 25Å. These thresholds correspond to broad- and narrowband colors of 0.38 and 0.17, respectively. Three sources with even have EWÅ, including the radio galaxy, which corresponds to a broad- to narrowband color of 0.69.
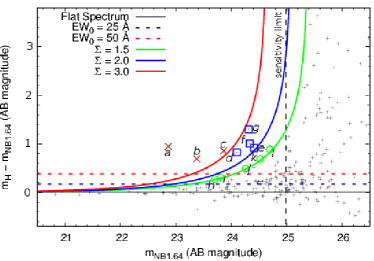
The resulting color-magnitude diagram is shown in Fig. 9. We find seven sources with and Å. We also show another seven H candidates that have somewhat lower excess significances 1.5-2.0. A fraction of these are probably part of the overdensity of TXS 2353-003. However, the fraction of misidentifications due to larger spectral slopes, for example, is likely to be larger among these sources, which is why we restrict our analysis to the most robust candidates above 2.0.
5.2 An overdensity of H candidates around TXS 2353003
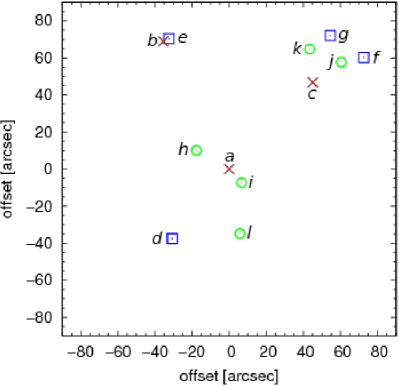
Given the relatively good seeing of our narrowband data of 0.4″, most H candidates are spatially resolved (Fig. 12) and we estimate H equivalent widths of 50250 Å in the rest frame, corresponding to H fluxes between about 1 and a few erg s-1 cm-2. Their properties are listed in Table 2. We did not correct the H flux and equivalent widths for [NII] emission, which should fall into the same filter. Observations of UV/optically selected galaxies at high redshift typically show very low [NII]/H line ratios on the order of 10% (e.g., Förster Schreiber et al., 2009; Lehnert et al., 2009; Queyrel et al., 2012). Using the conversion of Kennicutt (1998) with a M⊙ Salpeter initial mass function, we find star formation rates of 16-35 M⊙ yr-1 per galaxy, and a moderate total star formation rate of 138 M⊙ yr-1 in these galaxies combined. These values were not corrected for extinction, so intrinsic star formation rates could be higher. For example, Garn et al. (2010) and Stott et al. (2013) typically find 1 mag extinction in H-alpha meaning that intrinsic star formation rates are probably a factor of 2.5 times higher. The expected fraction of low-redshift interlopers is much lower in our case than for narrowband searches using Ly. The brightest emission lines longward of H are the Paschen and Brackett hydrogen lines in the near-infrared, with typically much lower equivalent widths than H.
To quantify whether the observed number of H candidates around TXS 2353-003 may herald an overdensity of galaxies, we have to compare our data with samples of H emitters in the field at the same epoch. A blind redshift search for HAEs at z = 1.48 has recently been performed by Sobral et al. (2013) through the NB 1.617 filter at UKIRT, which has a very similar width of 210 Å (compared to 250 Å for our ISAAC filter), that we use as reference for the expected source density in the field. The HiZEL survey (Sobral et al., 2009, 2010, 2012, 2013) gives an estimate of the H emitters that we can expect in a blank field: Sobral et al. (2012) concentrated on H emitters at z 1.47, very close to the z=1.49 of TXS 2353003. They found 295 NB emitters over the 0.67 deg2 field of their main analysis, and 411 over the entire 0.79 deg2 field of their NB observations. Among them, 190 objects also show an excess in deep NB imaging centered on the [OII] emission line and have colors compatible with a photometric redshift z 1.47. This leads to densities of candidate HAEs in the field of 0.14 HAE arcmin-2 (with all NB emitters) ; 0.12 HAE arcmin-2 (with NB emitters in their main field) and 0.08 HAE arcmin-2 (with NB emitters having an adequate photometric redshift). These values include galaxies down to a 3 flux level of erg s-1 cm-2, compared to erg s-1 cm-2 in our case.
Around TXS 2353003, with an effective field of view of 5.4 arcmin2 (neglecting the trimmed edges where our data did not reach the full depth) we find six H emitting candidates with fluxes erg s-1 cm-2 and significances 2.0 in addition to the radio galaxy. This corresponds to a source density of 1.1 arcmin-2, and an overdensity by a factor 8 relative to the field.
Kurk et al. (2004b) detected 28 HAEs in two ISAAC pointings around MRC 1138-262 at z = 2.16 down to an H flux limit of erg s-1 cm-2, which corresponds to the same luminosity limit as the current analysis. They found a source density of 2.2 arcmin-2. Although our source density at z1.5 is lower than that in the z2.16 overdensity around MRC 1138-262 in absolute terms, the significance of the overdensity relative to the field at the same epoch is high, because the star formation rate density at z = 1.5 in the field is already strongly declining for the highest H luminosities (e.g., Sobral et al., 2013).
Finding high surface-brightness gas out to the periphery of our SINFONI data cube raises the question whether there is similarly bright line emission outside the small, 8″8″ field of view of SINFONI (67 kpc67 kpc at z=1.49). We do not find any such emission down to a 3 detection limit of erg s-1 cm-2 Å-1 in the continuum subtracted narrowband image. With the 250Å width of the NB1.64 filter, and cosmological surface-brightness dimming by a factor , we are sensitive to the equivalent of erg s-1 cm-2 arcsec-2 in nearby clusters. This is more than an order of magnitude fainter than the surface brightness observed, e.g., in parts of the filaments in the Perseus cluster (Hatch et al., 2007).
6 Comparison of TXS 2353-003 and NVSS J210620-214003 with cluster central galaxies
High-redshift radio galaxies do not often reside in solitude, but are surrounded by overdensities of line or continuum emitters, suggesting that a significant fraction of the HzRG population may be the progenitors of the central galaxies of massive galaxy clusters (e.g., Chambers et al., 1996; Le Fevre et al., 1996; Kurk et al., 2004a; Venemans et al., 2007; Galametz et al., 2012). Wylezalek et al. (2013) obtained Spitzer warm-mission IRAC photometry at 3.6m and 4.5m of 200 HzRGs, including our two sources. They find that, compared to the Spitzer UKDSS Ultra Deep Survey (Kim et al., 2011), 55% of HzRGs are surrounded by overdensities of galaxies with colors between the 3.6m and 4.5m channels that are consistent with redshifts z1.3. Like any method identifying galaxy overdensities, however, the IRAC color selection only samples parts of the population of putative satellite galaxies around HzRGs, and can therefore only provide lower limits to the actual density of such galaxies around a particular HzRG. It can therefore only demonstrate the presence, but not the absence of such an overdensity of galaxies around a given radio galaxy.
Wylezalek et al. (2013) show that TXS 2353-003 is surrounded by one of the highest overdensities of IRAC-selected sources, with an excess of , and consistent with the results of our narrowband search presented in §5. NVSS J210626-314003, however, does not stand out as a source with a particularly dense environment of IRAC-selected sources in the Wylezalek et al. (2013) sample, a 1.2 excess. Unfortunately, the observing program committee of ESO only granted us narrowband imaging of TXS 2353-003, not of NVSS J210626-314003, so that we were unable to do a narrowband search around this galaxy. We note, however, that selecting a galaxy based on its bright radio emission already leads to significant biases toward galaxies in dense environments (e.g., Best, 2000; Ramos Almeida et al., 2013; Hatch et al., 2014), and we argue in the following that the stellar component of NVSS J210626-314003 itself shows some of the characteristic signatures of cluster central galaxies.
6.1 Kz relationship
Kauffmann & Charlot (1998) argued that the observed K-band magnitude can be used to approximate the stellar mass of all but the most rapidly growing galaxies out to redshifts z2, with a scatter of about a factor of 2. This is consistent with the empirical tight K-z relationship between observed K-band magnitudes of powerful radio galaxies and their redshifts (Lilly & Longair, 1984; De Breuck et al., 2002; Willott et al., 2003; Bryant et al., 2009) and the small mass range of these galaxies in the Spitzer photometric survey of HzRGs by Seymour et al. (2007) and De Breuck et al. (2010).
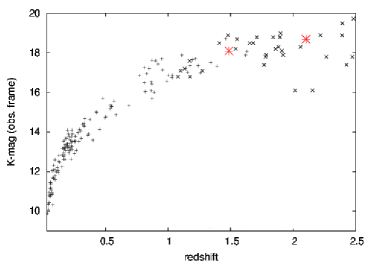
In Fig. 11 we show where TXS 2353003 and NVSS J210626314003 fall relative to the K-z relationship of Seymour et al. (2007) and De Breuck et al. (2010), and that of Lidman et al. (2012), who found a similar relationship for brightest cluster galaxies (BCGs). This figure shows the good agreement of our targets with both samples, as well as the self-consistency of both samples with each other (as expected if HzRGs are the progenitors of BCGs).
Encouraged by the results of Kauffmann & Charlot (1998); Seymour et al. (2007), and De Breuck et al. (2010), which, when considered together, suggest that the observed K-band magnitude of HzRGs should scale with the stellar mass, we used the K-band magnitudes of HzRGs in the Seymour et al. (2007) sample and the stellar mass estimates given in the same paper, to obtain a simple empirical relationship between stellar mass, , and observed K-band magnitude, , . We find a 1 scatter of about 0.3 dex in mass, consistent with that previously found by Kauffmann & Charlot (1998). We note that we are using observed magnitudes from galaxies in a similar redshift range, and therefore do not need a k-correction.
This allows us to derive a rough mass estimate for our two sources. For TXS 2353003 and NVSS J210626314003, K-band magnitudes of 18.10.3 mag and 18.70.2 mag suggest stellar masses in the range and , respectively. While such an approach should not replace more detailed analyses of the continuum emission where additional photometric constraints are available, it does highlight that our two galaxies fall into the typical range of stellar masses of powerful radio galaxies at these redshifts.
6.2 Surface-brightness profiles
In Section 4.2 we showed that both galaxies are spatially resolved in our ground-based imaging, and that both have surface-brightness profiles that are not consistent with the pure Sersic profiles of early-type galaxies (n4). The central arcsec of the profile of NVSS J210626314003 can be fitted with a de Vaucouleurs profile with R=15 kpc, but fainter extended emission persists at larger radii. TXS 2353-003 can only be fitted with a de Vaucouleurs profile when assuming an unphysically large radius of 261 kpc.
Targett et al. (2011) analyzed the K-band morphologies of 13 radio galaxies at z1.52.5 observed with UKIRT during very good seeing, and found that most sources are well fit with Sersic indices n and effective radii between 5 and 10 kpc. This is in contrast to the findings of Pentericci et al. (2001) with HST/NICMOS through the F160W filter that only 5 out of 19 sources have well-established de Vaucouleurs profiles (although the Pentericci et al., 2001, sample does extend to higher redshifts than that of Targett et al. 2011 and, with H-band observations, samples much shorter wavelengths). Only one source of the Targett et al. (2011) sample, 0128264, has an effective radius R=15 kpc, as does NVSS J210626314003. This galaxy is also included in our parent sample with SINFONI data. It has a small emission-line region, although elongated along the radio jet axis, and a very extended (294 kpc) radio size, resembling the two sources discussed here (Nesvadba et al. 2015, in prep.).
Massive early-type galaxies at high redshift appear to be generally characterized by their greater compactness compared to similar, more nearby galaxies (Daddi et al., 2005; van Dokkum et al., 2008, who found kpc and 0.9 kpc, respectively ). Typically, these galaxies are only resolved with deep, high-resolution HST imaging, showing no deviations from Sérsic laws (e.g., Szomoru et al., 2010; Cassata et al., 2010). The HzRGs of Targett et al. (2011), which have relatively large radii (average 8 kpc) compared to submillimeter galaxies (average 3 kpc) at similar redshifts, show an average decrease in size by a factor 1.5 compared to equally massive galaxies at low redshift. A size decrease by a factor of has also been found by Pentericci et al. (2001) for their HzRGs that are well modeled with a de Vaucouleurs profile.
Extended stellar envelopes are a primary characteristic of central cluster galaxies in the low-redshift Universe (cD galaxies; e.g., Schombert, 1987), and likely formed from the debris of repeated accretion of several satellite galaxies. This interpretation also agrees with the finding of Targett et al. (2011) that HzRGs fall onto the same Kormendy relationship between central surface brightness and effective radius as massive low-redshift galaxies, which, as stated by the authors, would imply that the size increase from z2 to today must be accommodated by an increase in stellar mass at large galactocentric radii, as could be produced by repeated accretion of satellites. Best et al. (1998) identified similar structures in a stack of 12 radio galaxies from the 3CRR sample at z, but to our knowledge, the only example of a HzRG with extended stellar halo at greater redshift currently known in the literature is MRC 1138262 at z=2.2 (the Spiderweb Galaxy, Miley et al., 2006). Hatch et al. (2008, 2009) discussed the envelope around this source in detail, finding that the rest-frame UV colors of the faint continuum emission are consistent with a stellar envelope (rather than scattering from a dusty gaseous halo) with a formation history that is coeval with that of the high-surface brightness central regions. This is in contrast to semi-analytical simulations which postulate that such envelopes assembled gradually through dry mergers over cosmological timescales (e.g., De Lucia & Blaizot, 2007).
7 The nature of the extended ionized gas
A good alignment between jet and gas is typical of distant radio galaxies (the alignment effect; e.g., Cimatti et al., 1993), and this alignment was also among the prime arguments of Collet et al. (2015) and of Nesvadba et al. (2006, 2008) that jet and gas are physically related in their SINFONI samples of HzRG. They also found very large, super-gravitational velocity gradients reaching to more than 1000 km s-1 associated with the most powerful radio sources, and broad line widths in the extended gas with FWHM 800 km s-1. They considered this as evidence of fast, AGN-driven outflows in HzRGs.
None of this applies here. Velocity gradients are well below 1000 km s-1, line widths outside of the central regions are only on the order of 200-300 km s-1, and the mismatch in position angle between jet and gas is striking. This mismatch makes it difficult to postulate that jet cocoons are driving the gas out as they expand through the ambient gas, because it appears unavoidable in this model that cocoon (and hence, jet) and gas are cospatial, both in three dimensions and in projection.
The presence of this off-axis component of line emission is worth discussing, as is the absence of bright, extended emission-line regions along the jet axis. TXS 2353003 may have a faint, not well resolved emission-line component along the jet axis and within the galaxy itself. However, this does not stand out compared to the gas in other regions of the galaxy, and is therefore difficult to associate uniquely with the radio jet. We find no similar emission at larger radii, including the cluster scales that we cover with ISAAC around TXS 2353-003 (§5).
The absence of bright gas on scales much larger than the host galaxy cannot be a mere observational effect, since the sensitivities of these data are comparable to the overall sample, and the surface brightness of the line emission in our targets is not significantly lower than in other HzRGs with SINFONI data. However, for the largest sources with ’regular’ line emission, in particular MRC 2104-242 at z=2.5, the extended line emission can become very faint and is concentrated along long, thin, very filamentary structures, suggesting that the warm gas is either being heated to temperatures T K, or becoming strongly dispersed as the cocoon continues to expand (Nesvadba et al. 2015, in prep.; see also Pentericci et al. 2001 who observed the same gas as faint, extended filaments in their HST/NICMOS broadband imaging).
We stress that finding extended gas around HzRGs that is unrelated to the radio jets is by itself not uncommon. Many HzRGs are surrounded by diffuse halos of warm ionized gas (Villar-Martín et al., 2003), however, dense, high-surface-brightness Ly emission consistent with the H surface brightnesses that we observe here is only found within the jet cocoon in the galaxies of Villar-Martín et al. (2003) H associated with the diffuse ionized gas would be about 2 orders of magnitude fainter than what we observe.
We will now discuss several hypotheses, from AGN orientation to galaxy interactions to extended gas disks or filaments within the radio galaxy itself or its immediate surroundings, to explain the nature of this gas.
7.1 Partial AGN illumination of ambient halo clouds
The line ratios of both sources suggest that they are photoionized by the central AGN (§3). This could imply that they do not represent a distinct structure, but are merely part of a population of ambient clouds that are distributed over large solid angles, and of which a subset is being lit up as it intercepts the quasar ionization cone. Filaments of neutral gas have also been observed around some HzRGs (van Ojik et al., 1997; Jarvis et al., 2003; Wilman et al., 2004; De Breuck et al., 2005; Nesvadba et al., 2009; Emonts et al., 2014).
However, not all HzRGs show signatures of neutral gas clouds in their halos. van Ojik et al. (1997) found Ly absorption only in galaxies with radio sizes 50 kpc, in stark contrast to the large radio sizes, kpc, of TXS 2353-003 and NVSS 210626-314003. Binette et al. (2000) showed from an analysis of the ionization properties that these absobers must also lie at larger radii than the radio source. In the more compact radio galaxies, Ly absorbers are found not only against the nucleus, but also against more extended Ly emission around the galaxy (Kurk et al., 2004a), which suggests that this result holds for large solid angles around the radio galaxies, and not just along the radio jet axis.
This scenario would also require a misalignment between radio jet axis and quasar illumination cone, as is possible because of jet precession, or a misalignment between jet axis and the normal of the torus, for example. Drouart et al. (2014) recently argued, based on Spitzer mid-infrared imaging and the core-to-lobe fraction of the radio sources, that the unified model must hold for the global population of HzRGs, but the presence of nuclear broad H emission in a few sources does also suggest that this might not be the case for each individual HzRG (Nesvadba et al., 2011a).
Alternatively, we may be seeing gas in an old cocoon from a previous radio-loud activity phase of the super-massive black hole. Jet precession has been invoked to explain the X-shaped radio sources at low redshift, where about 5-10% of FRII radio sources have two pairs of radio lobes (Leahy & Muxlow, 2002). The second bar of the “X”, typically secondary pairs of fairly diffuse, low surface-brightness wings in centimeter radio continuum imaging, may be the relic of a previous burst of nuclear activity along a different jet axis. Detecting such low surface-brightness emission directly would be very challenging at high redshift.
This scenario, however, also has its difficulties. Kaiser & Cotter (2002) argued that clouds in relic cocoons will be destroyed by shocks within a few yrs, which is of the same order as the ages of bright radio sources in high-redshift galaxies (e.g., Blundell & Rawlings, 1999). In the cocoon model, dense clouds are confined by the high pressure of the cocoon material, and should disperse within a sound-crossing time once the jet has stopped maintaining the cocoon pressure high (e.g., Fabian et al., 1987). From the size of the two lobes in our sources, 310 kpc and 190 kpc, and assuming a jet advance speed on the order of , we can roughly constrain that the feeding of a putative older jet component must have ended at least about yrs ago in our two sources, so that most of the emission-line clouds should have already been destroyed or evaporated. The relatively old age of our two sources does not make them good candidates for seeing relic cocoons, in particular since many younger radio sources, which should in principle have brighter relic cocoons, do not show evidence of two sets of radio lobes or extended emission-line regions.
We conclude that neither partial AGN illumination of a general population of ambient clouds nor repeated cycles of radio-loud AGN activity with different jet orientations appears to be a good explanation for the nature of our sources.
7.2 External gas supply from a satellite galaxy?
Gas transfer from a satellite galaxy undergoing accretion onto the HzRG, as previously observed in the z=3.8 HzRG 4C60.07 (Ivison et al., 2008), is another interesting hypothesis for the origin of this misaligned gas in our two sources. In this case, the extended line emission could trace a gas tail produced by ram-pressure stripping or tidal forces. However, only TXS 2353003 has a companion along the direction of the extended gas, but at a larger distance from the radio galaxy. NVSS J210626-314003 has no obvious companion within several tens of kpc that can be associated with the extended emission-line region.
It is uncertain whether the galaxy near TXS 2353-003 (Fig. 1) is physically associated with the radio galaxy, although its infrared colors as measured with IRAC are consistent with a redshift z1.3 using the criteria of Papovich (2008) (§5). However, we detect no H line emission down to erg s-1 cm-2. Tidal forces during galaxy interactions produce extended tails, and also funnel gas toward the nuclei of the galaxies (e.g., Barnes & Hernquist, 1996), fueling intense nuclear starbursts. Likewise ram pressure should not only strip parts of the ISM, but also compress the gas along the head of the infalling galaxy, enhancing the gas surface brightness within the galaxy, and potentially star formation (Kapferer et al., 2008).
It appears therefore difficult for a galaxy to produce a tail of M⊙ of ionized gas without sustaining significant star formation. Our upper limit of H flux corresponds to star formation rates on the order of 10 M⊙ yr-1 (using the Kennicutt, 1998, calibration and neglecting extinction). Since the source is bright in the continuum at similar wavelengths, the H equivalent width must also be low. Although gas, dust, and young stars are not necessarily co-spatial (Calzetti, 1997), this would imply here that the galaxy, in spite of losing considerable fractions of its ISM in the putative tail, is also maintaining a highly efficient obscuring dust screen around its star-forming regions. This appears contradictory, in particular for high-z galaxies, which typically have extended star formation in multiple knots across the galaxy (e.g., Förster Schreiber et al., 2009). Other HzRGs, e.g., MRC 1138-262 at z = 2.16, are already known to be surrounded by companions within a few tens of kpc that are already on the red sequence (Kodama et al., 2007) and lack line emission (Nesvadba et al., 2006; Kuiper et al., 2011). It thus appears unlikely that external gas supply from a satellite galaxy is a good explanation of the extended emission-line regions in our galaxies.
7.3 Extended gas disks within the radio galaxy
Best (2000) pointed out that radio galaxies with very extended radio sources are particularly good candidates for being cluster central galaxies because the pressure from the Mpc-scale intracluster medium boosts the luminosity of the radio source even for comparably extended jets (see also Athreya et al., 1998; Klamer et al., 2006). Many authors have previously suggested that the progenitors of brightest cluster galaxies are likely to be found among HzRGs (e.g., Pentericci et al., 2001; Miley et al., 2006; Hatch et al., 2009), and Wylezalek et al. (2013) find from IRAC imaging that TXS 2353-003 is even associated with the most strongly pronounced overdensity within their sample.
The gas that we see here may actually have much in common with the extended gas disks or filaments that are found in and near cluster central galaxies in the more nearby Universe. Mismatches between the position angles of jet and gas are fairly common in about 30% (McDonald et al., 2010) of cool-core galaxy clusters with extended H filaments. A particularly clear example, where the warm ionized gas appears to avoid the cavities that the radio jet has inflated in the intracluster medium is Abell 1795, in particular at the highest emission-line surface brightnesses (van Breugel et al., 1984). In total, such structures have up to a few M⊙ (e.g., Salomé et al., 2006) of warm and cold gas with T K, typically dominated by cold molecular gas. We have already argued in §6 that our sources follow the overall trends found in BCGs between H luminosity and surface luminosity, size, and ratios of low-ionization emission lines.
Imaging spectroscopy of cool-core clusters with bright optical line emission (e.g., Hatch et al., 2006; Wilman et al., 2006; Hatch et al., 2007; Wilman et al., 2009; Farage et al., 2010, 2012) shows that the gas has typically FWHM km s-1 outside the near-nuclear regions, with a characteristic broadening toward the center, with typical FWHM 500 km s-1 and up to the values we find near the center of NVSS J210626314003 and TXS 2353003 (§3 and Figs. 1 and 2). However, regular velocity gradients of a few 100 km s-1, similar to what we observe in our sources, are found only in some BCGs, e.g., Abell 262 (Hatch et al., 2007) or 2A 0335096 (Farage et al., 2012). Alternatively, disks with well-ordered velocity fields, perhaps more like in NVSS J210626-3140003 than in TXS 2353003, have also been found, for example in Hydra A (Hamer et al., 2014). Such disks are also typically not aligned with the radio jet axis, but can be illuminated by the central AGN, in particular if the opening angle of the AGN illumination cone is large.
The observed velocity gradients in our two sources are in fact consistent with rotational motion in a gravitational potential as suggested by the stellar mass estimates of M⊙ (§6.1). A dynamical mass estimate, , can be derived by setting , where is the stellar mass, the radius of the putative disk, the inclination angle, and the gravitational constant. With R10.5 kpc, measured for the very regular velocity field of NVSS J210626-314003, we find v km s-1, compared to 220 km s-1 observed. Even if the gradients were dominated by radial outflow motion, the small velocity range implies that most of this gas is unlikely to escape.
This is consistent with the finding that the gas extends over similar radii to the faint continuum wings in the ISAAC image of TXS 2353-003 on both sides, and in NVSS J210626-314003 on the southwestern side. If the wings in the continuum surface brightness profiles of our two sources represent extended stellar halos (Hatch et al., 2009), perhaps originating from a phase of rapid accretion of many satellite galaxies in the very early evolution of the HzRGs (Burkert et al., 2008), then we may be seeing leftover gas that is settling down after this phase. McDonald et al. (2010) suggested that the condensation of such gas into fairly dense clouds could be accelerated by weak shocks caused by the passage of a companion galaxy, as may be the case for the putative companion in TXS2353-003.
Weak shocks could also be produced by the vestiges of the relic cocoon that initially formed when the jet was passing through the inner regions of the halo. This scenario has some resemblance to the cyclical AGN feedback scenarios invoked, e.g., by Pizzolato & Soker (2005) or Antonuccio-Delogu & Silk (2010) to explain extended gas disks and filaments in nearby cluster central galaxies. Nesvadba et al. (2010, 2011b) argued that isolated radio galaxies with extended gas disks may also require repeated, episodic AGN activity, broadly akin to the Pizzolato & Soker (2005) model, in order to understand the observed properties of the gas. Winds associated with the large radio jets we observe may have dispersed the ISM of these galaxies just a few yrs ago, and parts of this gas may now be raining back onto the galaxy, possibly feeding a new feedback cycle. The age of the Universe at z=1.5-2 is already Gyr, so that repeated activity cycles are possible for duty cycles of a few times yrs, as seems appropriate at low redshift (Pizzolato & Soker, 2005). The gas cooling times could be lowered by compression of the outflow and diffuse ambient gas that is being swept up as the two bubbles of the AGN cocoon continue to inflate in the form of a momentum-driven wind after the feeding from the AGN has ceased (Kaiser & Cotter, 2002). This cyclical feedback may contribute to forming the hot intracluster X-ray gas in massive galaxy clusters today, which presumably took place around redshift z2 (Nath & Roychowdhury, 2002; McCarthy et al., 2008). Energy injection through repeated episodic AGN activity has also been invoked as an explanation of how the X-ray halos surrounding individual massive early-type galaxies can be maintained over a Hubble time (e.g., Mathews & Brighenti, 2003; Best et al., 2006).
8 Summary
We have presented an analysis of rest-frame optical imaging spectroscopy and deep broadband near-infrared imaging of two radio galaxies at z2, which have extended emission-line regions that are strongly misaligned relative to the axis of the radio jets. This is in stark contrast to the majority of powerful radio galaxies at similar redshifts, where the gas is aligned within 20-30∘ of the jet axis, as expected from a cocoon of turbulent gas that is being inflated by the expanding radio jets. For one source, TXS 2353-003 at z1.5, we also present H narrowband imaging through the [FeII]1.64 filter of ISAAC, finding an overdensity of H candidates which resembles those of radio galaxies at higher redshift.
The gas in both galaxies is less perturbed than in radio galaxies with more typical gas properties. In particular, line widths in the extended gas are lower and, with FWHM 200-300 km s-1 comparable to those in the extended gas disks and filaments surrounding brightest cluster galaxies at lower redshifts. Overall, we find remarkable similarities to the BCGs in low-redshift cool-core clusters, ranging from the extended, faint continuum halos in both galaxies that are atypical for massive high-redshift galaxies except for the particularly well-studied Spiderweb Galaxy MRC 1138-262, where such structures are interpreted as extended stellar halos broadly akin to cD galaxies at lower redshifts. Both galaxies fall onto the relationship between K-band magnitude and redshift for brightest cluster galaxies and HzRGs, suggesting they are among the most massive galaxies at their epoch. We note that, given that HzRGs are now generally considered to be the progenitors of BCGs, the distinction between both classes is not mutually exclusive, and our two sources may simply be further evolved than many other HzRGs, but still following the same overall evolutionary path.
We discuss several scenarios for the nature of this gas, finding that simple illumination effects in otherwise typical HzRG halos is not a good explanation, and neither are galaxy interactions. Generally speaking, our results support the hypothesis that the extended line emission arises from extended gas disks or filaments within or near the radio galaxy, by analogy with broadly similar structures in nearby cluster central galaxies. This could be evidence for cyclical AGN feedback, which has been discussed on several occasions for nearby clusters.
Acknowledgments
We are very grateful to the staff at Paranal for having carried out the observations on which our analysis is based. We also thank the anonymous referee for the detailed comments which helped improve the paper. CC wishes to acknowledge support from the Ecole Doctorale Astronomie & Astrophysique de l’Ile de France. Parts of this research were conducted by the Australian Research Council Centre of Excellence for All-sky Astrophysics (CAASTRO), through project number CE110001020.
References
- Adams et al. (2009) Adams, J. J., Hill, G. J., & MacQueen, P. J. 2009, ApJ, 694, 314
- Antonuccio-Delogu & Silk (2010) Antonuccio-Delogu, V. & Silk, J. 2010, Monthly Notices of the Royal Astronomical Society, 405, 1303
- Archibald et al. (2001) Archibald, E. N., Dunlop, J. S., Hughes, D. H., et al. 2001, MNRAS, 323, 417
- Athreya et al. (1998) Athreya, R. M., Kapahi, V. K., McCarthy, P. J., & van Breugel, W. 1998, A&A, 329, 809
- Baldwin et al. (1981) Baldwin, J. A., Phillips, M. M., & Terlevich, R. 1981, PASP, 93, 5
- Barnes & Hernquist (1996) Barnes, J. E. & Hernquist, L. 1996, Astrophysical Journal, 471, 115
- Barthel et al. (2012) Barthel, P., Haas, M., Leipski, C., & Wilkes, B. 2012, ApJ, 757, L26
- Baum & McCarthy (2000) Baum, S. A. & McCarthy, P. J. 2000, AJ, 119, 2634
- Begelman & Cioffi (1989) Begelman, M. C. & Cioffi, D. F. 1989, ApJl, 345, L21
- Bertin & Arnouts (1996) Bertin, E. & Arnouts, S. 1996, Astronomy & Astrophysics Supplement, 117, 393
- Best (2000) Best, P. N. 2000, Monthly Notices of the Royal Astronomical Society, 317, 720
- Best et al. (2006) Best, P. N., Kaiser, C. R., Heckman, T. M., & Kauffmann, G. 2006, MNRAS, 368, L67
- Best et al. (1998) Best, P. N., Longair, M. S., & Roettgering, H. J. A. 1998, MNRAS, 295, 549
- Binette et al. (2000) Binette, L., Kurk, J. D., Villar-Martín, M., & Röttgering, H. J. A. 2000, A&A, 356, 23
- Blundell & Rawlings (1999) Blundell, K. M. & Rawlings, S. 1999, Nature, 399, 330
- Bryant et al. (2009) Bryant, J. J., Johnston, H. M., Broderick, J. W., et al. 2009, MNRAS, 395, 1099
- Bunker et al. (1995) Bunker, A., Warren, S., Hewett, P., & Clements, D. 1995, Monthly Notices of the Royal Astronomical Society, 273, 513
- Burkert et al. (2008) Burkert, A., Naab, T., Johansson, P. H., & Jesseit, R. 2008, ApJ, 685, 897
- Calzetti (1997) Calzetti, D. 1997, AJ, 113, 162
- Cassata et al. (2010) Cassata, P., Giavalisco, M., Guo, Y., et al. 2010, Astrophysical Journal Letters, 714, L79
- Chambers et al. (1988) Chambers, K. C., Miley, G. K., & Joyce, R. R. 1988, ApJ, 329, L75
- Chambers et al. (1996) Chambers, K. C., Miley, G. K., van Breugel, W. J. M., et al. 1996, ApJS, 106, 247
- Cimatti et al. (1993) Cimatti, A., di Serego-Alighieri, S., Fosbury, R. A. E., Salvati, M., & Taylor, D. 1993, MNRAS, 264, 421
- Collet et al. (2015) Collet, C. et al. 2015, A&A submitted
- Cooke et al. (2014) Cooke, E. A., Hatch, N. A., Muldrew, S. I., Rigby, E. E., & Kurk, J. D. 2014, MNRAS, 440, 3262
- Daddi et al. (2005) Daddi, E., Renzini, A., Pirzkal, N., et al. 2005, Astrophysical Journal, 626, 680
- Davé et al. (2011) Davé, R., Finlator, K., & Oppenheimer, B. D. 2011, MNRAS, 416, 1354
- De Breuck et al. (2005) De Breuck, C., Downes, D., Neri, R., et al. 2005, A&A, 430, L1
- De Breuck et al. (2003) De Breuck, C., Neri, R., & Omont, A. 2003, New Astronomy Review, 47, 285
- De Breuck et al. (2010) De Breuck, C., Seymour, N., Stern, D., et al. 2010, ApJ, 725, 36
- De Breuck et al. (2001) De Breuck, C., van Breugel, W., Röttgering, H., et al. 2001, AJ, 121, 1241
- De Breuck et al. (2002) De Breuck, C., van Breugel, W., Stanford, S., et al. 2002, Astronomical Journal, 123, 637
- De Lucia & Blaizot (2007) De Lucia, G. & Blaizot, J. 2007, MNRAS, 375, 2
- Draper et al. (2014) Draper, P. W., Gray, N., Berry, D. S., & Taylor, M. 2014, GAIA: Graphical Astronomy and Image Analysis Tool, astrophysics Source Code Library
- Drouart et al. (2014) Drouart, G., De Breuck, C., Vernet, J., et al. 2014, A&A, 566, A53
- Emonts et al. (2014) Emonts, B. H. C., Norris, R. P., Feain, I., et al. 2014, MNRAS, 438, 2898
- Fabian et al. (1987) Fabian, A. C., Crawford, C. S., Johnstone, R. M., & Thomas, P. A. 1987, MNRAS, 228, 963
- Farage et al. (2012) Farage, C., McGregor, P., & Dopita, M. 2012, Astrophysical Journal, 747, 28
- Farage et al. (2010) Farage, C., McGregor, P., Dopita, M., & Bicknell, G. 2010, Astrophysical Journal, 724, 267
- Förster Schreiber et al. (2009) Förster Schreiber, N. M., Genzel, R., Bouché, N., & others. 2009, ApJ, 706, 1364
- Freudling (1993) Freudling, W. 1993, in European Southern Observatory Conference and Workshop Proceedings, Vol. 47, European Southern Observatory Conference and Workshop Proceedings, ed. P. Grosbol & R. de Ruijsscher, 27
- Galametz et al. (2012) Galametz, A., Stern, D., De Breuck, C., et al. 2012, ApJ, 749, 169
- Garn et al. (2010) Garn, T., Sobral, D., Best, P. N., et al. 2010, MNRAS, 402, 2017
- Groves et al. (2006) Groves, B. A., Heckman, T. M., & Kauffmann, G. 2006, MNRAS, 371, 1559
- Hamer et al. (2014) Hamer, S. L., Edge, A. C., Swinbank, A. M., et al. 2014, MNRAS, 437, 862
- Hatch et al. (2008) Hatch, N., Overzier, R., Röttgering, H., Kurk, J., & Miley, G. 2008, Monthly Notices of the Royal Astronomical Society, 383, 931
- Hatch et al. (2007) Hatch, N. A., Crawford, C., & Fabian, A. 2007, Monthly Notices of the Royal Astronomical Society, 380, 33
- Hatch et al. (2006) Hatch, N. A., Crawford, C., Johnstone, R., & Fabian, A. 2006, Monthly Notices of the Royal Astronomical Society, 367, 433
- Hatch et al. (2011) Hatch, N. A., Kurk, J. D., Pentericci, L., et al. 2011, MNRAS, 415, 2993
- Hatch et al. (2009) Hatch, N. A., Overzier, R. A., Kurk, J. D., et al. 2009, MNRAS, 395, 114
- Hatch et al. (2014) Hatch, N. A., Wylezalek, D., Kurk, J. D., et al. 2014, MNRAS, 445, 280
- Hayashi et al. (2012) Hayashi, M., Kodama, T., Tadaki, K.-i., Koyama, Y., & Tanaka, I. 2012, ApJ, 757, 15
- Ivison et al. (2008) Ivison, R., Morrison, G., Biggs, A., et al. 2008, Monthly Notices of the Royal Astronomical Society, 390, 1117
- Ivison et al. (2012) Ivison, R. J., Smail, I., Amblard, A., et al. 2012, MNRAS, 425, 1320
- Jarvis et al. (2003) Jarvis, M. J., Wilman, R. J., Röttgering, H. J. A., & Binette, L. 2003, MNRAS, 338, 263
- Kaiser & Cotter (2002) Kaiser, C. R. & Cotter, G. 2002, MNRAS, 336, 649
- Kapferer et al. (2008) Kapferer, W., Kronberger, T., Ferrari, C., Riser, T., & Schindler, S. 2008, Monthly Notices of the Royal Astronomical Society, 389, 1405
- Kauffmann & Charlot (1998) Kauffmann, G. & Charlot, S. 1998, MNRAS, 297, L23
- Kauffmann et al. (2003) Kauffmann, G., Heckman, T. M., White, S. D. M., et al. 2003, MNRAS, 341, 54
- Kennicutt (1998) Kennicutt, R. 1998, Annual Review of Astronomy and Astrophysics, 36, 189
- Kewley et al. (2013) Kewley, L. J., Dopita, M. A., Leitherer, C., et al. 2013, ApJ, 774, 100
- Kewley et al. (2006) Kewley, L. J., Groves, B., Kauffmann, G., & Heckman, T. 2006, MNRAS, 372, 961
- Kim et al. (2011) Kim, M., Dunlop, J. S., Lonsdale, C. J., et al. 2011, in Bulletin of the American Astronomical Society, Vol. 43, American Astronomical Society Meeting Abstracts 217, 335.51
- Klamer et al. (2006) Klamer, I. J., Ekers, R. D., Bryant, J. J., et al. 2006, MNRAS, 371, 852
- Klamer et al. (2005) Klamer, I. J., Ekers, R. D., Sadler, E. M., et al. 2005, ApJ, 621, L1
- Kodama et al. (2007) Kodama, T., Tanaka, I., Kajisawa, M., et al. 2007, Monthly Notices of the Royal Astronomical Society, 377, 1717
- Koyama et al. (2013) Koyama, Y., Kodama, T., Tadaki, K.-i., et al. 2013, MNRAS, 428, 1551
- Kuiper et al. (2011) Kuiper, E., Hatch, N., Miley, G., et al. 2011, Monthly Notices of the Royal Astronomical Society, 415, 2245
- Kurk et al. (2004a) Kurk, J., Cimatti, A., di Serego Alighieri, S., et al. 2004a, Astronomy and Astrophysics, 422, L13
- Kurk et al. (2004b) Kurk, J., Pentericci, L., Röttgering, H., & Miley, G. 2004b, Astronomy and Astrophysics, 428, 793
- Le Fevre et al. (1996) Le Fevre, O., Deltorn, J. M., Crampton, D., & Dickinson, M. 1996, ApJl, 471, L11+
- Le Tiran et al. (2011) Le Tiran, L., Lehnert, M., van Driel, W., Nesvadba, N., & Di Matteo, P. 2011, Astronomy and Astrophysics, 534, L4
- Leahy & Muxlow (2002) Leahy, J. P. & Muxlow, T. W. B. 2002, in IAU Symposium, Vol. 199, The Universe at Low Radio Frequencies, ed. A. Pramesh Rao, G. Swarup, & Gopal-Krishna, 179
- Lehnert et al. (2009) Lehnert, M. D., Nesvadba, N. P. H., Tiran, L. L., et al. 2009, ApJ, 699, 1660
- Lidman et al. (2012) Lidman, C., Suherli, J., Muzzin, A., et al. 2012, Monthly Notices of the Royal Astronomical Society, 427, 550
- Lilly & Longair (1984) Lilly, S. J. & Longair, M. S. 1984, MNRAS, 211, 833
- Mathews & Brighenti (2003) Mathews, W. G. & Brighenti, F. 2003, ARA&A, 41, 191
- McCarthy et al. (2008) McCarthy, I. G., Babul, A., Bower, R. G., & Balogh, M. L. 2008, MNRAS, 403
- McDonald et al. (2010) McDonald, M., Veilleux, S., Rupke, D., & Mushotzky, R. 2010, Astrophysical Journal, 721, 1262
- Miley et al. (2006) Miley, G. K., Overzier, R. A., Zirm, A. W., et al. 2006, ApJl, 650, L29
- Nath & Roychowdhury (2002) Nath, B. B. & Roychowdhury, S. 2002, MNRAS, 333, 145
- Nesvadba et al. (2008) Nesvadba, N., Lehnert, M., De Breuck, C., Gilbert, A., & Van Breugel, W. 2008, Astronomy and Astrophysics, 491, 407
- Nesvadba et al. (2006) Nesvadba, N., Lehnert, M., Eisenhauer, F., et al. 2006, Astrophysical Journal, 650, 693
- Nesvadba et al. (2010) Nesvadba, N. P. H., Boulanger, F., Salomé, P., et al. 2010, A&A, 521, A65
- Nesvadba et al. (2011a) Nesvadba, N. P. H., De Breuck, C., Lehnert, M. D., et al. 2011a, A&A, 525, A43
- Nesvadba et al. (2007) Nesvadba, N. P. H., Lehnert, M. D., De Breuck, C., Gilbert, A., & van Breugel, W. 2007, A&A, 475, 145
- Nesvadba et al. (2008) Nesvadba, N. P. H., Lehnert, M. D., De Breuck, C., Gilbert, A. M., & van Breugel, W. 2008, A&A, 491, 407
- Nesvadba et al. (2006) Nesvadba, N. P. H., Lehnert, M. D., Eisenhauer, F., et al. 2006, ApJ, 650, 693
- Nesvadba et al. (2009) Nesvadba, N. P. H., Neri, R., De Breuck, C., et al. 2009, MNRAS, 395, L16
- Nesvadba et al. (2011b) Nesvadba, N. P. H., Polletta, M., Lehnert, M. D., et al. 2011b, MNRAS, 415, 2359
- Ogle et al. (2012) Ogle, P., Davies, J. E., Appleton, P. N., et al. 2012, ApJ, 751, 13
- Overzier et al. (2005) Overzier, R. A., Harris, D. E., Carilli, C. L., et al. 2005, A&A, 433, 87
- Overzier et al. (2013) Overzier, R. A., Nesvadba, N. P. H., Dijkstra, M., et al. 2013, ArXiv e-prints
- Papovich (2008) Papovich, C. 2008, ApJ, 676, 206
- Peng et al. (2002) Peng, C., Ho, L., Impey, C., & Rix, H. 2002, Astronomical Journal, 124, 266
- Peng et al. (2010) Peng, C., Ho, L., Impey, C., & Rix, H. 2010, Astronomical Journal, 139, 2097
- Pentericci et al. (2001) Pentericci, L., McCarthy, P. J., Röttgering, H. J. A., et al. 2001, ApJs, 135, 63
- Pizzolato & Soker (2005) Pizzolato, F. & Soker, N. 2005, Astrophysical Journal, 632, 821
- Queyrel et al. (2012) Queyrel, J., Contini, T., Kissler-Patig, M., et al. 2012, Astronomy and Astrophysics, 539, 93
- Ramos Almeida et al. (2013) Ramos Almeida, C., Bessiere, P. S., Tadhunter, C. N., et al. 2013, MNRAS, 436, 997
- Reuland et al. (2004) Reuland, M., Röttgering, H., van Breugel, W., & De Breuck, C. 2004, MNRAS, 353, 377
- Salomé et al. (2006) Salomé, P., Combes, F., Edge, A., et al. 2006, Astronomy and Astrophysics, 454, 437
- Schawinski et al. (2011) Schawinski, K., Treister, E., Urry, C. M., et al. 2011, The Astrophysical Journal Letters, 727, L31
- Schombert (1987) Schombert, J. M. 1987, Astrophysical Journal Supplement Series, 64, 643
- Sérsic (1963) Sérsic, J. 1963, Boletin de la Asociacion Argentina de Astronomia La Plata Argentina, 6, 41
- Sérsic (1968) Sérsic, J. 1968, Atlas de galaxias australes
- Seymour et al. (2012) Seymour, N., Altieri, B., De Breuck, C., et al. 2012, ApJ, 755, 146
- Seymour et al. (2007) Seymour, N., Stern, D., De Breuck, et al. 2007, ApJs, 171, 353
- Sobral et al. (2009) Sobral, D., Best, P., Geach, J., et al. 2009, Monthly Notices of the Royal Astronomical Society, 398, 75
- Sobral et al. (2010) Sobral, D., Best, P. N., Geach, J. E., et al. 2010, Monthly Notices of the Royal Astronomical Society, 404, 1551
- Sobral et al. (2012) Sobral, D., Best, P. N., Matsuda, Y., et al. 2012, Monthly Notices of the Royal Astronomical Society, 420, 1926
- Sobral et al. (2013) Sobral, D., Smail, I., Best, P. N., et al. 2013, Monthly Notices of the Royal Astronomical Society, 428, 1128
- Solórzano-Iñarrea et al. (2002) Solórzano-Iñarrea, C., Tadhunter, C. N., & Bland-Hawthorn, J. 2002, MNRAS, 331, 673
- Stott et al. (2010) Stott, J. P., Collins, C. A., Sahlén, M., et al. 2010, ApJ, 718, 23
- Stott et al. (2008) Stott, J. P., Edge, A. C., Smith, G. P., Swinbank, A. M., & Ebeling, H. 2008, MNRAS, 384, 1502
- Stott et al. (2013) Stott, J. P., Sobral, D., Bower, R., et al. 2013, MNRAS, 436, 1130
- Swinbank et al. (2006) Swinbank, A. M., Chapman, S. C., Smail, I., et al. 2006, MNRAS, 371, 465
- Szomoru et al. (2010) Szomoru, D., Franx, M., van Dokkum, P. G., et al. 2010, Astrophysical Journal Letters, 714, L244
- Targett et al. (2011) Targett, T. A., Dunlop, J. S., McLure, R. J., et al. 2011, MNRAS, 412, 295
- van Breugel et al. (1984) van Breugel, W., Heckman, T., & Miley, G. 1984, Astrophysical Journal, 276, 79
- van Dokkum et al. (2008) van Dokkum, P., Franx, M., Kriek, M., et al. 2008, Astrophysical Journal — Letters, 677, L5
- van Ojik et al. (1997) van Ojik, R., Röttgering, H., Miley, G., & Hunstead, R. 1997, Astronomy and Astrophysics, 317, 358
- Veilleux & Osterbrock (1987) Veilleux, S. & Osterbrock, D. E. 1987, ApJS, 63, 295
- Venemans et al. (2007) Venemans, B. P., Röttgering, H. J. A., Miley, G. K., et al. 2007, A&A, 461, 823
- Villar-Martín et al. (2003) Villar-Martín, M., Vernet, J., di Serego Alighieri, S., et al. 2003, MNRAS, 346, 273
- Villar-Martín et al. (2002) Villar-Martín, M., Vernet, J., di Serego Alighieri, S., et al. 2002, MNRAS, 336, 436
- Wagner et al. (2012) Wagner, A. Y., Bicknell, G. V., & Umemura, M. 2012, Astrophysical Journal, 757, 136
- Whitaker et al. (2012) Whitaker, K., Kriek, M., van Dokkum, P., et al. 2012, Astrophysical Journal, 745, 179
- Willott et al. (2003) Willott, C., Rawlings, S., Jarvis, M., & Blundell, K. 2003, Monthly Notices of the Royal Astronomical Society, 339, 173
- Wilman et al. (2006) Wilman, R., Edge, A., & Swinbank, A. 2006, Monthly Notices of the Royal Astronomical Society, 371, 93
- Wilman et al. (2009) Wilman, R., Edge, A., & Swinbank, A. 2009, Monthly Notices of the Royal Astronomical Society, 395, 1355
- Wilman et al. (2005) Wilman, R. J., Gerssen, J., Bower, R. G., et al. 2005, Nature, 436, 227
- Wilman et al. (2004) Wilman, R. J., Jarvis, M. J., Röttgering, H. J. A., & Binette, L. 2004, MNRAS, 351, 1109
- Wylezalek et al. (2013) Wylezalek, D., Galametz, A., Stern, D., et al. 2013, ApJ, 769, 79
| TXS 2353003 | NVSS J210626314003 | |
| Redshift | 1.487 | 2.104 |
| DL [Gpc] | 10.8 | 16.6 |
| radio power [ W Hz-1] | 3.7 | 4.2 |
| radio size [arcsec] | 38.8 | 24.2 |
| radio size [kpc] | 328 | 201 |
| K-band magnitude [mag] | 18.10.3 | 18.70.2 |
| PA offset between jet and gas | ||
| F([OIII]5007)a𝑎aa𝑎aAll fluxes are given in units of erg s-1 cm-2. | … | |
| F(H)a𝑎aa𝑎aAll fluxes are given in units of erg s-1 cm-2. | … | |
| F([NII]6548)a𝑎aa𝑎aAll fluxes are given in units of erg s-1 cm-2. | ||
| F([NII]6583)a𝑎aa𝑎aAll fluxes are given in units of erg s-1 cm-2. | ||
| F([SII]6716)a𝑎aa𝑎aAll fluxes are given in units of erg s-1 cm-2.b𝑏bb𝑏b[SII] in TXS 2353003 is affected by a telluric line. | ||
| F([SII]6731)a𝑎aa𝑎aAll fluxes are given in units of erg s-1 cm-2. | ||
| F(H)a𝑎aa𝑎aAll fluxes are given in units of erg s-1 cm-2. | ||
| (H) erg s-1] | 1.7 | 4.8 |
| ionized gas mass [ M⊙] | 2.4 | 9.3 |
| SINFONI rmsc𝑐cc𝑐cSurface brightness detection limit in units of erg s-1 cm-2 arcsec-2. | 4.3 | 6.2 |
| ID | RA | Dec | distance | NB flux a𝑎aa𝑎aMeasured in 2″ diameter apertures. | BB flux a𝑎aa𝑎aMeasured in 2″ diameter apertures. | BB-NB color | EW0 b𝑏bb𝑏bRest-frame equivalent width. | H fluxc𝑐cc𝑐cAssuming that the color excess in the NB image is entirely from line emission. | SFRd𝑑dd𝑑dFollowing Kennicutt (1998). We do not give a star formation rate (SFR) for the radio galaxy, because the line ratios are not consistent with photoionization from young stars. |
|---|---|---|---|---|---|---|---|---|---|
| (J2000) | (J2000) | [arcmin] | [0.1Jy] | [Jy] | [Å] | [10-17 erg s-1 cm-2] | [M⊙ yr-1] | ||
| a | 23:55:35.58 | -00:02:46.2 | 0.0 | 25.9 | 14.3 | 0.69 | 152.4 | 63.6 | N/A |
| b | 23:55:37.95 | -00:01:36.8 | 1.29 | 16.2 | 11.3 | 0.95 | 100.2 | 32.1 | 35 |
| c | 23:55:32.56 | -00:01:59.2 | 1.08 | 10.3 | 6.2 | 0.86 | 132.3 | 23.8 | 26 |
| d | 23:55:37.64 | -00:03:23.9 | 0.81 | 8.3 | 5.4 | 0.76 | 112.7 | 18.7 | 20 |
| e | 23:55:37.74 | -00:01:35.3 | 1.29 | 6.2 | 3.5 | 0.91 | 145.1 | 20.1 | 22 |
| f | 23:55:31.92 | -00:01:33.8 | 1.51 | 6.7 | 3.5 | 1.01 | 166.8 | 17.1 | 19 |
| g | 23:55:30.72 | -00:01:45.7 | 1.57 | 6.8 | 2.7 | 1.3 | 248.2 | 15.0 | 16 |
Appendix A Candidate H emitting galaxies around TXS 2353-003