Strong-field physics with mid-IR fields
Abstract
Strong-field physics is currently experiencing a shift towards the use of mid-IR driving wavelengths. This is because they permit conducting experiments unambiguously in the quasi-static regime and enable exploiting the effects related to ponderomotive scaling of electron recollisions. Initial measurements taken in the mid-IR immediately led to a deeper understanding of photo-ionization and allowed a discrimination amongst different theoretical models. Ponderomotive scaling of rescattering has enabled new avenues towards time resolved probing of molecular structure. Essential for this paradigm shift was the convergence of two experimental tools: 1) intense mid-IR sources that can create high energy photons and electrons while operating within the quasi-static regime, and 2) detection systems that can detect the generated high energy particles and image the entire momentum space of the interaction in full coincidence. Here we present a unique combination of these two essential ingredients, namely a 160 kHz mid-IR source and a reaction microscope detection system, to present an experimental methodology that provides an unprecedented three-dimensional view of strong-field interactions. The system is capable of generating and detecting electron energies that span a six order of magnitude dynamic range. We demonstrate the versatility of the system by investigating electron recollisions, the core process that drives strong-field phenomena, at both low (meV) and high (hundreds of eV) energies. The low energy region is used to investigate recently discovered low-energy structures, while the high energy electrons are used to probe atomic structure via laser-induced electron diffraction. Moreover we present, for the first time, the correlated momentum distribution of electrons from non-sequential double-ionization driven by mid-IR pulses.
pacs:
32.80.-t, 32.80.Fb, 34.80.BmStrong-field physics (SFP) is concerned with the effects related to the interaction of intense electric fields with matter. Here, ‘intense’ means that the electric field strengths are non–negligible compared to the binding fields within matter. Since these field strengths are most easily attained with intense ultrashort laser pulses, most of the effects and observations stem from the interaction with oscillating laser fields. In parallel with the advancement of ultrafast laser science, SFP has developed into a mature field of research that is now capable of tracking electronic and structural dynamics on the atto- to few femtosecond timescales Uiberacker2007 ; Sansone2010 ; Goulielmakis2010 ; Smirnova2009 ; Hockett2011 ; Zewail2010 ; Miller2014 . This advance of SFP and attoscience has, in turn, generated an upsurge in the development of ultrafast mid-IR laser sources due to the possibilities when driving strong-field recollision with long wavelengths Colosimo2008 ; Blaga2009 ; Popmintchev2012 ; Blaga2012 ; Dura2013 ; Ishii2014 ; Cousin2014 . Mid-IR sources present many benefits compared to the ubiquitous 0.8 m radiation of Ti:Sapphire based laser systems. Some of the most relevant to this study are: 1) the unambiguous creation of interaction conditions that are conducive for classical interpretations of experimental results; 2) strong-field recollision at low peak intensity in order to avoid appreciable ground state depletion; and 3) the ability to create high energy recollision electrons for imaging applications. However, long wavelength (ponderomotive) scaling comes at the cost of a dramatically reduced signal Colosimo2008 ; Tate2007 ; Frolov2008 ; Austin2012 , which translates into reduced statistics or long data acquisition times. Exacerbating this problem is the fact that traditional electron detection techniques only detect a small fraction of the entire momentum space (see Sec. IV). These points are often overlooked but they present a significant roadblock to the advancement of SFP. This is because experiments will eventually become untenable due to the required acquisition times exceeding the stability of the apparatus. Here we present a methodology that overcomes these limitations by combining two tools that are perfectly suited for mid-IR SFP: 1) an intense and high repetition rate optical parametric chirped pulse amplification (OPCPA) based mid-IR (3.1 m) source Chalus2009 that creates ionization conditions deep in the quasi-static (tunneling) regime and that can generate electron energies above 1 keV; and 2) a reaction microscope (ReMi) detection system that can image the three-dimensional (3D) momentum space of the interaction in full particle coincidence. The apparatus is capable of generating and detecting electron energies that span a six order of magnitude range and thus provides an unprecedented 3D view of strong-field interactions.
The paper is structured as follows: We first discuss relevant aspects of strong-field ionization (SFI) (Sec. I) when scaling the driving wavelength of the radiation and not the peak intensity; the metric we use to describe such scaling is the adiabaticity, or ‘Keldysh’, parameter (Sec. II). Next, the validity of the dipole approximation is discussed in the context of wavelength scaling (Sec. III). We then highlight the critical role of detection systems with specific attention paid to molecular targets and the importance of measuring all ionization fragments in full coincidence (Sec. IV). We proceed to demonstrating the versatility of our methodology by investigating electron recollision (Sec. VI) at the extremes of a 550 eV wide electron spectrum. We highlight two cases: In Sec. VI.1 the low-energy part of the spectrum (meV) reveals the recently discovered low energy features for both single and double ions while in Sec. VI.2 the high-energy portion (hundreds of eV) is used to extract accurate differential cross-sections (DCSs) over a wide range of recollision energies using laser-induced electron diffraction (LIED). Lastly, we discuss our methodology in the context of the current status and expected direction of SFP research.
I Strong-field ionization
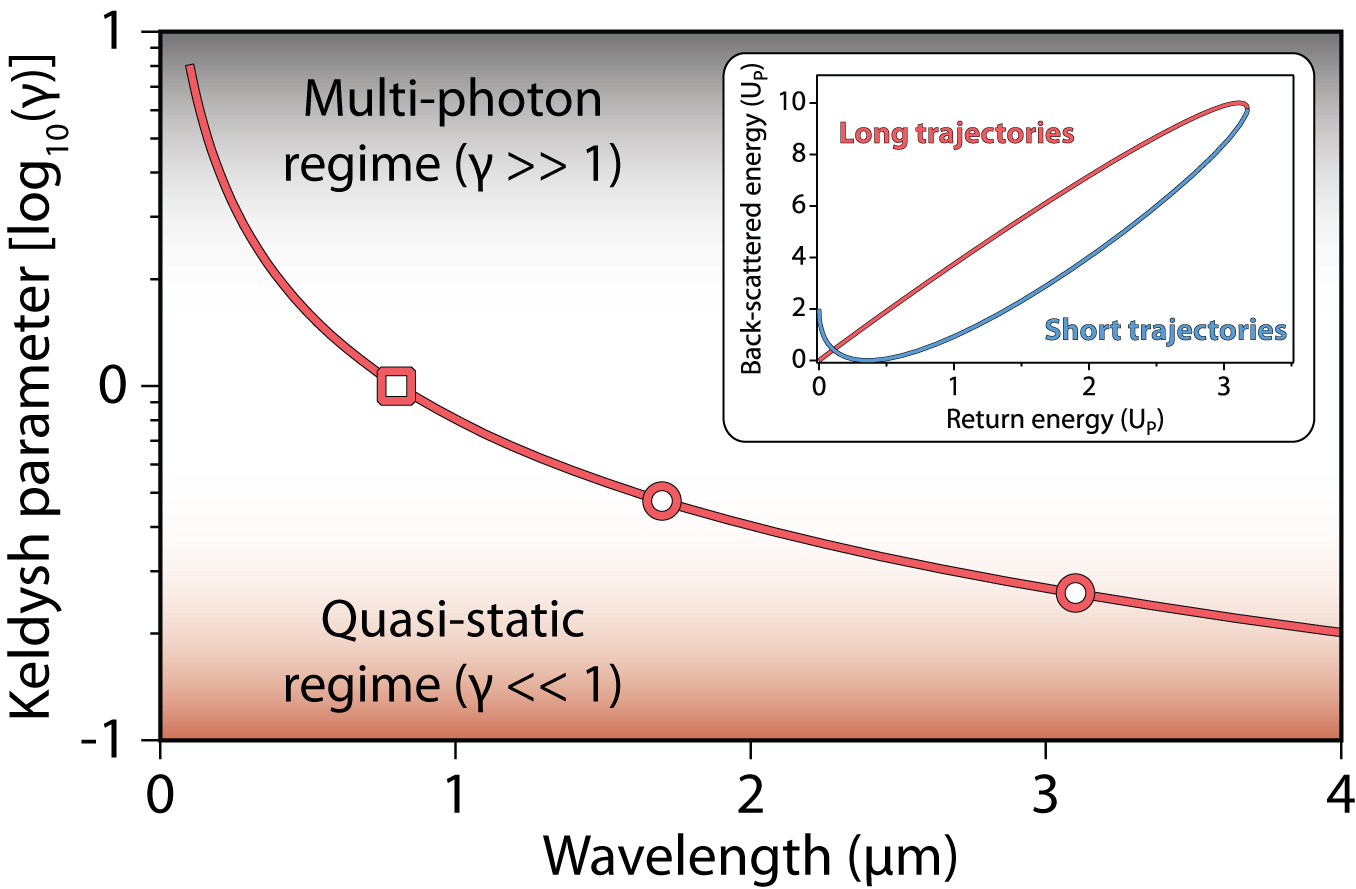
Strong-field interactions can be qualitatively understood by the semi-classical recollision model Corkum1993 , which describes the motion of an electron after strong-field induced tunnel ionization. According to this model the electron is emitted close to the peak of the oscillating laser electric field, after which it accelerates within the field before re-colliding with its parent ion roughly three-quarters of an optical cycle later. In the recollision model returning electron trajectories can be distinguished as long and short depending on the time they spent accelerating in the field before returning to their parent ion. The maximum return energy of = 3.17 ( being the ponderomotive energy experienced by the detached electron) is achieved when the electron is emitted at a phase of about 17∘ after the field maximum. This results in the electron returning to the ion at about 255∘. Electrons emitted before 17∘ return after 255∘ and are considered long trajectories, while those emitted after 17∘ return before 255∘ and are considered short trajectories. The model typically 1) neglects depletion of the ground state and Stark shifts; 2) assumes that only one electron participates; and 3) omits the influence of the Coulomb field on the electron’s trajectory. Even with such assumptions, numerous potential outcomes of the electron-ion re-collision can be qualitatively described: the returning electron may re-combine with the ion and emit a high energy photon in a coherent frequency up-conversion process known as high harmonic generation (HHG); it may inelastically scatter of the ion and cause non-sequential double (or multiple) ionization (NSDI); or it may elastically scatter off the ion resulting in a final kinetic energy that is determined by the energy at which it returns to the parent ion and the angle at which it scatters. The inset of Fig. 1 shows the dependence of on at for long and short electron trajectories. A framework to model the ionization step of such strong-field interactions was proposed in Keldysh’s seminal work from 1965 Keldysh1965 . The dimensionless adiabaticity parameter that is commonly used to describe the interaction conditions was introduced,
| (1) |
The ‘Keldysh’ parameter is a function of the ponderomotive energy , where is the laser peak intensity and is the central driving wavelength. The scaling of the Keldysh parameter as a function of the driving wavelength is presented in Fig. 1 for a typical peak intensity of W cm-2 interacting with a xenon (Xe) atom ( eV). A rapid decrease of the Keldysh parameter can clearly be observed as the driving wavelength is increased from the visible (m) through the near-IR (m m) and into the mid-IR (m) iso . The circular data points represent the wavelengths that are generated by our OPCPA source. The conventional interpretation of is as a metric to distinguish between the extremes of two different descriptions of ionization: 1) the so-called ‘multi-photon’ (MP) regime where and experimental electron kinetic energy distributions generally feature peaked behavior; and 2) the so-called ‘tunneling’, or to be precise ‘quasi-static’ (QS), regime where and the distributions typically exhibit continuous behavior. The case when is known as the ‘transition regime’ and ionization is characterized by features from both MP and QS ionization footnote3 . The square data point in Fig. 1 is within this region and it serves as a reference for the ubiquitous Ti:sapphire radiation at 0.8 m. Most SFI experiments performed in the past couple of decades have utilized laser systems based on this technology, therefore theoretical understanding has evolved in this context.
Several motivating factors exist for investigating SFP in the QS regime. The most obvious is the desire to match the assumptions of theoretical models to further our understanding of SFP in general. Another important aspect is the fact that QS conditions are a prerequisite for invoking classical recollision models, which are the cornerstone for developing attosecond science or recollision based time resolved imaging. The requirement for unambiguous conditions was strikingly demonstrated by ionizing atoms with long wavelength radiation that resulted in unexpected structures at low electron kinetic energies Blaga2009 ; Quan2009 . These structures were not predicted by the most widely used approximate theoretical models including the workhorse of the field, the strong-field approximation (SFA). As these models are utilized to interpret many experimental results, including attosecond science experiments, it was worrying that such obvious features could evade prediction and detection for so long. It was not until improvements were made to both the SFA and to classical models that multiple electron re-scattering due to an interplay of the laser and Coulomb fields could be identified as the responsible mechanism Faisal2009 ; Liu2010 ; Yan2010 ; Lemell2012 ; Kastner1 ; Kastner2 ; Lemell2013 ; Guo2013 ; Lin2014 . Since these initial results a number of other lower energy features have also been observed for both atoms and small molecules during long wavelength investigations within the QS regime Wu2012 ; Dura2013 ; Pullen2014 and the responsible mechanisms have subsequently been identified Wolter2014 . Moreover, the description of the unbound electron being dominated by the laser field within the QS regime is a prerequisite to interrogate inelastic re-scattering processes. The mechanisms behind multiple NSDI connected to electron-electron correlations have been extensively studied and theoretically modeled for near-infrared and high intensity fields, yet questions remain whether the findings hold for different regimes Figueira2011 . Finally, the LIED technique, which has recently been utilized to image the structure of both diatomic Blaga2012 and polyatomic Pullen2014a molecules, requires invoking the classical recollision model. Here the influence of the strong field is removed and the returning electron wavepacket is treated as a plane wave upon recollision. These motivating factors make it clear that performing SFI experiments in the QS regime is advantageous in many ways.
II Scaling of the Keldysh parameter
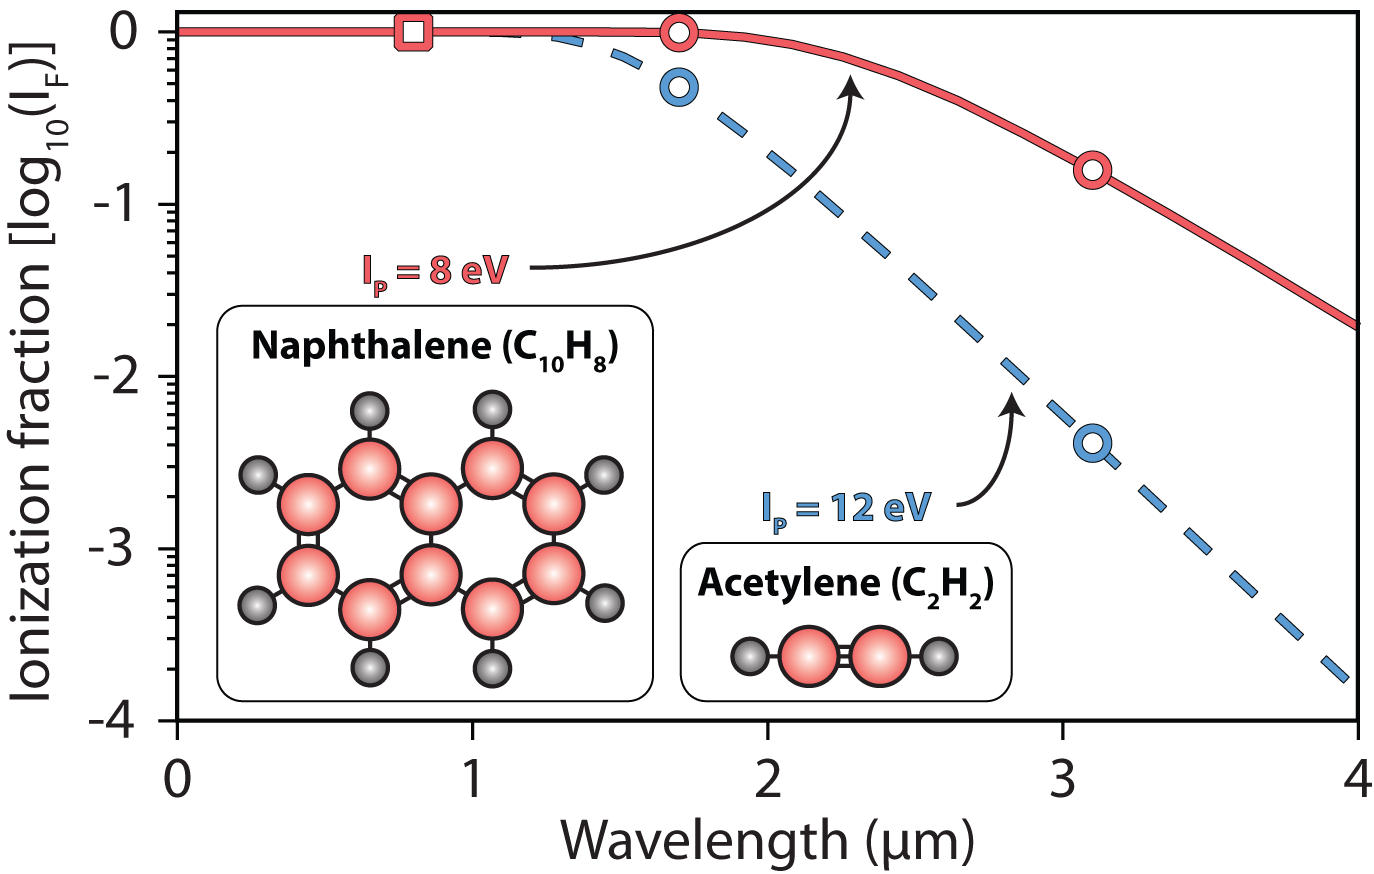
The most straight forward method to reduce is to increase the laser peak intensity . Unfortunately, from an experimental perspective, this approach is severely constrained by the ionization potential of the target because the ground state population is depleted when the so-called saturation intensity is reached for a given pulse duration. Such intensities cause the fractional amount of re-colliding electrons to reduce due to increased direct ionization on the leading edge of the pulse Alnaser2008 . This is detrimental for re-scattering based experiments, therefore it is beneficial for the ionization fraction to be kept much lower than unity. Strictly speaking, as sets the highest effective intensity that a target can experience, it also sets the lower bound on the achievable Alnaser2008 . In Fig. 2 the ionization fraction at the peak of a six cycle FWHM pulse is illustrated Popruzhenko2008 for a target with eV (dashed blue curve) as a function of the laser wavelength while keeping the Keldysh parameter constant at . Such an ionization potential could represent targets such as Xe or acetylene (CH), which have ionization potentials of 12.1 eV and 11.4 eV, respectively. For 0.8 m radiation, a peak intensity of W cm-2 is required to reach , which results in complete ionization of the target before the peak of the pulse. Clearly such experimental conditions cannot be used to unambiguously investigate re-scattering phenomena. The same calculation for 3.1 m radiation, on the other hand, results in a peak intensity of W cm-2 and an ionization fraction of only . In fact, it is found that in order to have an ionization fraction at , a driving wavelength longer than m is required. This analysis highlights the problem of intensity scaling: it is difficult to generate QS conditions using near-IR radiation without reaching ionization saturation.
Ionization saturation becomes even more problematic when larger polyatomic molecular targets are investigated, as they typically have lower ionization potentials and therefore ionize more easily. To demonstrate the consequences of this aspect, the above calculation was repeated for an ionization potential of about eV (solid red curve in Fig. 2), which could represent a polyatomic molecule such as naphthalene (CH) Dimitrovski2014 . In this case saturation persists until a wavelength of about 2 m. At 3.1 m, however, the calculated ionization fraction is still only 0.16, which is adequate for the investigation of re-scattering phenomena. Clearly, a more preferable and robust method to achieve QS conditions is to scale the wavelength rather than the intensity footnote2 .
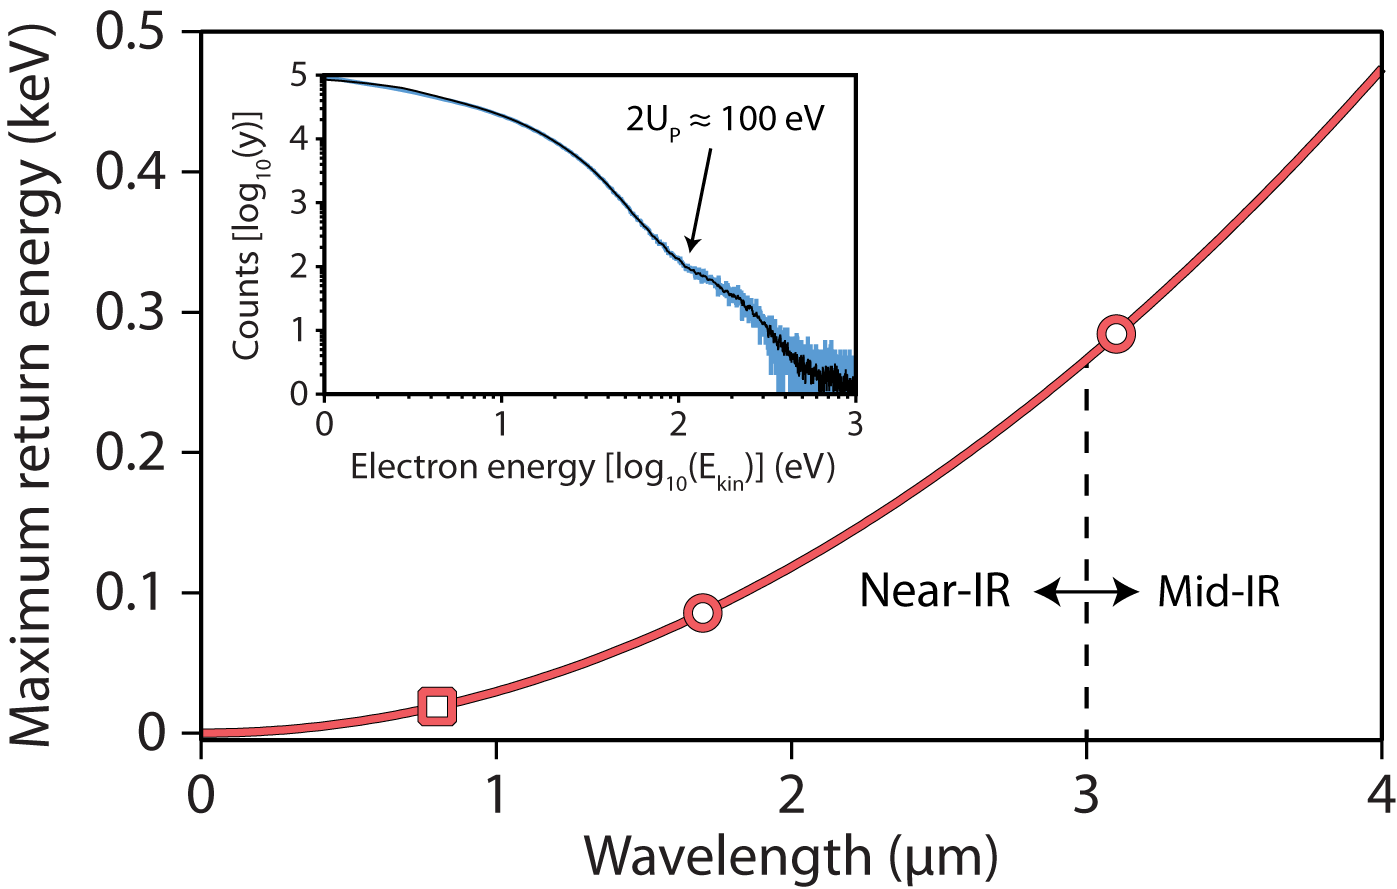
The dependence of with exhibits a favourable quadratic scaling of the ponderomotive energy . As predicted by the recollision model, the time that the electron accelerates in the field is proportional to the laser field period. For this reason mid-IR radiation, which has a longer optical period, results in much higher energy returning electrons. Increasing the driving wavelength from 0.8 m to 3.1 m, for example, results in a factor of 15 increase in the ponderomotive energy . The recollision model also predicts that the maximum energy that an electron can have upon return to its parent ion is equal to . The trend of this maximum return energy versus the driving wavelength is presented in Fig. 3 for a typical peak intensity of W cm-2. The square data point shows the maximum energy generated by 0.8 m radiation as a reference and the circular data points represent the return energies obtainable with the wavelengths generated by our OPCPA source. Return energies of hundreds of eV can be created by scaling strong-field interaction to mid-IR wavelengths, compared to the tens of eV by standard 0.8 m radiation. These much higher energy electrons can be used as a probe of nuclear, rather than electronic, structure and dynamics as is discussed in Sec. VI.2. The inset of Fig. 3 shows an experimentally measured electron energy distribution that ranges from eV. In this case the intensity was such that the maximum return energy was eV. Note that the recollision model predicts elastic rescattering to result in overall electron energies of (see inset of Fig. 1). In Sec. VI we show that, with the appropriate detection system and analysis techniques, the entire bandwidth of such electron spectra can be utilized to investigate meV features and to extract elastic DCSs at energies of hundreds of eV. High return energies also give access to studying inelastic rescattering processes, such as NSDI, not only from valence electrons but also from inner shells Dichiara2012 . One may expect interesting new insights into the multi-electron correlations in many body systems Figueira2011 with mid-IR sources. In Sec. VI.1.2 we show first results of mid-IR driven double ionization with full coincidence detection.
III Validity of the dipole approximation
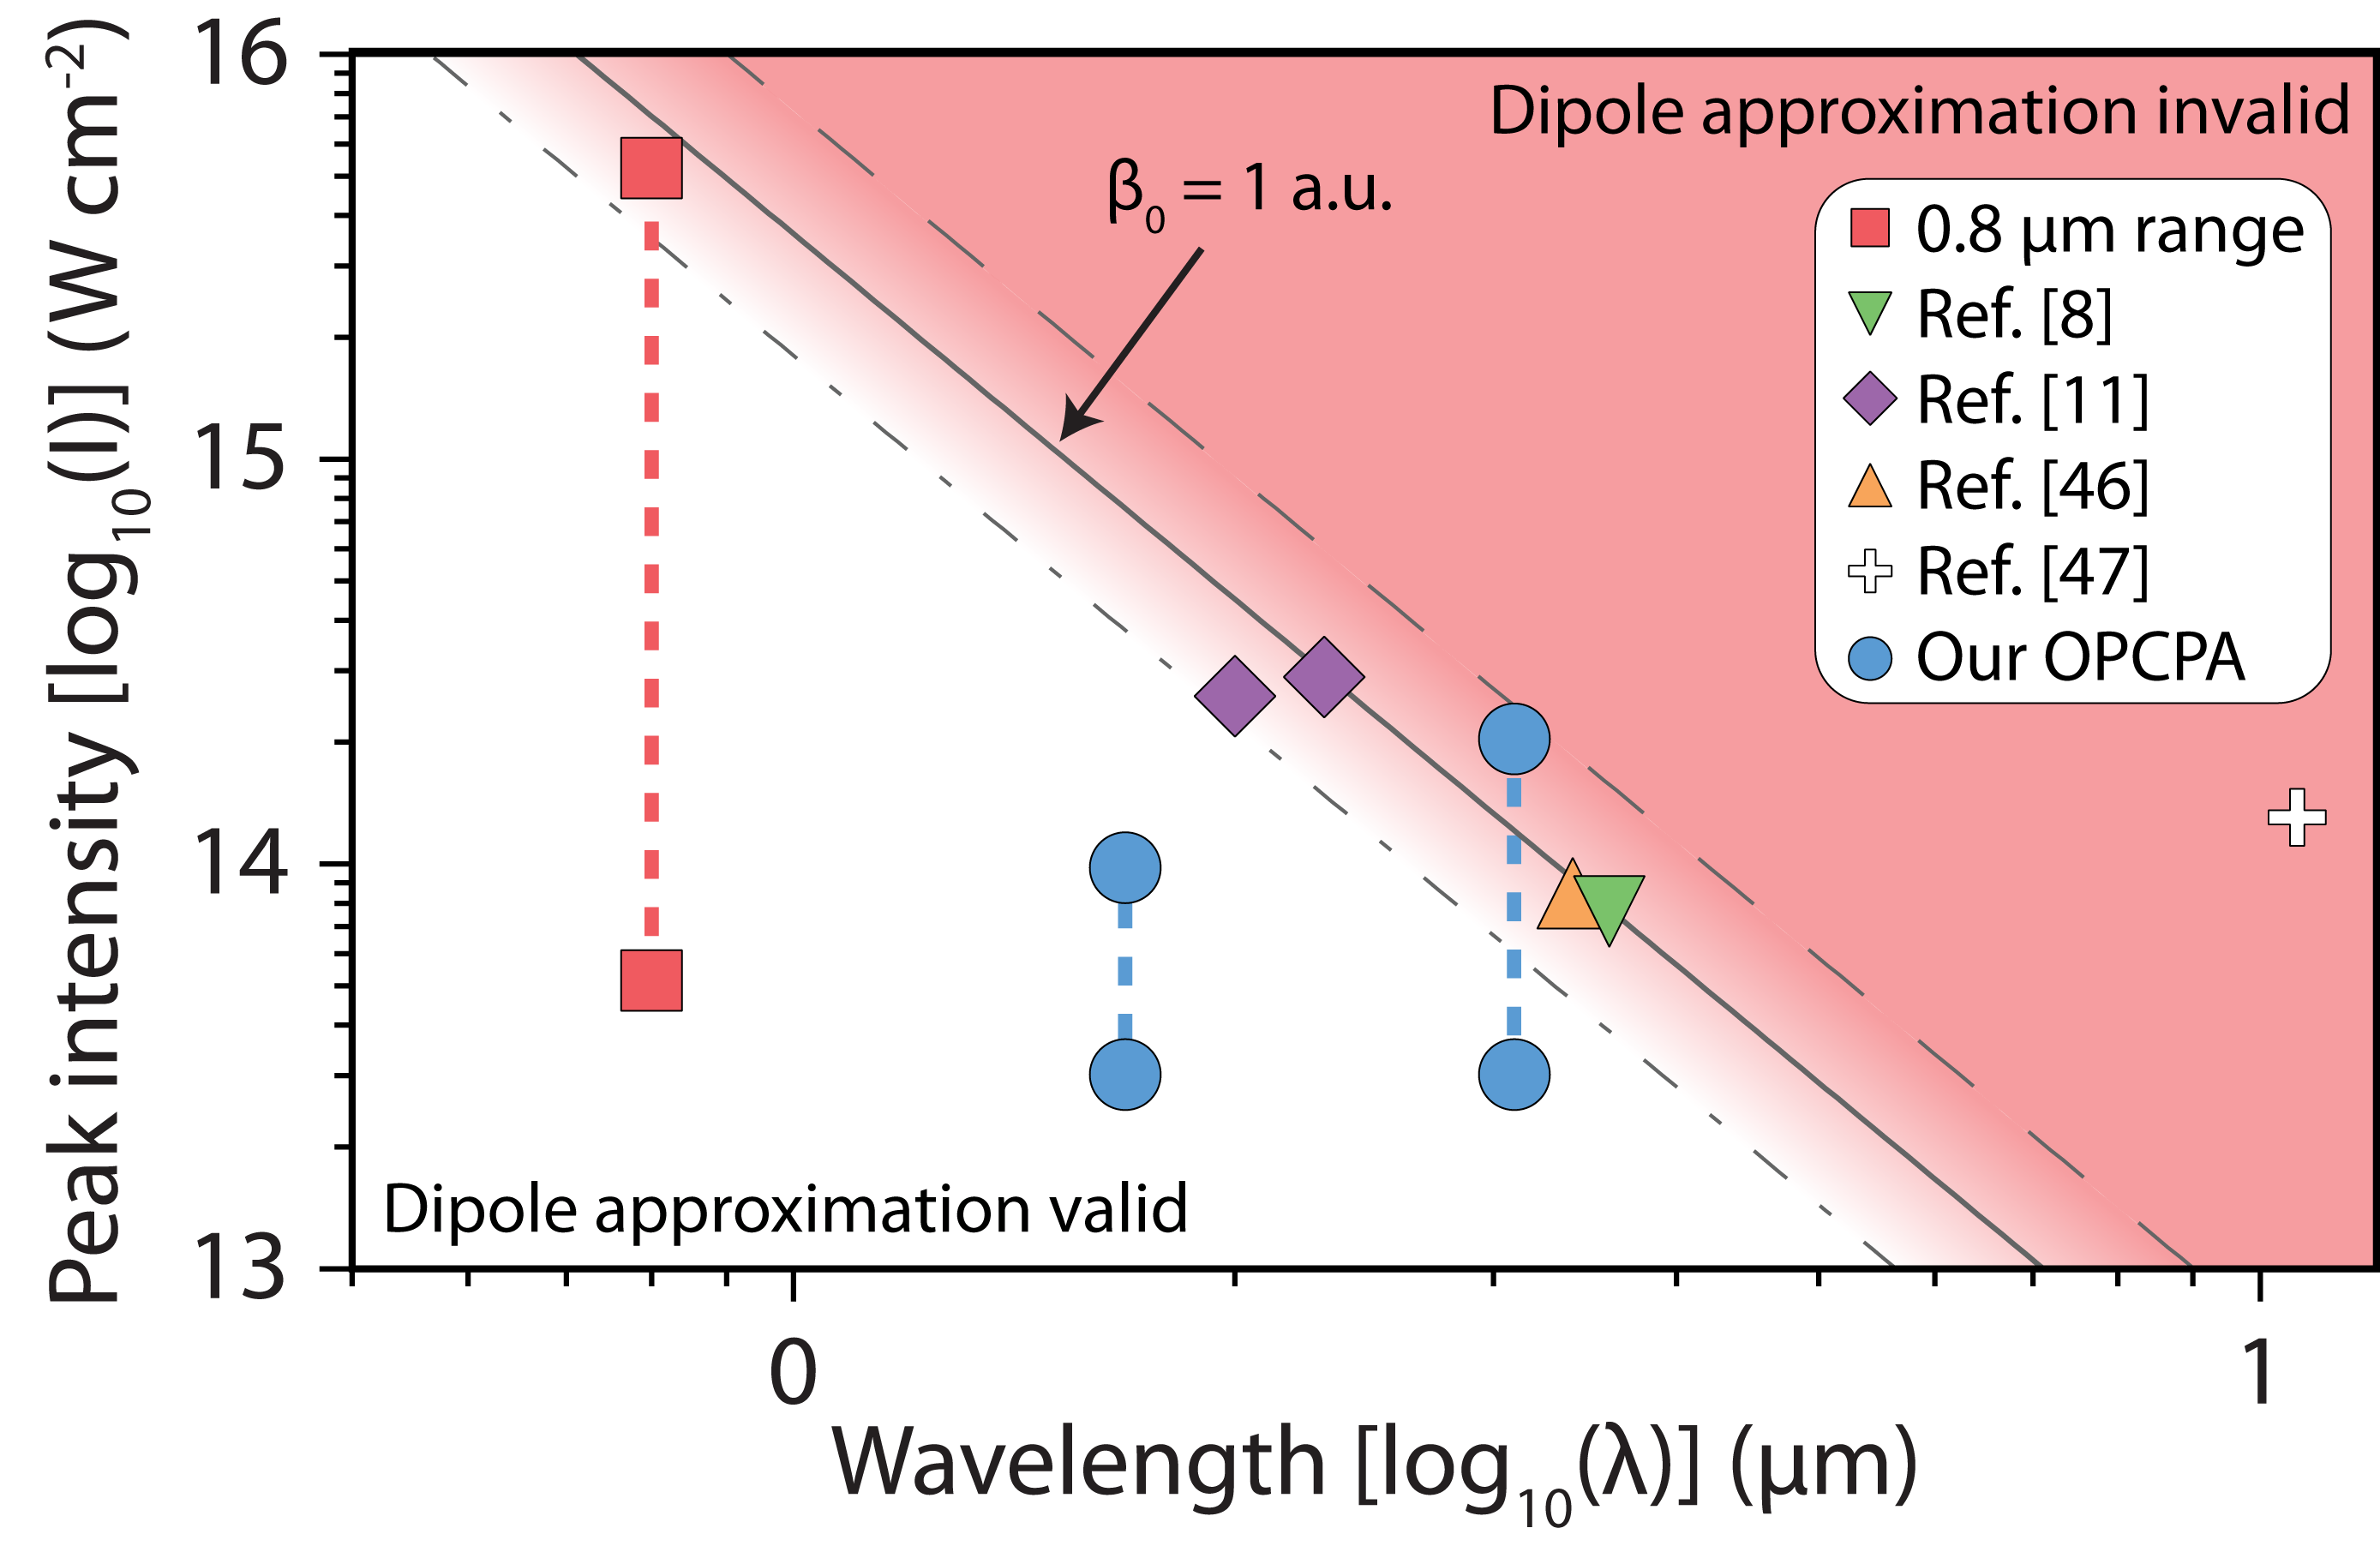
Many theoretical models used in SFP utilize the dipole approximation Reiss1992 , in which the influence of the magnetic field component on the electron motion is assumed to be negligible compared to that of the electric field component. However, when the electron displacement perpendicular to the field polarization direction () becomes comparable to a Bohr radius (i.e. a.u.), which can occur at long wavelengths and high intensities Reiss2008 ; Reiss2014 , the validity of the dipole approximation becomes questionable. The limit of a.u. is presented in Fig. 4 (solid black line) for a wide range of experimental driving wavelengths and peak intensities. The regions where the dipole approximation is valid (invalid) are represented by white (red) shading. Also shown are the limits for when a.u. and a.u. (dashed and dot-dashed black lines, respectively) to highlight the fact that the validity of the approximation is not defined by a clear threshold.
Most non-relativistic experiments at the standard 0.8 m wavelength are performed at intensities between W cm-2 (red squares and dotted line) where the dipole approximation is generally assumed to be valid. At longer wavelengths the limit of a.u. is reached at lower intensities and a number of experimental measurements with conditions near or above this limit have already been reported in the literature (Ref. Colosimo2008 - green down-triangle, Ref Blaga2012 - purple diamonds, Ref. Ludwig2014 - orange upwards triangle and Ref. Xiong1988 - white cross). Also shown are the intensity ranges over which the 1.7 m and 3.1 m of our OPCPA can be utilized for SFI experiments. The large intensity range of our 3.1 m radiation opens up the possibility for investigations across the a.u. a.u. transition.
IV On the importance of the detection system
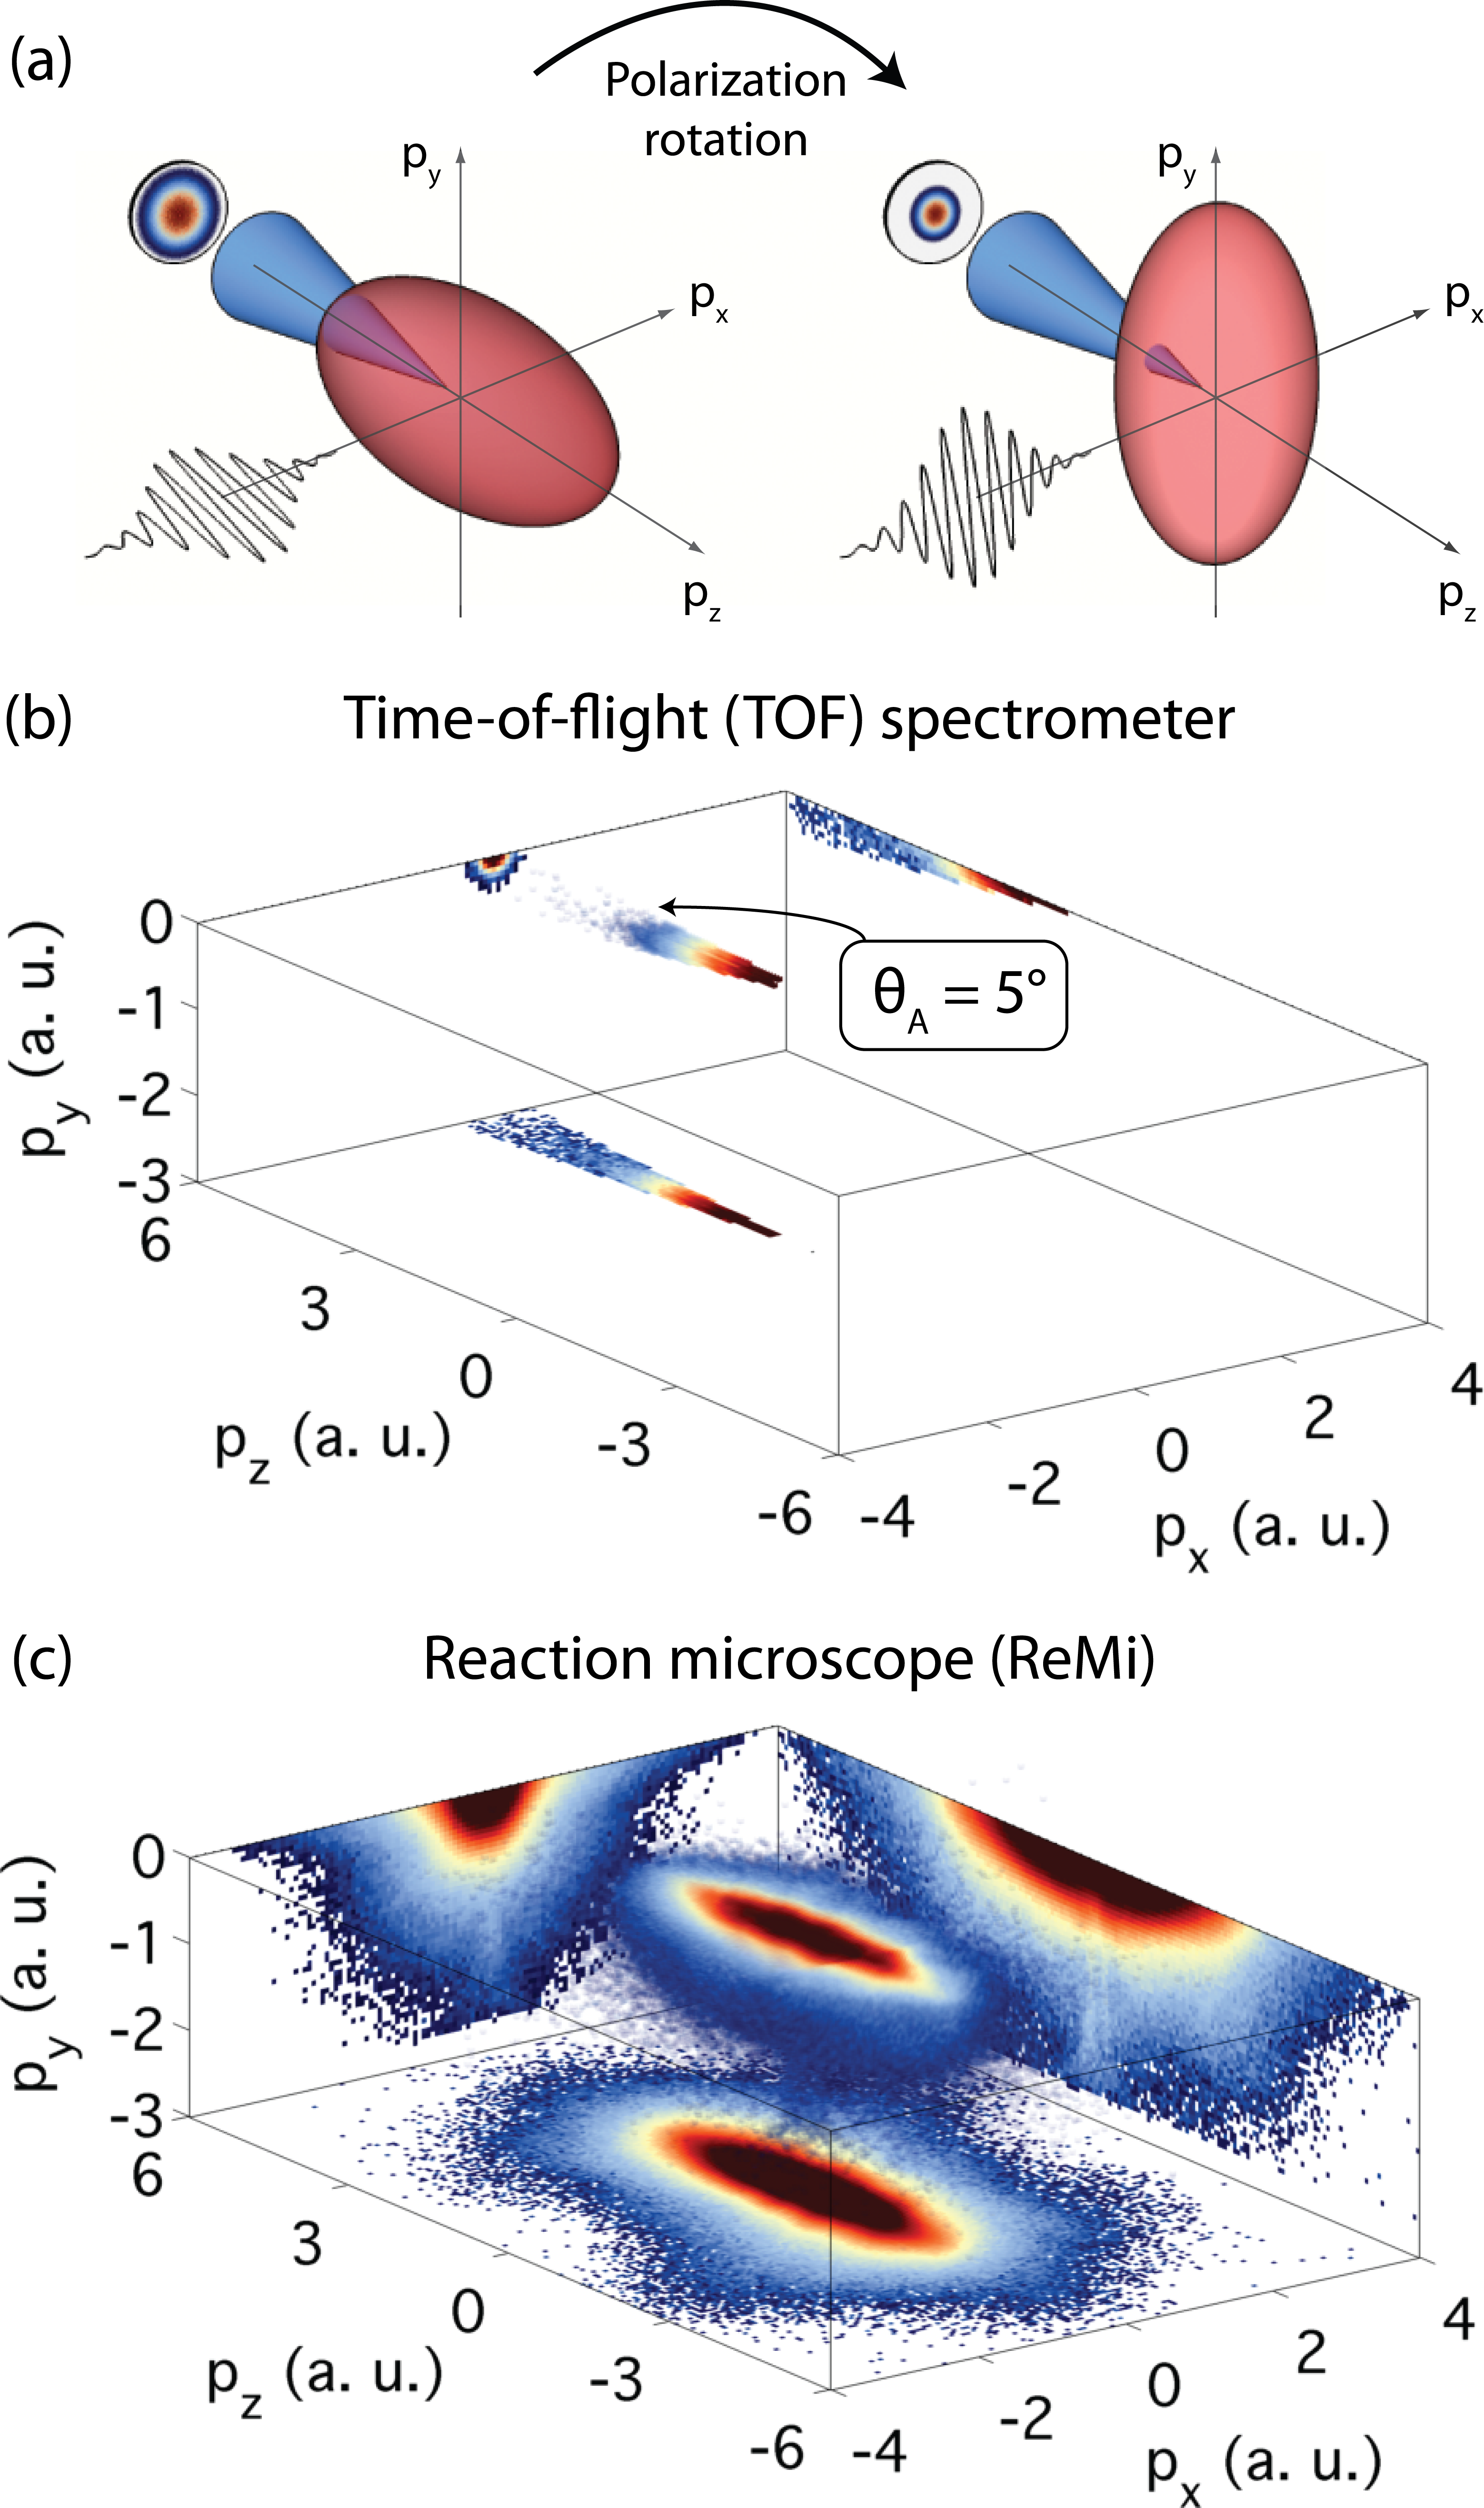
The interaction between a strong laser field and matter is inherently three dimensional (3D). To help visualize this scenario, a red ellipse is used to approximate a fictitious 3D momentum distribution in Fig. 5a. In the case of a linearly polarized field, such as considered here, the momentum distribution is extended more in the direction parallel to the laser polarization (longitudinal direction) than in the transverse directions. An established and still popular method to detect such a distribution is to use a time-of-flight (TOF) spectrometer where the energy of both positively and negatively charged particles can be calculated based on their arrival time after ionization. A typical TOF spectrometer could have an acceptance angle of about (represented by the blue cone), which corresponds to a solid angle that is about 10% of the full 4 sr. For such a detection angle, any particle that has a momentum component perpendicular to the TOF axis that is % of its parallel momentum component (i.e. ) will not be detected without rotating the TOF in azimuthal and polar angles about the interaction point. Additionally, any angular information within the acceptance cone is averaged over. Small pinholes can be installed to decrease the angular resolution but this is obviously accompanied by a dramatic drop in count rate. The laser polarization can be continuously adjusted between parallel and perpendicular (as presented in Fig. 5a) to the detector axis so that different parts of the momentum cloud can be observed. If this rotation is performed numerous times, a 2D ‘conical cut’ through the momentum distribution can be obtained Blaga2012 , however, the integration times required using this method are long. Recent investigations in the QS regime that detected low electron energy ( eV) structures where Wu2012 ; Dura2013 ; Pullen2014 ; Wolter2014 have highlighted the limitations of the TOF measurement technique as without the aid of high resolution 3D detection, these structures evaded observation.
An example of the portion of a 3D momentum distribution that would be measured by a TOF spectrometer is presented in Fig. 5b. This data was produced by taking the actual 3D momentum distribution, which was measured by our ReMi after the ionization of Xe gas using intense 3.1 m radiation (Fig. 5c), and only keeping those counts that were found within the cone around the laser polarization direction. Only the regions of the distributions with are shown in order to highlight the higher counts near the origin. The projections of the three spatial dimensions are also presented for both measurement methods. The color bar is valid for the 3D cloud but not for the projections as they have each been individually rescaled. Clearly, a TOF spectrometer only collects a small portion of the full electron momentum distribution. Specifically, and as mentioned above, any electrons that have a large transverse component would not be detected. In fact, for an acceptance angle of only about 2 % of all electrons are collected. The lack of signal in the TOF projections further highlights these issues. We note that the ReMi and TOF spectrometer distributions should be compared in a qualitative manner only as it is possible for TOF spectrometers to have a different detection angle, to be utilized in a stereo configuration, and to be used for varying laser polarization directions.
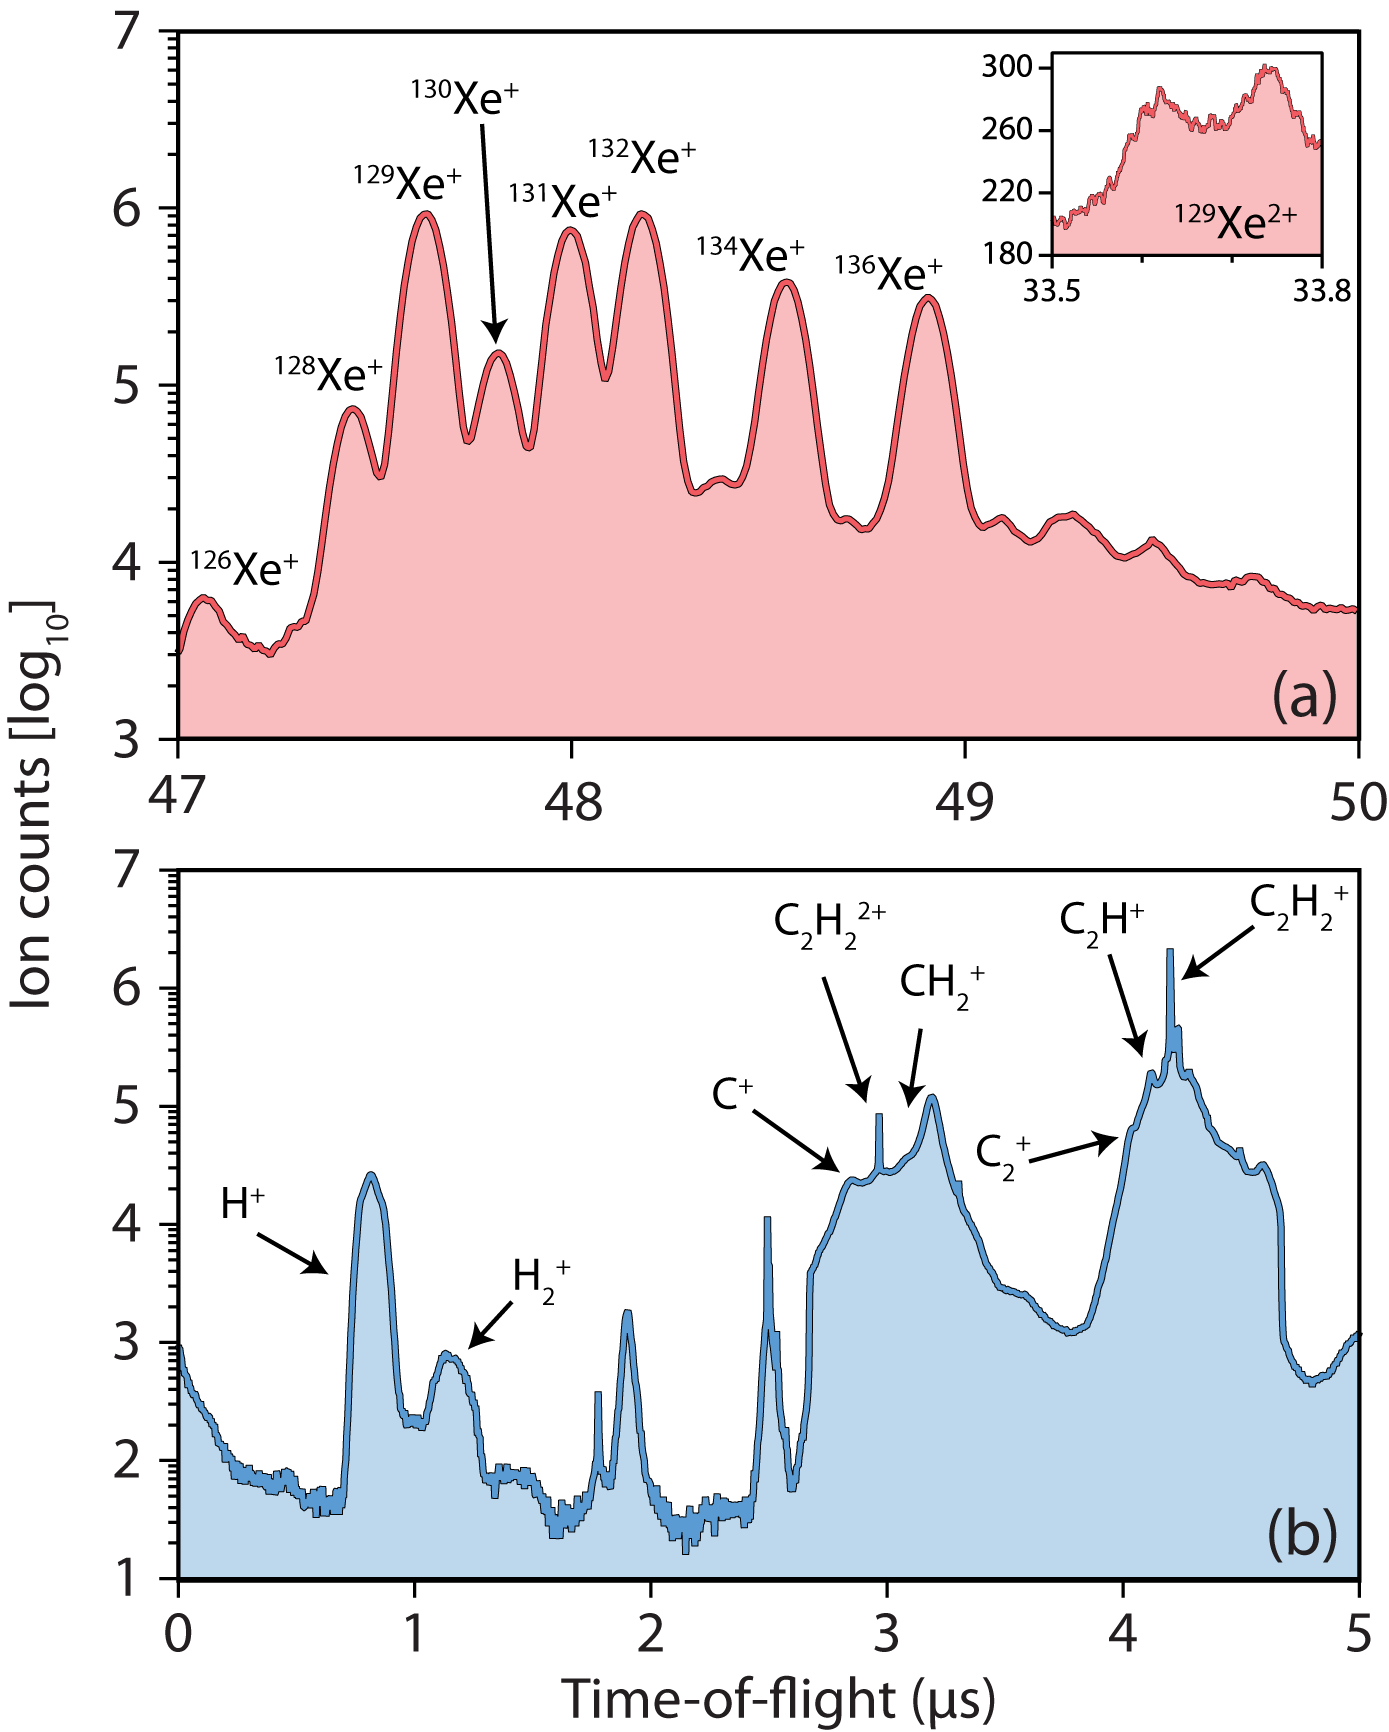
In addition to momentum distributions being intrinsically three dimensional, electrons may be detected that originate from all atomic and molecular fragments in the interaction region. This can include ions and isotopes of the target of interest, fragments generated from dynamical processes such as dissociation and Coulomb explosion, as well as background gases. The only way to separate out target specific electronic information is to correlate the detected electrons with their ionic partners Moshammer1994 ; Frasinski1989 . An example of an ionic TOF detected after the ionization of Xe by intense 3.1 m radiation is presented in Fig. 6. The singly ionized stable and long lived isotopes of Xe are resolved and their relative abundances agree with the known values CRC . Using a two particle coincidence condition, the electrons corresponding to the Xe+ ions can be isolated from the rest of the electron background. In Sec. VI.1 we perform such an analysis to investigate the low momentum part of the electron spectrum and we present why many of the features evaded detection with TOF spectrometers.
Statistics permitting, higher order particle coincidences are possible for multiple ionized ions. For example, the two peaks footnote1 corresponding to the doubly ionized 129Xe isotope are visible in the inset of Fig. 6. As this is a double ion, it has two corresponding electrons. Using a three particle coincidence condition, we can isolate the two electrons corresponding to each double ion. In Sec. VI.1 we present the results of such analysis and show, for the first time, an electron-electron correlation map resulting from NSDI triggered by intense mid-IR radiation.
The importance of coincidence detection becomes even more vital when molecular targets are investigated as they can undergo fragmentation upon SFI. In Fig. 6b the ionic TOF observed after the ionization of CH using similar laser parameters is presented. Clearly many fragmentation channels can be observed. Without coincidence detection, electrons not associated with the fragment of interest become an unwanted background signal that can detrimentally affect data analysis or cloud interpretation. This point is discussed in detail with respect to performing LIED on polyatomic molecular targets in Ref. Pullen2014a . As SFP continues to progress from atomic and simple homonuclear diatomics towards more complex molecular targets, coincidence detection will become increasingly vital to extract specific information within a myriad of competing processes.
There are currently two experimental methods that can achieve 3D detection in full coincidence: Firstly, velocity map imaging (VMI) Eppink1997 ; Takahashi2000 ; Laksman2013 is a technique where particles with the same mass and initial velocity are mapped onto the same position on a two dimensional (2D) detector. A VMI can provide electronic and ionic kinetic energies and angular distributions with full 4 sr collection whilst achieving energy resolutions on the percent level Ghafur2009 . Most VMI apparatuses require cylindrical symmetry to transform the detected projection into a slice through the centre of the 3D momentum distribution, however, in special implementations this is not necessarily the case Gebhardt2001 ; Whitaker2000 ; Vrakking2001 ; Dribinski2002 . Moreover, VMIs typically only operate in full particle coincidence in special circumstances Rolles2007 rather than by default. The second option is to use a ReMi Moshammer1996 ; Dorner2000 ; Ullrich2003 , as is this case in this manuscript, which is based on cold-target recoil ion momentum spectroscopy (COLTRIMS). The arrival time and position of all charged particles is detected in order to reconstruct the full 3D doubly differential cross-section of the interaction. The operating principle of a ReMi is described in Sec. V A.
V Experimental system
Our experimental system consists of a high repetition rate mid-IR OPCPA source with long term power and carrier-envelope phase (CEP) stability in combination with a ReMi detection system. The mid-IR source provides conditions in the QS regime while the ReMi images the entire 3D momentum distribution of the interaction in full coincidence. Overall, the system is currently capable of creating and detecting electron energies over a six order of magnitude range and it provides the perfect conditions to investigate and utilize mid-IR SFI in the QS regime.
V.1 Reaction microscope (ReMi)
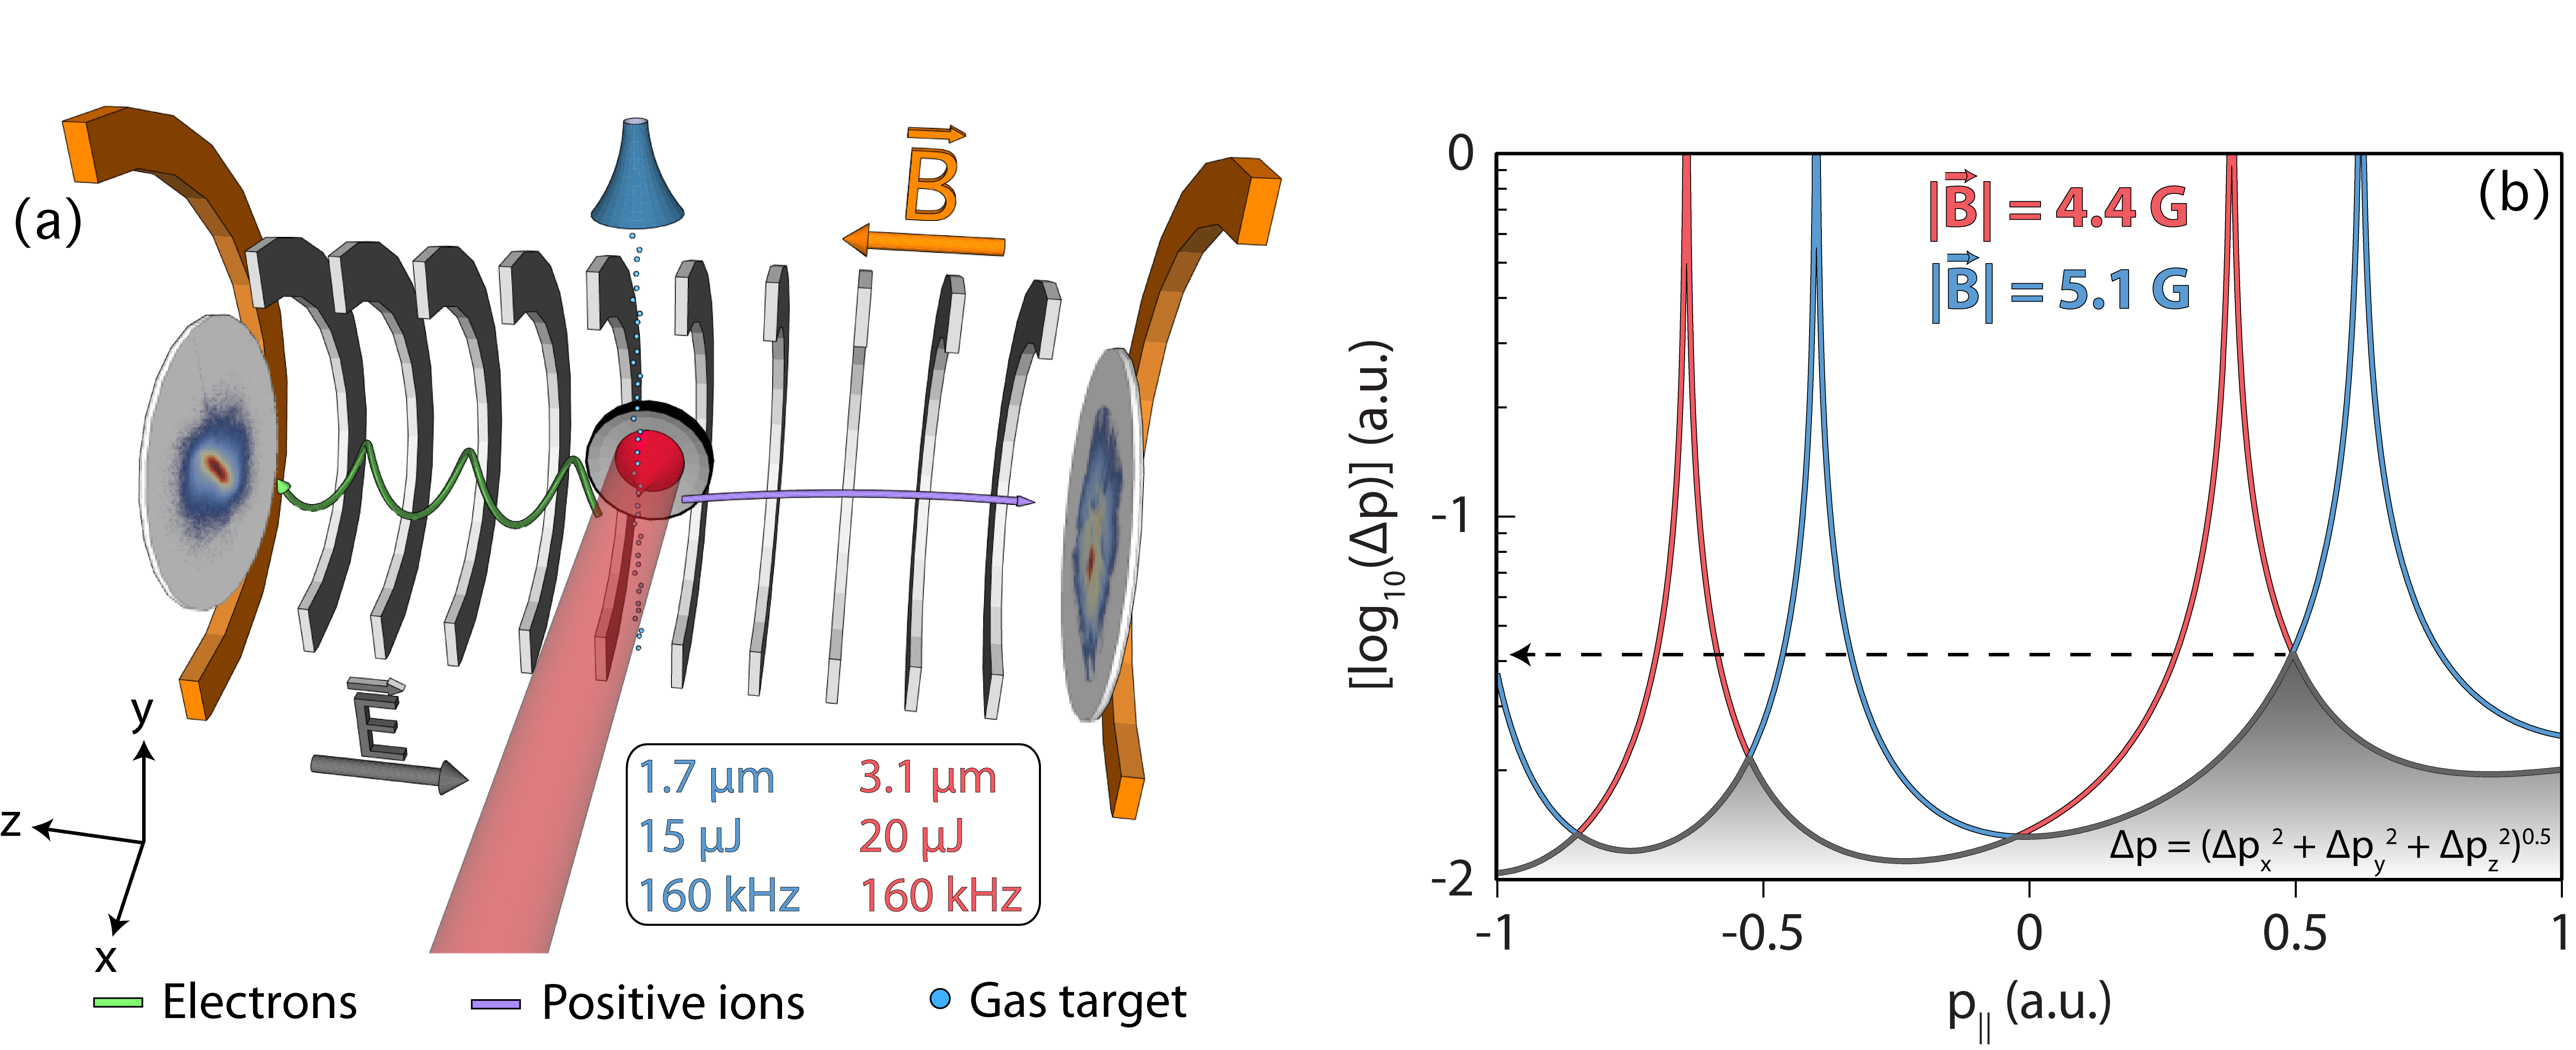
The functional principle of the ReMi detection system is as follows. The target gas is supersonically expanded into the ultra-high vacuum ( mbar without gas load) and is subsequently skimmed in two successive stages before reaching the ReMi. The expansion of the molecular beam thus features a decreased thermal motion of the particles and internal temperatures to the milikelvin range are feasible. Upon SFI, a combination of static electric () and magnetic () extraction fields direct all charged fragments to two opposing large-scale and position sensitive micro channel plate (MCP) detectors. The homogeneous electric field is created by a stack of metal electrodes inside the ReMi while the magnetic field is created by high current external coils. In Fig. 7a the negative and positive particles created during the ionization event are represented by green and purple arrows, respectively. The 3D momentum vectors (with the -axis along the laser propagation direction, the -axis being anti-parallel to the direction of the gas jet and the -axis along the direction of the static fields) and hence the kinetic energy of the particles can be calculated from the measured TOF and the position of impact. The choice of the electric and magnetic fields define both the momentum range that can be examined in the experiment and the achievable momentum resolution. By choosing relatively low fields, high momentum resolutions can be achieved, as presented in Fig. 7b. Here the total momentum resolution () has been calculated Ullrich2003 as a function of the longitudinal momentum () while V/cm is kept constant for both G (red curve) and G (blue curve). The observed discontinuities for both magnetic fields are due to electrons with integer multiples of the cyclotron frequency hitting the same position on the detector. While these so-called ‘nodes’ seem inconvenient at first, they turn out to be useful as they serve as an accurate and straight forward measurement of . Moreover, is it easy to remove these regions by taking two measurements with different magnetic fields and combining the areas with the highest momentum resolution. The results of this technique are represented by the grey shaded region in Fig. 7b where a.u. for all values of . In terms of energy these values correspond to detection resolutions of several meV. It is straightforward to further reduce the electric and magnetic fields to achieve even better momentum resolution. By choosing higher values of and it is possible to detect re-scattered electrons with kinetic energies of up to 1 keV. The magnitude of controls the maximum detectable longitudinal electron momentum component () while the maximum transverse component () is dependent on the magnitude of . Figure 5c presents a logarithmically scaled 3D momentum distribution detected under these high static field conditions ( V/cm and G) where electron energies of eV were detected.
V.2 Mid-IR OPCPA system
The OPCPA system Thai2011 ; Hemmer2013a is based on a multi-color fiber frontend with difference frequency generation (DFG) between the two outputs supplying broadband mid-IR pulses at 3.1 m center wavelength. The DFG stage is a crucial component of the OPCPA as it provides passive carrier-envelope phase (CEP) stability optically. The intrinsic CEP stabilization is a decisive advantage over electronically stabilized systems which manifests itself in unsurpassed long time stability of our system. The system provides both 1.7 m and 3.1 m radiation. At 3.1 m, pulse durations below three optical cycles FWHM are achieved (32 fs = 2.9 optical cycles) Hemmer2013b . The 3.1 m output is passively CEP stable and a stability of 250 mrad rms over 11 minutes has been measured Thai2011 . Without any additional effort, pulse durations of 100 fs are reached for the signal at 1.7 m. The 15 J and 20 J pulse energies of the 1.7 m and 3.1 m wavelengths, respectively, are focused with an on-axis, gold-coated paraboloid (focal length of 50 mm) into the gas jet of the ReMi. Intensities in the range of W cm-2 are readily achieved for both wavelengths.
V.3 The importance of repetition rate and stability
A major challenge in performing SFP experiments with long wavelength sources is quantum diffusion Watson1997 . Here the electron wavepacket experiences larger longitudinal and transverse spreading due to the longer excursion time at increased wavelength. Consequently, the larger extent of the recolliding wavepacket results in a smaller recombination or recollision cross-section which manifests in reduced count rate when driving SFP at longer wavelength Tate2007 ; Frolov2008 . Experimental evidence shows that the ratio of re-scattered to directly emitted electrons scales roughly as Colosimo2008 .
We choose to highlight this crucial point for experimental investigations in Fig. 8 by defining an arbitrary standard unit of ‘acquisition time’ (AT) to be the time required to reach a certain signal-to-noise ratio of re-scattered electrons when using a standard 1 kHz, 0.8 m radiation source (dashed black line). Using the above mentioned scaling and assuming all other experimental parameters stay constant, we can estimate the number of standard ATs required to reach the identical signal-to-noise ratio as a function of driving wavelength. The results of this calculation are presented in Fig. 8 for 1 kHz sources (blue curve). The triangular data points represent the wavelength of some sources that have recently been used to study electron re-scattering Colosimo2008 ; Blaga2009 ; Blaga2012 . The required ATs for identical signal-to-noise scale rapidly with wavelength; compared with 0.8 m radiation we predict a one and two orders of magnitude increase for 1.4 m and 2.5 m radiation, respectively. At a wavelength of 3.6 m the required AT is over 400. We would like to put the arbitrarily defined ATs and the quoted numbers into perspective: if a standard AT is equal to one hour then at 3.6 m the new experimental time would be over 17 days. Clearly, the unfavorable wavelength scaling of SFP must be addressed to ensure continual advancement of the field.
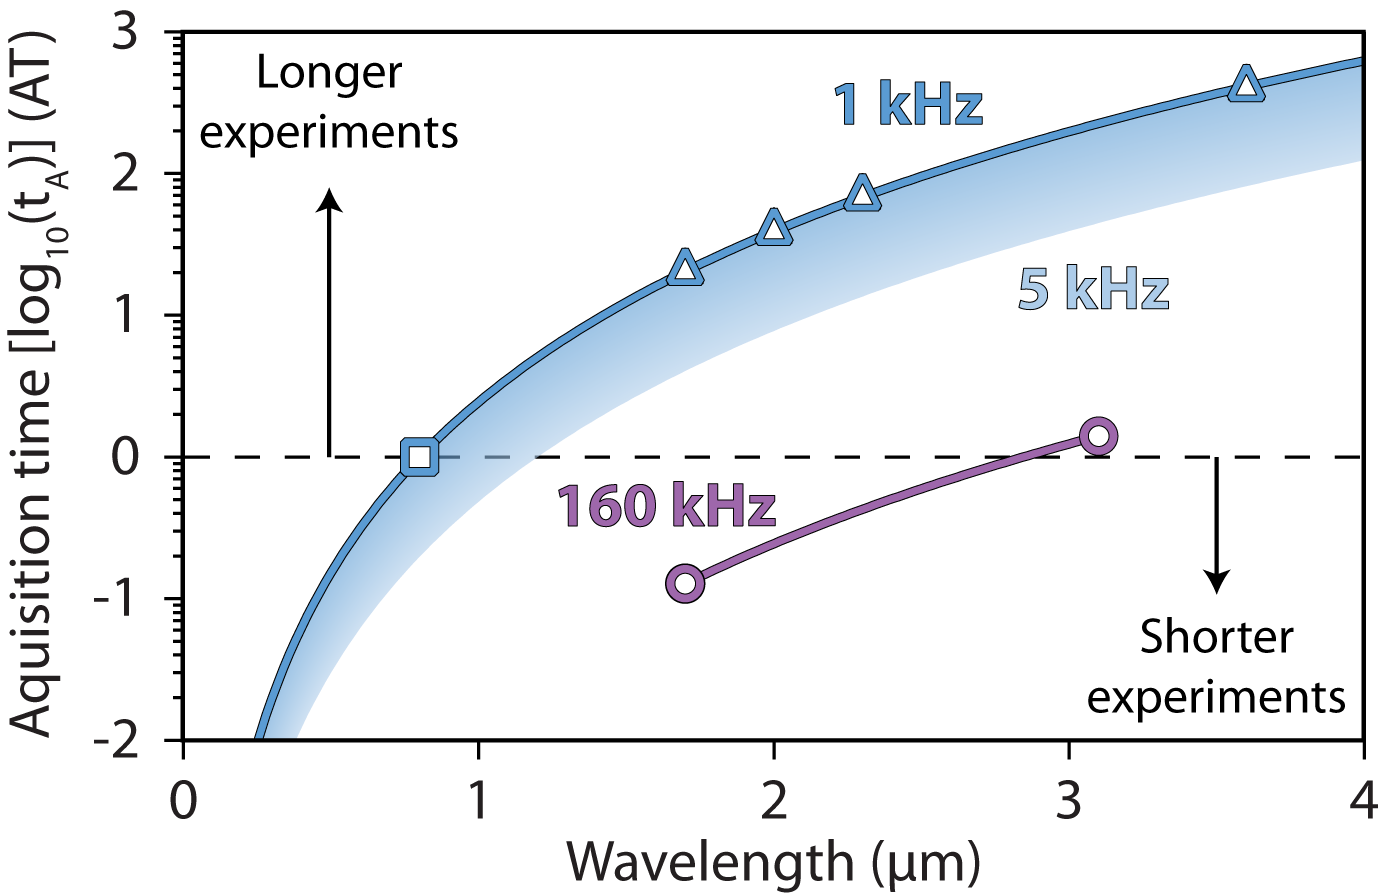
An obvious solution to this dilemma is to increase the repetition rate of the driving laser Chalus2008 ; Chalus2009 ; Furch2013 ; Matyschok2013 . Ti:Sapphire based laser systems Colosimo2008 ; Blaga2009 ; Quan2009 ; Wu2012 are typically limited to a few kHz; the range of acquisition times that can realistically be achieved with such systems is represented by the blue shaded region in Fig. 8. Mid-IR sources at much higher repetition rates, i.e. above several tens of kilohertz, can be realized with a range of techniques but so far only OPCPA has provided a viable solution. High average power fiber laser sources are operational, but additional down conversion into the mid-IR carries a dramatic penalty in pulse energy. Moreover, few-cycle durations and CEP stability are not possible with such sources at high intensities ( W cm-2). Another approach could be based on passive enhancement cavities Pupeza2010 in the mid-IR but such apparatuses are extremely challenging and are yet to be implemented outside of the near-IR. Due to these technical problems we have devised a radically new platform Chalus2008 ; Chalus2009 (summarized in Sec. V.2) that leverages the concept of OPCPA to achieve the combination of mid-IR wavelength (3.1 m), few-cycle pulse duration ( 2.9 cycles) with CEP stability, SFP relevant intensities ( W cm-1), 160 kHz repetition rate and long term stability ( rms over 4.5 hours) Hemmer2013a . Additionally, parasitically generated wavelengths such as the OPCPA’s signal at 1.7 m can be used for further frequency down-converison. When the above ‘acquisition time’ analysis is applied to the two wavelengths of our system it is found that the required experimental time is actually an order of magnitude less than a standard AT for 1.7 m and only 40% longer for 3.1 m (the purple circles in Fig. 8). Combining these points with the fact that the mid-IR source can actually reach a , it is clear that mid-IR OPCPA solves the problem of studying SFP at longer wavelengths.
VI Experimental capabilities
We now demonstrate the capabilities of our approach by investigating strong-field electron recollision at low and high energies. We choose Xe as an example for which we measure a eV wide kinetic energy spectrum after ionization with intense 3.1 m radiation. By optimising the electric and magnetic guiding fields of the ReMi, as discussed in Sec. V, we investigate different parts of the spectrum. With low fields we resolve meV features at energies below 1 eV while with high fields we collect all ejected electrons up to energies of hundreds of eV.
VI.1 Low energy recollisions
As already described briefly in Sec. I, experimental investigation of SFI with longer wavelength laser sources (m) revealed unexpected behavior in the observed electron energy spectra that deviated from SFA predictions Blaga2009 ; Quan2009 . In addition to the well-known form of the kinetic energy spectrum and the drop in yield beyond directly emitted electrons, a peaked structure at low energies ( eV) was observed. This feature, dubbed the low-energy structure (LES), was found to result from the interplay between the Coulomb binding potential and the laser electric field Faisal2009 ; Liu2010 ; Yan2010 . Additional features have been observed at even lower energies and were dubbed very low energy structures (VLES) Wu2012 . In these cases the description of the interaction using SFA based models seemed to be missing crucial aspects of the post ionization behavior of the electron in the laser field. It was found that multiple ‘revisits’ of the electron close to the ionic core, and therefore within the influence of the Coulomb field, had the affect of bunching the oscillating electrons in momentum space Lemell2012 ; Kastner1 ; Kastner2 ; Lemell2013 ; Guo2013 ; Lin2014 . It is interesting to note that classical trajectory calculations that ignore the Coulomb potential were able to reproduce the LES features Becker2014 , however, the Coulomb potential markedly enhances the effect. From an experimental point of view it is important to remark that the LES was originally measured using a TOF spectrometer, which, as explained in Sec. V, only detects a small fraction of the entire momentum distribution. This restriction in detection translated into incomplete coverage of the momentum space, thereby missing a large fraction of information from the observed effects. A comprehensive picture of the observed effects was gained from our full 3D and high resolution momentum measurements with a ReMi Dura2013 ; Pullen2014 . In these measurements, an additional feature near zero momentum was observed and called the zero energy structure (ZES). Recently, we performed a combined experimental and theoretical investigation Wolter2014 in which the origins of all three features were quantitatively confirmed to be due to two-dimensional Coulomb focusing (for the LES and VLES) and post-ionization recapture of electrons into high-lying Rydberg states with subsequent field ionization (for the ZES). The latter mechanism is also known as frustrated tunnel ionization Nubbemeyer2008 ; Landsman2013 .
VI.1.1 Singly ionized Xe
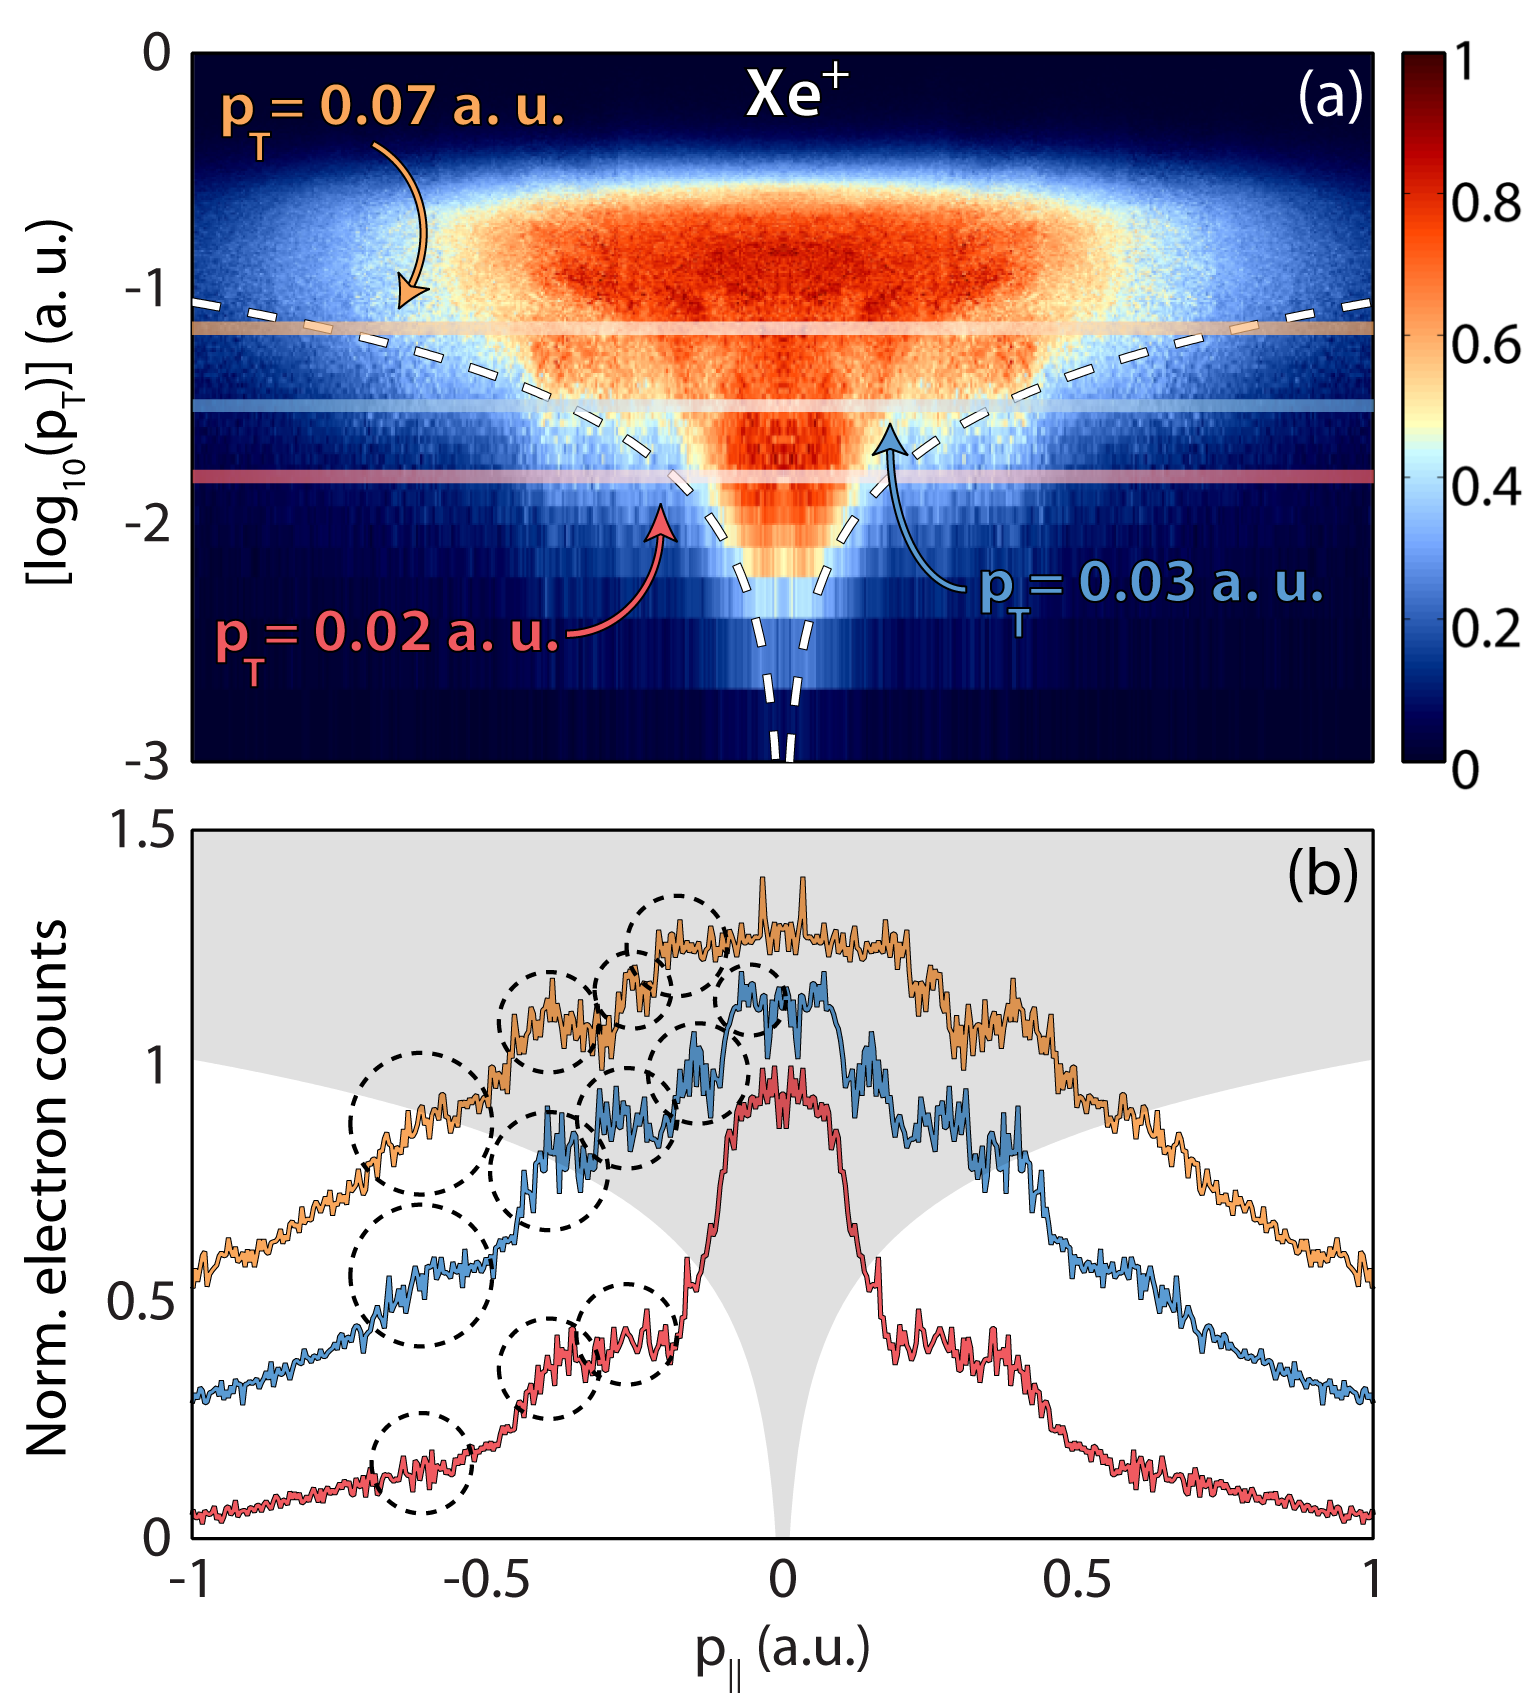
Figure 9 presents kinematically complete measurements of single ionization of Xe using 3.1 m radiation at a peak intensity of W cm-2 and a pulse duration of 71 fs (7 optical cycles, ). In Fig. 9a the resulting electron momentum distribution corresponding to Xe+ is presented in cylindrical coordinates after integration over the azimuthal angle (see Fig. 11 for further details). While the symmetric distribution shows similar characteristics to studies performed on other targets such as Ar Dura2013 ; Pullen2014 ; Wolter2014 , O Dura2013 and N Pullen2014 , more low energy features seem to be visible. We find a broad distribution of direct electrons with pronounced low energy features, with the most distinct being the merged VLES and ZES near a.u. and a.u.. Note that compared to Ar, O and N, the ZES in Xe does not appear as clearly (see Fig. 2 of Ref. Pullen2014 for a direct comparison). The experimental conditions for Xe, compared to the other species we investigated, included a lower peak intensity of the laser ( W cm-2 measuring Xe compared to W cm-2 measuring Ar Wolter2014 ) despite a higher extraction field of the ReMi (2.0 V/cm in the case of Xe compared to 1.3 V/cm in the case of Ar Wolter2014 ). To highlight the individual features three normalized horizontal line-outs are presented in Fig. 9b at values of a.u. (red curve), a.u. (blue curve) and a.u. (orange curve). The a.u. and a.u. curves have been offset by and , respectively, to enhance visibility. The a.u. curve shows the richest structure with five different structures being resolvable: LES at a.u., LES at a.u., LES at a.u., LES at a.u. The characteristic V-shape associated with the VLES Wu2012 is visible between a.u. The positions of the LES orders (dashed black circles) agree well with predictions Kastner2 . For the a.u. and a.u. line-outs the visibility of the various LES orders vary. The other most striking feature is the centre peak () for a.u., which corresponds to the ZES. Note that the white dashed line in Fig. 9a represents the acceptance cone for a TOF spectrometer with and with its axis along the polarization direction. Higher transverse momentum parts of the LES orders, the VLES and the ZES, such as those within the grey shaded area in Fig. 9b, are not detected when using such an apparatus. This elucidates the need for 3D imaging of the momentum space in order to observe all low energy recollision features.
VI.1.2 Doubly ionized Xe
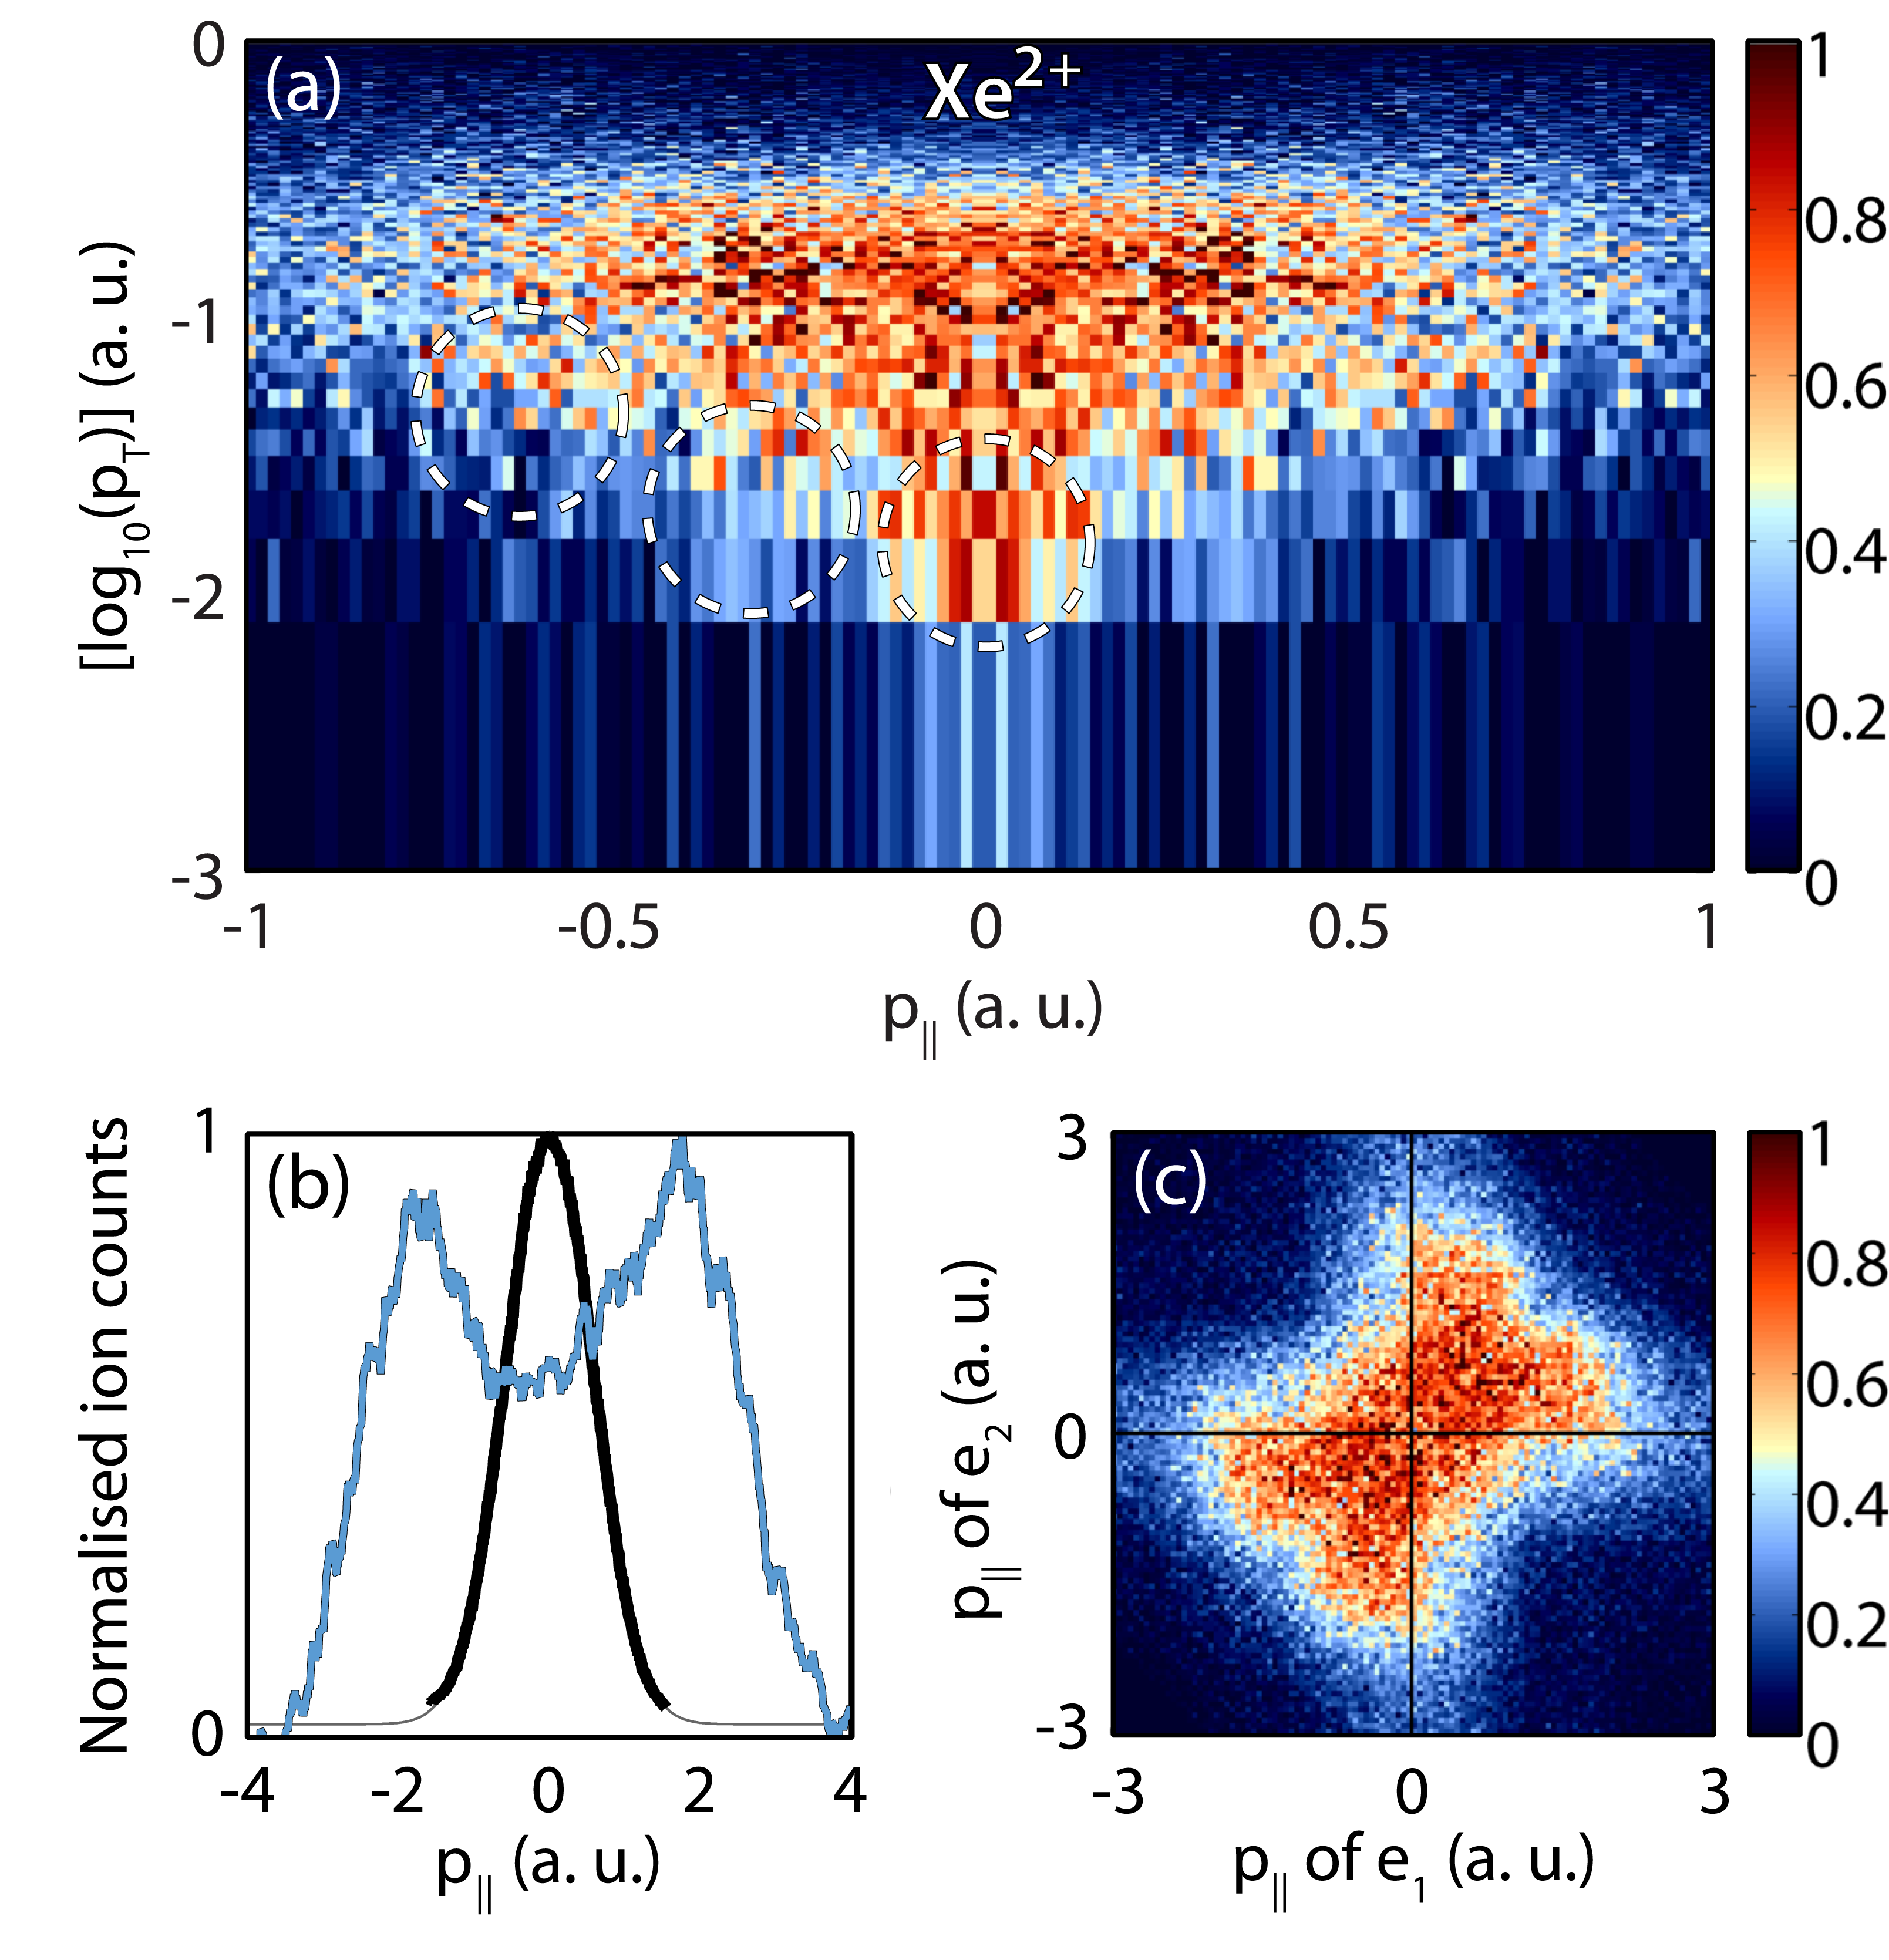
Next, we use the coincidence detection capabilities to extract electrons corresponding to doubly ionized xenon atoms Xe2+ only. Figure 10 shows the first coincidence measurements of doubly ionized Xe with mid-IR fields, and we obtain high measurement statistics due to the stability and repetition rate of our OPCPA system. The data exhibits a distribution similar to the Xe+ data with three possible structures seemingly emerging above the noise floor: 1) a feature at a.u. and a.u., which is close to LES for Xe+; 2) a feature near a.u. and a.u., which is close to LES or LES for Xe+; and 3) a VLES like distribution at a.u. and a.u.. These results indicate, for the first time, that electrons also could undergo multiple recollisions with the ionic Coulomb field during double ionization.
To determine the mechanism behind mid-IR double ionization Kopold2000 ; Feuerstein2001 we plot the parallel momentum distribution of the double ions (see Fig. 10b) and the correlation between the two electrons ((e1,e2), Fig. 10c). The parallel momentum distribution of the double ion, in Fig. 10b, clearly shows the double hump structure which is characteristic of NSDI Moshammer2000 and is not explained by sequential double ionization (SDI), where two electrons are emitted independently at subsequent laser field maxima. NSDI exhibits two mechanisms: 1) the recolliding electron can cause the direct emission of a second electron via electron-impact ionization, otherwise known as (e,2e) ionization Corkum1993 ; or 2) recollision excitation with subsequent ionization (RESI) Shaaran2010 where the first electron excites the parent ion which leads to tunnel ionization of a second electron. The form of the double hump in Fig. 10b, i.e. the central dip not being deeply pronounced, is already an indication that both mechanisms of NSDI are present. Further information can be extracted from the electron correlation plot in Fig. 10c. The spectrum is symmetric about due to the indistinguishability of the two electrons in the experiment. To interpret the measured correlation pattern, we recall that a correlation (first and third quadrants) means that both electrons leave in the same direction (and in the direction opposite to the double ion) WeberNature2000 , while an anti-correlation (second and fourth quadrants) means that the electrons escape in opposite directions to each other (the double ion exhibits no momentum) Feuerstein2001 . The RESI mechanism was described previously Shaaran2010 and due to energy sharing exhibits ’cross-shaped’ distributions parallel to the horizontal and vertical axes of the (e1 ,e2) correlation plot. Figure 10c shows features reminiscent of both (e,2e) and RESI. Interestingly, upon first inspection, the shape of the measured correlation shows a striking similarity to Fig. 7c of Ref. Bergues2012 where RESI was found to be the dominant mechanism for very different experimental parameters. In that paper, Bergues et al. Bergues2012 observed similar features in Ar for near-single-cycle pulses at = 750 nm and at W cm-2. Our conditions for Xe are markedly different with a 6.5 cycle pulse (71 fs) at W cm-2 in the mid-IR. Without accompanying theoretical calculations it is difficult to determine the exact contribution of either mechanism, however, theoretical investigations into mid-IR double ionization are only now starting to become available Tang2012 ; Zhang2013 ; Tang2013 . When combined with these first ever full coincidence mid-IR double ionisation results theoretical models will be able to unravel the mechanisms of double ionisation within the mid-IR regime.
VI.2 High energy recollisions
The capability of our apparatus towards investigating SFI at high electron energies is demonstrated next. We measure doubly differential electron scattering cross-sections (DCSs) using LIED Zuo1996 ; Spanner2004 ; Yurchenko2004 . The realization of LIED is dependent on two key points: 1) the generation of high impact energies for the recolliding electrons; and 2) the ability to extract field free DCSs despite the presence of the strong laser field. Both conditions are fulfilled with our apparatus. Previously, such measurements of the DCS were either limited due to the shorter wavelength of the Ti:Sapphire laser, or the inability of collecting the full 3D momentum distribution Ray2008 ; Okunishi2008 ; Okunishi2011 ; Blaga2012 ; Xu2012 ; Okunishi2014 . Here, we show the first LIED experiment based on 3D momentum detection in full particle coincidence.
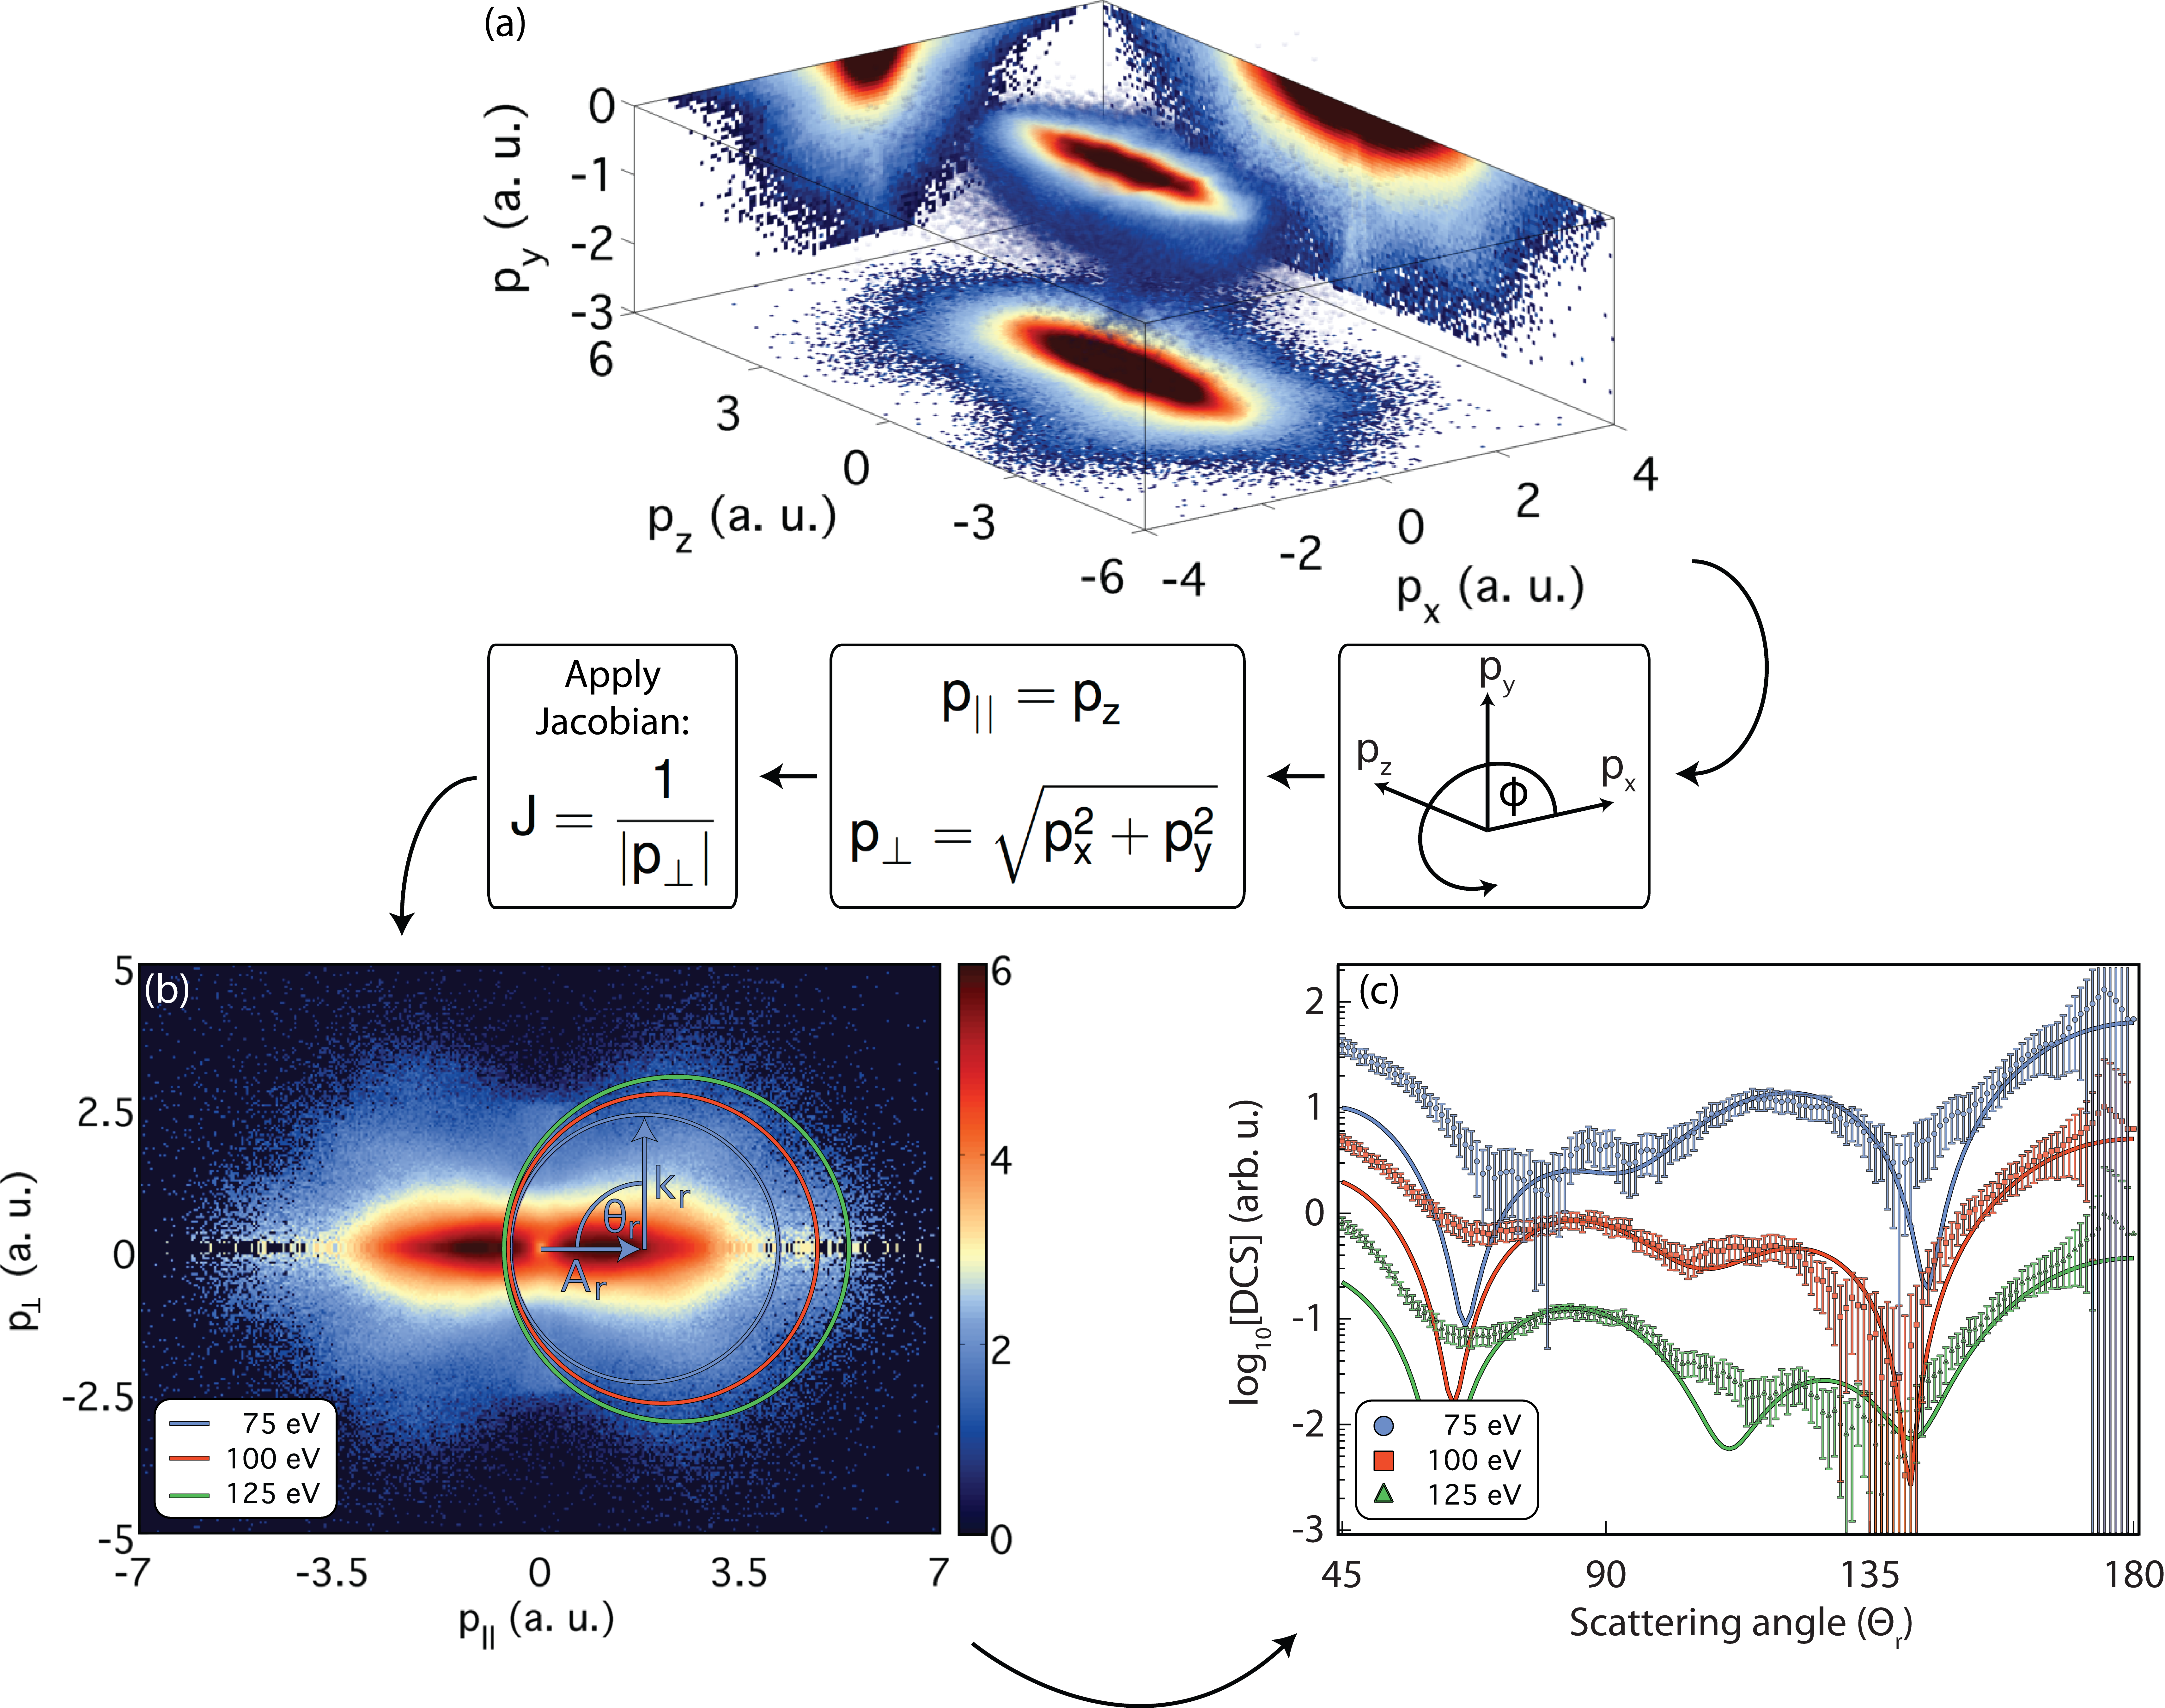
Mid-IR LIED is achieved by operating the ReMi at high static electric and magnetic fields to detect the entire 3D momentum distribution of the emitted electrons. Figure 11a displays the momentum distribution created during the interaction of our intense 3.1 m radiation with Xe atoms. After an integration over the azimuthal angle and the application of the appropriate co-ordinate transformation (Jacobian ), a 2D momentum map representation of the detected momentum distribution is extracted (Fig. 11b). The momentum map covers a six order of magnitude range in counts and features an unprecedentedly rich structure. DCSs are extracted from the 2D momentum distribution (or diffraction pattern) in a manner similar to conventional electron diffraction (CED) provided that three critical criteria are satisfied: 1) QS conditions must be achieved so that the final momentum distribution of electrons can be expressed as the product of the field-free DCS multiplied by the returning electron wave packet Chen2009 . In this case, the vector potential of the driving field can easily be calculated and taken into account and field-free DCSs can be extracted; 2) the returning electron wavepacket must be energetic enough to probe the core of the target and not the valence electronic structure (i.e. eV); and 3) the recolliding electron must propagate sufficiently far away from the interaction region such that it approximates a plane wave upon return. These three requirements can only be simultaneously satisfied by intense mid-IR sources ( W cm-2 and m). Once these stringent conditions are satisfied, the achieved momentum transfers are similar between LIED and CED despite the difference in incident electron energies and scattering angles. That means in mid-IR LIED, electron energies eV that scatter at angles between are typically utilized while in CED the electron energies are on the order of eV and scatter at forward angles (). This means that the classical momentum transfer (, where is the electron incident momentum) is comparable for both methods and, as such, mid-IR strong-field induced re-scattered electrons contain structural information of the target gas.
The theoretical framework behind the analysis of the mid-IR LIED pattern is provided by the quantitative re-scattering (QRS) theory Chen2009 ; Lin2010 ; Xu2010 . This model states that angularly resolved DCSs (up to an overall scaling factor) can be extracted from the measured electron momentum distribution by tracing the measured counts along the circumference of a circle of radius that has been shifted from the origin by the vector potential of the laser at the time of re-scattering (). Here is the incident momentum of the re-scattering electron with energy . The relation between the incident energy of the returning electron and the final electron energy of the rescattered electron is plotted in the inset of Fig. 1 for both long and short trajectories (derivation from e.g. in section II.A. of Chen2009 ). An example of this extraction procedure for 75 eV (blue), 100 eV (red) and 125 eV (green) energy electrons is presented in Fig. 11b. The extracted DCSs are presented in Fig. 11c as a function of the scattering angle. As each returning electron encounters a slightly different vector potential, the rescattering circles are shifted by differing amounts. The 75 eV (blue circles) and 125 eV (green triangles) data have been scaled by factors of and compared to the 100 eV (red circles) data, respectively, in order to enhance visualization. The error bars are derived from Poissonian statistics and are propagated through the integration and co-ordinate transformation procedures. The large error bars at are due to the application of the Jacobian mentioned above. Also presented in Fig. 11c are the Xe DCSs provided by NIST NIST , which have been scaled to overlap with the experimental data. Our data are able to accurately resolve most of the predicted rich structure for . For these angles the maxima and minima as well as slope changes are generally well reproduced while for smaller scattering angles () the data is ’contaminated’ through background arising from direct electrons. While these direct electrons cause a slight mismatch between the experimental and theoretical data, the minima between are still resolvable. Overall we observe an excellent match between our measured data and the theoretical expectations. We note that the presented NIST data is calculated for neutral Xe. It has been shown that the electron energies utilized here ( 50 eV) are core penetrating and can be used to extract structural information Pullen2014a . Therefore the electronic structure of the target has a negligible effect on the extracted DCSs for these experimental conditions. These results show that field free DCSs can indeed be extracted over a wide range of energies and scattering angles at unprecedented accuracies.
VII Summary and outlook
We have presented a unique methodology to investigate mid-IR driven SFP with a high repetition rate mid-IR OPCPA system in combination with a ReMi that is able to detect ionization fragments over a six order of magnitude energy range. This apparatus now permits unambiguous investigations of SFI and related effects in the deep QS regime, thereby allowing experimental observations to be scrutinized against theoretical descriptions. We demonstrate our concept across the entire accessible kinetic energy scale by investigating SFI and electron recollision with Xe atoms. We observe low energy structures up to the fourth order, the VLES and the ZES in Xe but find a much reduced ZES that would arise from capture into Rydberg states and subsequent ReMi field ionization. This surprising absence of a strong ZES peak in Xe already warrants further investigation as it will prompt information about the FTI process. Next, first coincidence measurements of mid-IR driven NSDI are shown. The analysis of the data hints at the combined action of (e,2e) and RESI mechanisms. Interestingly, this very first (e1,e2) correlation map in the deep QS regime () for a 6.5 cycle pulse exhibits features that were observed for entirely different conditions with a near-single-cycle CEP-stable pulses at = 750 nm in Ar and for Bergues2012 . Lastly, we exploit the high energy detection capabilities of our apparatus with mid-IR LIED. We achieve core penetrating conditions that permit extraction of the doubly differential elastic electron scattering cross section in Xe and the retrieved DCSs match published NIST data very well. Probing atomic structure with mid-IR LIED carries clear potential for the realization of femtosecond time resolved imaging of molecular structure and for tracking atomic constituents during structural changes such as isomerization or dissociation. In fact, recent results from our group show that the method can indeed be used to determine the entire conformation of polyatomic acetylene (CH) Pullen2014a .
VIII Acknowledgements
We acknowledge support from the Spanish Ministerio De Economia Y Competitividad (MINECO) through “Plan Nacional” (FIS2011-30465-C02-01), the Catalan Agencia de Gestió d’Ajuts Universitaris i de Recerca (AGAUR) with SGR 2014-2016. This research has been supported by Fundació Cellex Barcelona, LASERLAB-EUROPE grant agreement 228334 and COST Action MP1203. B. W. was supported by an AGAUR fellowship (FI-DGR 2013-2015). M.G.P is supported by the ICFONEST+ programme, partially funded by the Marie Curie Co-funding of Regional, National and International Programmes – COFUND (FP7-PEOPLE-2013-COFUND) action of the European Commission, the “Severo Ochoa” Program of the Spanish Ministry of Economy and Competitiveness, and ICFO.
B.W. and M.G.P. contributed equally to this work.
References
- (1) M. Uiberacker, Th. Uphues, M. Schultze, A. J. Verhoef, V. Yakovlev, M. F. Kling, J. Rauschenberger, N. M. Kabachnik, H. Schröder, M. Lezius, K. L. Kompa, H.-G. Muller, M. J. J. Vrakking, S. Hendel, U. Kleineberg, U. Heinzmann, M. Drescher, and F. Krausz, Attosecond Real-time Observation of Electron Tunneling in Atoms, Nature 446, 627 (2007).
- (2) O. Smirnova, Y. Mairesse, S. Patchkovskii, N. Dudovich, D. Villeneuve, P. Corkum, and M. Yu. Ivanov, High Harmonic Interferometry of Multi-electron Dynamics in Molecules, Nature 460, 972 (2009).
- (3) G. Sansone, F. Kelkensberg, J. F. Pérez-Torres, F. Morales, M. F. Kling, W. Siu, O. Ghafur, P. Johnsson, M. Swoboda, E. Benedetti, F. Ferrari, F. Lépine, J. L. Sanz-Vicario, S. Zherebtsov, I. Znakovskaya, A. L’Huillier, M. Yu. Ivanov, M. Nisoli, F. Martín, and M. J. J. Vrakking, Electron Localization following Attosecond Molecular Photoionization, Nature 465, 763 (2010).
- (4) E. Goulielmakis, Z.-H. Loh, A. Wirth, R. Santra, N. Rohringer, V. S. Yakovlev, S. Zherebtsov, T. Pfeifer, A. M. Azzeer, M. F. Kling, S. R. Leone, and F. Krausz, Real-time Observation of Valence Electron Motion, Nature 466, 739 (2010).
- (5) A. H. Zewail, Four-Dimensional Electron Microscopy, Science 328, 187 (2010).
- (6) P. Hockett, C. Z. Bisgaard, O. J. Clarkin, and A. Stolow, Time-resolved Imaging of Purely Valence-electron Dynamics during a Chemical Reaction, Nat. Phys. 7, 612 (2011).
- (7) R. J. D. Miller, Femtosecond Crystallography with Ultrabright Electrons and X-rays: Capturing Chemistry in Action, Science 343, 1108 (2014).
- (8) P. Colosimo, G. Doumy, C. I. Blaga, J. Wheeler, C. Hauri, F. Catoire, J. Tate, R. Chirla, A. M. March, G. G. Paulus, H. G. Muller, P. Agostini, and L. F. DiMauro, Scaling Strong-field Interactions towards the Classical Limit, Nat. Phys. 4, 386 (2008).
- (9) C. I. Blaga, F. Catoire, P. Colosimo, G. G. Paulus, H. G. Muller, P. Agostini, and L. F. DiMauro, Strong-field Photoionization revisited, Nat. Phys. 5, 335 (2009).
- (10) T. Popmintchev, M.-C. Chen, D. Popmintchev, P. Arpin, S. Brown, S. Ališauskas, G. Andriukaitis, T. Balčiunas, O. D. Mücke, A. Pugzlys, A. Baltuška, B. Shim, S. E. Schrauth, A. Gaeta, C. Hernándes-García, L. Plaja, A. Becker, A. Jaron-Becker, M. M. Murnane, and H. C. Kapteyn, Bright Coherent Ultrahigh Harmonics in the keV X-ray Regime from Mid-Infrared Femtosecond Lasers, Science 336, 1287 (2012).
- (11) C. I. Blaga, J. Xu, A. D. DiChiara, E. Sistrunk, K. Zhang, P. Agostini, T. A. Miller, L. F. DiMauro, and C. D. Lin, Imaging Ultrafast Molecular Dynamics with Laser-induced Electron Diffraction, Nature 483, 194 (2012).
- (12) J. Dura, N. Camus, A. Thai, A. Britz, M. Hemmer, M. Baudisch, A. Senftleben, C. D. Schröter, J. Ullrich, R. Moshammer, and J. Biegert, Ionization with Low-frequency Fields in the Tunneling Regime, Sci. Rep. 3, 2675 (2013).
- (13) N. Ishii, K. Kaneshima, K. Kitano, T. Kanai, S. Watanabe, and J. Itatani, Carrier-envelope Phase-dependent High-harmonic Generation in the Water Window Using a Few-cycle Infrared Light Source, Nat. Commun. 5, 3331 (2014).
- (14) S. L. Cousin, F. Silva, S. Teichmann, M. Hemmer, B. Buades, and J. Biegert, High-flux Table-top Soft X-ray Source Driven by Sub-2-cycle, CEP Stable, 1.85-m 1-kHz Pulses for Carbon K-edge Spectroscopy, Opt. Lett. 39, 5383 (2014).
- (15) J. Tate, T. Auguste, H. G. Muller, P. Saliéres, P. Agostini, and L. F. DiMauro, Scaling of Wave-Packet Dynamics in an Intense Midinfrared Field, Phys. Rev. Lett. 98, 013901 (2007).
- (16) M. Frolov, N. Manakov, and A. Starace, Wavelength Scaling of High-Harmonic Yield: Threshold Phenomena and Bound State Symmetry Dependence, Phys. Rev. Lett. 100, 173001 (2008).
- (17) D. Austin, and J. Biegert, Strong-field Approximation for the Wavelength Scaling of High-harmonic Generation, Phys. Rev. A 86, 023813 (2012).
- (18) O. Chalus, P. K. Bates, M. Smolarski, and J. Biegert, Mid-IR Short-pulse OPCPA with Micro-Joule Energy at 100kHz, Opt. Express 17, 3587 (2009).
- (19) P. B. Corkum, Plasma Perspective on Strong-Field Multiphoton Ionization, Phys. Rev. Lett. 71, 1994 (1993).
- (20) L. V. Keldysh, Ionization in the Field of a Strong Electromagnetic Wave, Zh. Eksp. Teor. Fiz. 47, 1945 (1964) [Sov. Phys. JETP 20, 1307 (1965)].
- (21) ISO 20473:2007, Optics and Photonics – Spectral bands, 2010-10-17, International Organization for Standardization, Geneva, Switzerland. https://www.iso.org/obp/ui/#iso:std:iso:20473:ed-1:v1:en
- (22) Note that since the Keldysh parameter only distinguishes between the extremes of MP () and QS () regimes, additional unitless parameters were introduced by Reiss Reiss2008 to more precisely define the interaction conditions. For completeness, the values corresponding to the maximum 3.1 m intensity used in this manuscript are listed here: , , and .
- (23) W. Quan, Z. Lin, M. Wu, H. Kang, H. Liu, X. Liu, J. Chen, J. Liu, X. T. He, S. G. Chen, H. Xiong, L. Guo, H. Xu, Y. Fu, Y. Cheng, and Z. Z. Xu, Classical Aspects in Above-Threshold Ionization with a Midinfrared Strong Laser Field, Phys. Rev. Lett. 103, 093001 (2009).
- (24) F. H. M. Faisal, Ionization Surprise, Nat. Phys. 5, 319 (2009).
- (25) C. Liu and K. Z. Hatsagortsyan, Origin of Unexpected Low Energy Structure in Photoelectron Spectra Induced by Midinfrared Strong Laser Fields, Phys. Rev. Lett. 105, 113003 (2010).
- (26) T.-M. Yan, S. V. Popruzhenko, M. J. J. Vrakking, and D. Bauer, Low-Energy Structures in Strong Field Ionization Revealed by Quantum Orbits, Phys. Rev. Lett. 105, 253002 (2010).
- (27) C. Lemell, K. I. Dimitriou, X.-M. Tong, S. Nagele, D. V. Kartashov, J. Burgdörfer, and S. Gräfe, Low-energy Peak Structure in Strong-field Ionization by Midinfrared Laser Pulses: Two-dimensional Focusing by the Atomic Potential, Phys. Rev. A 85, 011403(R) (2012).
- (28) A. Kästner, U. Saalmann, and J. M. Rost, Electron-Energy Bunching in Laser-Driven Soft Recollisions, Phys. Rev. Lett. 108, 033201 (2012).
- (29) A. Kästner, U. Saalmann, and J. M. Rost, Energy Bunching in Soft Recollisions Revealed with Long-wavelength Few-cycle Pulses, J. Phys. B: At. Mol. Opt. Phys. 45, 074011 (2012).
- (30) C. Lemell, J. Burgdörfer, S. Gräfe, K. I. Dimitriou, D. G. Arbó, and X.-M. Tong, Classical-quantum Correspondence in Atomic Ionization by Midinfrared Pulses: Multiple Peak and Interference Structures, Phys. Rev. A 87, 013421 (2013).
- (31) L. Guo, S. S. Han, X. Liu, Y. Cheng, Z. Z. Xu, J. Fan, J. Chen, S. G. Chen, W. Becker, C. I. Blaga, A. D. DiChiara, E. Sistrunk, P. Agostini, and L. F. DiMauro, Scaling of the Low-Energy Structure in Above-Threshold Ionization in the Tunneling Regime: Theory and Experiment, Phys. Rev. Lett. 110, 013001 (2013).
- (32) Z.-Y. Lin, M-Y. Wu, W. Quan, X.-J. Liu, J. Chen, and Y. Cheng, The Coulomb Effect on a Low-energy Structure in Above-threshold Ionization Spectra Induced by Mid-infrared Laser Pulses, Chin. Phys. B 23, 023201 (2014).
- (33) C. Y. Wu, Y. D. Yang, Y. Q. Liu, Q. H. Gong, M. Y. Wu, X. Liu, X. L. Hao, W. D. Li, X. T. He and J. Chen, Characteristic Spectrum of Very Low-Energy Photoelectron from Above-Threshold Ionization in the Tunneling Regime, Phys. Rev. Lett. 109, 043001 (2012).
- (34) M. G. Pullen, J. Dura, B. Wolter, M. Baudisch, M. Hemmer, N. Camus, A. Senftleben, C. D. Schröter, R. Moshammer, J. Ullrich, and J. Biegert, Kinematically Complete Measurements of Strong Field Ionization with Mid-IR Pulses, J. Phys. B: At. Mol. Opt. Phys. 47, 204010 (2014).
- (35) B. Wolter, C. Lemell, M. Baudisch, M. G. Pullen, X.-M. Tong, M. Hemmer, A. Senftleben, C. D. Schröter, J. Ullrich, R. Moshammer, J. Biegert, and J. Burgdörfer, Formation of Very-low-energy States Crossing the Ionization Threshold of Argon Atoms in Strong Mid-infrared Fields, Phys. Rev. A 90, 063424 (2014).
- (36) C. Figueira de Morisson Faria, and X. Liu, Electron-electron Correlation in Strong Laser Fields, J. Mod. Opt. 58, 1076 (2011).
- (37) M. G. Pullen, B. Wolter, A.-T. Le, M. Baudisch, M. Hemmer, A. Senftleben, C. D. Schröter, J. Ullrich, R. Moshammer, C. D. Lin, and J. Biegert, Imaging an Aligned Polyatomic Molecule with Laser-induced Electron Diffraction, Nat. Commun. 6, 7262 (2015).
- (38) H. R. Reiss, Limits on Tunneling Theories of Strong-Field Ionization, Phys. Rev. Lett. 101, 043002 (2008).
- (39) A. S. Alnaser, D. Comtois, A. T. Hasan, D. M. Villeneuve, J.-C. Kieffer, and I. V. Litvinyuk, Strong-field Non-sequential Double Ionization: Wavelength Dependence of Ion Momentum Distributions for Neon and Argon, J. Phys. B: At. Mol. Opt. Phys. 41, 031001 (2008).
- (40) S. Popruzhenko, V. Mur, V. Popov, and D. Bauer, Strong Field Ionization Rate for Arbitrary Laser Frequencies, Phys. Rev. Lett. 101, 193003 (2008).
- (41) D. Dimitrovski, J. Maurer, H. Stapelfeldt, and L. B. Madsen, Low-Energy Photoelectrons in Strong-Field Ionization by Laser Pulses with Large Ellipticity, Phys. Rev. Lett. 113, 103005 (2014).
- (42) It should be noted that these ionization fractions are calculated for atomic targets Popruzhenko2008 and should be compared with their molecular counterparts in an indicative manner only. The point is not to accurately calculate molecular ionization fractions but to illustrate that long wavelength sources are needed to probe polyatomic molecules within the QS regime.
- (43) A. D. DiChiara, E. Sistrunk, C. I. Blaga, U. B. Szafruga, P. Agostini, and L. F. DiMauro, Inelastic Scattering of Broadband Electron Wave Packets Driven by an Intense Midinfrared Laser Field, Phys. Rev. Lett. 108, 033002 (2012).
- (44) H. R. Reiss, Theoretical Methods in Quantum Optics: S-matrix and Keldysh Techniques for Strong-field Processes, Prog. Quant. Electr. 16, 1 (1992).
- (45) H. R. Reiss, The Tunnelling Model of Laser-induced Ionization and its Failure at Low Frequencies, J. Phys. B: At. Mol. Opt. Phys. 47, 204006 (2014).
- (46) A. Ludwig, J. Maurer, B. Mayer, C. R. Phillips, L. Gallmann, and U. Keller, Breakdown of Dipole Approximation in Strong Field Ionization, Phys. Rev. Lett. 113, 243001 (2014).
- (47) W. Xiong, F. Yergeau, S. L. Chin, and P. Lavigne, Multiphoton Ionization of Rare Gases by a CO2 Laser: Electron Spectroscopy, J. Phys. B: At. Mol. Opt. Phys. 21, L159 (1988).
- (48) R. Moshammer, J. Ullrich, M. Unverzagt, W. Schmidt, P. Jardin, R. E. Olson, R. Mann, R. D rner, V. Mergel, U. Buck, and H. Schmidt-B cking, Low-energy Electrons and Their Dynamical Correlation with Recoil Ions for Single Ionization of Helium by Fast, Heavy-ion Impact, Phys. Rev. Lett. 75, 2631 (1994).
- (49) L. J. Frasinski, K. Codling, and P. A. Hatherly, Covariance Mapping: A Correlation Method Applied to Multiphoton Multiple Ionization, Science 246, 1029 (1989).
- (50) W. M. Haynes, CRC Handbook of Chemistry and Physics, 95th Edition, Taylor & Francis, ISBN 1-4822-0867-9 (2014).
- (51) The 129Xe2+ peak is composed of two peaks due to the NSDI mechanism (polarization along the static electric field of the ReMi) causing one recoil-ion to go straight towards the detector and the other to initially go away from the detector.
- (52) A. T. J. B. Eppink and D. H. Parker, Velocity Map Imaging of Ions and Electrons using Electrostatic Lenses : Application in Photoelectron and Photofragment Ion Imaging of Molecular Oxygen, Rev. Sci. Instrum. 68, 3477 (1997).
- (53) M. Takahashi, J. P. Cave, and J. H. D. Eland, Velocity Imaging Photoionization Coincidence Apparatus for the Study of Angular Correlations between Electrons and Fragment Ions, Rev. Sci. Instrum. 71, 1337 (2000).
- (54) J. Laksman, D. Céolin, E. P. Månsson, S. L. Sorensen, and M. Gisselbrecht, Development and Characterization of a Multiple-coincidence Ion-momentum Imaging Spectrometer, Rev. Sci. Instrum. 84, 123113 (2013).
- (55) O. Ghafur, W. Siu, P. Johnsson, M. F. Kling, M. Drescher, and M. J. J. Vrakking, A Velocity Map Imaging Detector with an Integrated Gas Injection System, Rev. Sci. Instrum. 80, 033110 (2009).
- (56) C. R. Gebhardt, T. P. Rakitzis, P. C. Samartzis, V. Ladopoulos, and T. N. Kitsopoulos, Slice Imaging: A New Approach to Ion Imaging and Velocity Mapping, Rev. Sci. Instrum. 72, 3848 (2001).
- (57) B. J. Whitaker, in Imaging in Chemical Dynamics, American Chemical Society, Washington, D.C. (2000), p. 68.
- (58) M. J. J. Vrakking, An Iterative Procedure for the Inversion of Two-dimensional Ion/Photoelectron Imaging Experiments, Rev. Sci. Instrum. 72, 4084 (2001).
- (59) V. Dribinski, A. Ossadtchi, V. A. Mandelshtam, and H. Reisler, Reconstruction of Abel-transformable Images: The Gaussian Basis-set Expansion Abel Transform Method, Rev. Sci. Instrum. 73, 2634 (2002).
- (60) D. Rolles, Z. D. Pešić, M. Perri, R. C. Bilodeau, G. D. Ackerman, B. S. Rude, A. L. D. Kilcoyne, J. D. Bozek, and N. Berrah, A Velocity Map Imaging Spectrometer for Electron-ion and Ion-ion Coincidence Experiments with Synchrotron Radiation, Nucl. Instrum. Meth. Phys. Res. B 261, 170 (2007).
- (61) R. Moshammer, M. Unverzagt, W. Schmitt, J. Ullrich, and H. Schmidt-Böcking, A 4 Recoil-ion Electron Momentum Analyzer: a High-resolution ”Microscope” for the Investigation of the Dynamics of Atomic, Molecular and Nuclear Reactions, Nucl. Instrum. Meth. Phys. Res. B 108, 425 (1996).
- (62) R. Dörner, V. Mergel, O. Jagutzki, J. Ullrich, R. Moshammer, and H. Schmidt-Böcking, Cold Target Recoil Ion Momentum Spectroscopy: A ’Momentum Microscope’ to View Atomic Collision Dynamics, Phys. Rep. 330, 95 (2000).
- (63) J. Ullrich, R. Moshammer, A. Dorn, R. Dörner, L. Ph. H. Schmidt, and H. Schmidt-Böcking, Recoil-ion and Electron Momentum Spectroscopy : Reaction-microscopes, Rep. Prog. Phys. 66, 1436 (2003).
- (64) A. Thai, M. Hemmer, P. K. Bates, O. Chalus, and J. Biegert, Sub-250-mrad, Passively Carrier-envelope-phase-stable Mid-infrared OPCPA Source at High Repetition Rate, Opt. Lett. 36, 3918 (2011).
- (65) M. Hemmer, A. Thai, M. Baudisch, H. Ishizuki, T. Taira, and J. Biegert, 18-J Energy, 160-kHz Repetition Rate, 250-MW Peak Power Mid-IR OPCPA, Chin. Opt. Lett. 11, 013202 (2013).
- (66) M. Hemmer, M. Baudisch, A. Thai, A. Couairon, and J. Biegert, Self-compression to Sub-3-cycle Duration of Mid-infrared Optical Pulses in Dielectrics, Opt. Expr. 21, 28095 (2013).
- (67) J. B. Watson, A. Sanpera, K. Burnett, and P. L. Knight, Wave-packet Recollision and Pulse-shape Effects in High-harmonic Generation, Phys. Rev. A 55, 1224 (1997).
- (68) O. Chalus, P. K. Bates, and J. Biegert, Design and Simulation of Few-cycle Optical Parametric Chirped Pulse Amplification at Mid-IR Wavelengths, Opt. Express 16, 21297 (2008).
- (69) F. J. Furch, S. Birkner, F. Kelkensberg, A. Giree, A. Anderson, C. P. Schulz, and M. J. J. Vrakking, Carrier-envelope Phase Stable Few-cycle Pulses at 400 kHz for Electron-ion Coincidence Experiments, Opt. Expr. 21, 22671 (2013).
- (70) J. Matyschok, T. Lang, T. Binhammer, O. Prochnow, S. Rausch, M. Schultze, A. Harth, P. Rudawski, C. L. Arnold, A. L’Huillier, and U. Morgner, Temporal and Spatial Effects inside a Compact and CEP Stabilized, Few-cycle OPCPA System at High Repetition Rates, Opt. Express 21, 29656 (2013).
- (71) I. Pupeza, T. Eidam, J. Rauschenberger, B. Bernhardt, A. Ozawa, E. Fill, A. Apolonski, T. Udem, J. Limpert, Z. A. Alahmed, A. M. Azzeer, A. T nnermann, T. W. H nsch, and F. Krausz, Power Scaling of a High-repetition-rate Enhancement Cavity, Opt. Lett. 35, 2052 (2010).
- (72) W. Becker, S. P. Goreslavski, D. B. Milošević, and G. G. Paulus, Low-energy Electron Rescattering in Laser-induced Ionization, J. Phys. B: At. Mol. Opt. Phys. 47, 204022 (2014).
- (73) T. Nubbemeyer, K. Gorling, A. Saenz, U. Eichmann, and W. Sandner, Strong-Field Tunneling without Ionization, Phys. Rev. Lett. 101, 233001 (2008).
- (74) A. Landsman, A. n. Pfeiffer, C. Hofmann, M. Smolarski, C. Cirelli, and U. Keller, Rydberg State Creation by Tunnel Ionization, New J. Phys. 15, 013001 (2013).
- (75) R. Kopold, W. Becker, H. Rottke, and W. Sandner, Routes to Nonsequential Double Ionization, Phys. Rev. Lett. 85, 3781 (2000).
- (76) B. Feuerstein, R. Moshammer, D. Fischer, A. Dorn, C. D. Schröter, J. Deipenwisch, J. R. Crespo Lopez-Urrutia, C. H hr, P. Neumayer, J. Ullrich, H. Rottke, M. Wittmann, G. Korn, and W. Sandner, Separation of Recollision Mechanisms in Nonsequential Strong Field Double Ionization of Ar: The Role of Excitation Tunneling, Phys. Rev. Lett. 87, 043003 (2001).
- (77) R. Moshammer, B. Feuerstein, W. Schmitt, A. Dorn, C. D. Schr ter, J. Ullrich, H. Rottke, C. Trump, M. Wittmann, G. Korn, K. Hoffmann, and W. Sandner, Momentum Distributions of Ne Ions Created by an Intense Ultrashort Laser Pulse, Phys. Rev. Lett. 84, 447 (2000).
- (78) T. Shaaran, M. T. Nygren, and C. Figueira de Morisson Faria, Laser-induced Nonsequential Double Ionization at and above the Recollision-excitation-tunneling Threshold, Phys. Rev. A 81, 063413 (2010).
- (79) T. Weber, H. Giessen, M. Weckenbrock, G. Urbasch, A. Staudte, L. Spielberger, O. Jagutzki, V. Mergel, M. Vollmer, and R. Dörner, Correlated Electron Emission in Multiphoton Double Ionization, Nature 405, 658 (2000).
- (80) B. Bergues, M. K bel, N. G. Johnson, B. Fischer, N. Camus, K. J. Betsch, O. Herrwerth, A. Senftleben, A. M. Sayler, T. Rathje, T. Pfeifer, I. Ben-Itzhak, R. R. Jones, G. G. Paulus, F. Krausz, R. Moshammer, J. Ullrich, and M. F. Kling, Attosecond Tracing of Correlated Electron-emission in Non-sequential Double Ionization., Nat. Commun. 3, 813 (2012).
- (81) Q. Tang, Y. Zhou, C. Huang, Q. Liao, and. P. Lu, Correlated Electron Dynamics in Nonsequential Double Ionization of Molecules by Mid-infrared Fields, Opt. Expr. 20, 19580 (2013).
- (82) D.-L. Zhang, Q.-B. Tang, and Y. Gao, Suppression of Recollision-Excitation Ionization in Nonsequential Double Ionization of Molecules by Mid-Infrared Laser Pulses, Chin. Phys. Lett. 30, 023203 (2013).
- (83) Q.Tang, D. Zhang, M. Liu, Y. Gao, and B. Yu, Intensity-dependent Transitions between Different Pathways of Strong-field Double Ionization, Opt. Commun. 307, 32 (2013).
- (84) T. Zuo, A. D. Bandrauk, and P. B. Corkum, Laser-induced Electron Diffraction : New Tool for Probing Ultrafast Molecular Dynamics, Chem. Phys. Lett. 259, 313 (1996).
- (85) M. Spanner, O. Smirnova, P. B. Corkum, and M. Y. Ivanov, Reading Diffraction Images in Strong Field Ionization of Diatomic Molecules, J. Phys. B: At. Mol. Opt. Phys. 37, L243 (2004).
- (86) S. N. Yurchenko, S. Patchkovskii, I. V. Litvinyuk, P. B. Corkum, and G. L. Yudin, Laser-induced Interference, Focusing, and Diffraction of Rescattering Molecular Photoelectrons, Phys. Rev. Lett. 93, 223003 (2004).
- (87) D. Ray, B. Ulrich, I. Bocharova, C. Maharjan, P. Ranitovic, B. Gramkow, M. Magrakvelidze, S. De, I. Litvinyuk, A. T. Le, T. Morishita, C. D. Lin, G. G. Paulus, and C. L. Cocke, Large-Angle Electron Diffraction Structure in Laser-Induced Rescattering from Rare Gases, Phys. Rev. Lett. 100, 143002 (2008).
- (88) M. Okunishi, T. Morishita, G. Pr mper, K. Shimada, C. D. Lin, S. Watanabe, and K. Ueda, Experimental Retrieval of Target Structure Information from Laser-induced Rescattered Photoelectron Momentum Distributions, Phys. Rev. Lett. 100, 143001 (2008).
- (89) M. Okunishi, H. Niikura, R. R. Lucchese, T. Morishita, and K. Ueda, Extracting Electron-Ion Differential Scattering Cross Sections for Partially Aligned Molecules by Laser-Induced Rescattering Photoelectron Spectroscopy, Phys. Rev. Lett. 106, 063001 (2011).
- (90) J. Xu, C. I. Blaga, A. D. DiChiara, E. Sistrunk, K. Zhang, Z. Chen, A.-T. Le, T. Morishita, C. D. Lin, P. Agostini, and L. F. Dimauro, Laser-Induced Electron Diffraction for Probing Rare Gas Atoms, Phys. Rev. Lett. 109, 233002 (2012).
- (91) M. Okunishi, R. R. Lucchese, T. Morishita, and K. Ueda, Rescattering Photoelectron Spectroscopy of Small Molecules, J. Electron Spectrosc. Relat. Phenom. 195, 313 (2008).
- (92) Z. Chen, A.-T. Le, T. Morishita, and C. D. Lin, Quantitative Rescattering Theory for Laser-induced High-energy Plateau Photoelectron Spectra, Phys. Rev. A 79, 033409 (2009).
- (93) C. D. Lin, A.-T. Le, Z. Chen, T. Morishita, and R. Lucchese, Strong-field Rescattering Physics: Self-imaging of a Molecule by its Own Electrons, J. Phys. B: At. Mol. Opt. Phys. 43, 122001 (2010).
- (94) J. Xu, Z. Chen, A.-T. Le, and C. D. Lin, Self-imaging of Molecules from Diffraction Spectra by Laser-induced Rescattering Electrons, Phys. Rev. A 82, 033403 (2010).
- (95) A. Jablonski, F. Salvat, and C. J. Powell, NIST Electron Elastic-Scattering Cross-Section Database, Version 3.2, SRD 64, National Institute of Standards and Technology, Gaithersburg, MD (2010).