Formation of As-As Bond and Its Effect on Absence of Superconductivity in Collapsed Tetragonal Phase of Ca0.86Pr0.14Fe2As2 : An Optical Spectroscopy Study
Abstract
The temperature dependence of in-plane optical conductivity has been investigated for Ca0.86Pr0.14Fe2As2 which shows a structural transition from tetragonal (T) to collapsed tetragonal (cT) phase at 73 K. Upon entering the cT phase, drastic change characterized by the formation of a mid-infrared peak near 3200(0.4 eV) in the optical conductivity is observed. Analysis of the spectral weight reveals reduced electron correlation after the cT phase transition. Based on the calculated band structure and simulated optical conductivity, we attribute the new feature around 0.4 eV to the formation of interlayer As-As bond. The As-As bond strongly affects the Fe-As hybridizations, and in turn, drastically changes the Ca0.86Pr0.14Fe2As2 into a nonmagnetic Fermi liquid system without bulk superconductivity in the cT phase.
pacs:
72.15.-v, 74.70.-b, 78.30.-jElectron correlation and magnetism are widely believed to be intimately related to the pairing mechanism of unconventional high-temperature superconductor Lee et al. (2006). The iron-pnictides are newly discovered superconductors with as high as 55 K Johnston (2010). Similar to the cuprates, superconductivity in iron-pnictides appears in the vicinity of an antiferromagnetic (AFM) phase by doping or pressure. However, the parent compounds of iron-pnictides are bad metals with moderate correlation, and the local magnetic moment in iron-pnictides is much larger than that in the cuprates. The strong magnetism and moderate correlation provide us an alternative material to investigate the interplay among electron correlation, magnetism and superconductivity Paglione and Greene (2010).
Up to now, there is growing evidence that the covalent Fe-As bond plays an important role in the appearance of superconductivity in iron-pnictides Belashchenko and Antropov (2008). It not only transports the carriers to tune the correlation Diehl et al. (2014) but also delivers the antiferromagnetic superexchange interactions to form the collinear antiferromagntic order and induces spin fluctuation Ma et al. (2008). In addition, first-principle calculations point out that the Fe local moment is strongly sensitive to the Fe-As distance which is influenced by the covalent Fe-As bonding Mirbt et al. (2003). Therefore, the Fe-As bonding is one of the key elements for understanding the correlation, magnetism as well as superconductivity in iron-pnictides.
Among the Fe-As based superconductors, CaFe2As2 is an excellent prototype material to explore the nature of superconducting mechanism due to its strong Fe-As bonding and large structural instability Saparov et al. (2014); Tompsett and Lonzarich (2009); Gretarsson et al. (2013). At ambient pressure, it crystallizes in the tetragonal structure at room temperature and manifests a strongly first-order, concomitant structural-magnetic phase transition to an orthorhombic phase with the stripe-like antiferromagnetic order at 170 K Canfield et al. (2009). Charge doping and hydrostatic pressure can suppress the AFM order and induce superconductivity in it Torikachvili et al. (2008). However, when the pressure exceeds GPa, CaFe2As2 undergoes a remarkable structure transition from the orthorhombic phase directly into the so-called collapsed tetragonal phase Yu et al. (2009), which can also be stabilized at ambient pressure by introducing chemical pressure Saha et al. (2012) or post-annealing treatment Saparov et al. (2014). This transition is characterized by the formation of interlayer As-As bond and a shrinkage of the axis by approximately 10% without breaking any symmetries Saha et al. (2012). In contrast to the tetragonal phase at high temperatures, neutron scattering and nuclear magnetic resonance demonstrated that the local Fe moment Ma et al. (2013) and the spin fluctuation are quenched in the cT phaseSoh et al. (2013). Recent transport measurements further revealed that following the lattice-collapse transition, Fermi-liquid behavior abruptly recovers along with the disappearance of bulk superconductivity Kasahara et al. (2011); Yu et al. (2009). Very recently, first-principle calculations also show that the hybridizations between Fe orbitals and As orbitals were also greatly affected by the new formed As-As bond across the phase transition Yildirim (2009); Diehl et al. (2014). There results suggest that the vanishing of correlation effect and magnetism may be strongly connected to the formation of the As-As bond between adjoint layers.
In this work, we carried out transport, optical spectral measurements in Pr doped CaFe2As2 system. The single crystal Ca0.86Pr0.14Fe2As2 undergoes a first order transition to the cT phase at 73 K. A drastic spectral change across the phase transition due to a band reconstruction is observed by the optical spectroscopy measurement Wang et al. (2014). The spectral weight analysis reveals a reduced correlation and a newly formed mid-infrared peak at 0.4 eV in the cT phase. Comparing with the theoretical results from first-principle calculations, we find that this mid-infrared peak is associated with the formation of interlayer As-As bond, which strongly affects the Fe-As hybridizations and changes the material to a nonmagnetic Fermi-liquid system without bulk superconductivity.
High quality single crystals Ca1-xPrxFe2As2with nominal concentration of 0.14 were synthesized by the FeAs self-flux method and the typical size was about 10100.1 mm3 Ronning et al. (2008). The composition determined by Inductive Coupled Plasma Emission Spectrometer (ICP) was about . The lattice structural was detected by X-ray diffraction (XRD) (Bruker D8 Advance instrument) using Cu K (= 0.154 nm) radiation at various temperatures upon warming. Resistivity measurement was carried out on Quantum Design Physical Property Measurement System (PPMS). Magnetization was measured using a Quantum Design superconducting quantum interference device (SQUID). The reflectivity from the cleaved surface has been measured at a near-normal angle of incidence on a Fourier transform infrared spectrommeter (Bruker 80v) for light polarized in the planes using an evaporation technique. Homes et al. (1993) Data from 40 to 15 000 were collected at 8 different temperatures from 15 K to 300 K on an ARS-Helitran cryostat. The reflectivity in the visible and UV range (10 000-40 000 ) at room temperature was taken with an Avaspec 204814 optical fiber spectrometer. The optical conductivity has been determined from a Kramers-Kronig analysis of reflectivity over the entire frequency range. A Hagen-Rubens relation () is used for low-frequency extrapolation. Above the highest-measured frequency (40 000 ), is assumed to be constant up to 40 eV, above which a free-electron response () is used Dai et al. (2014).
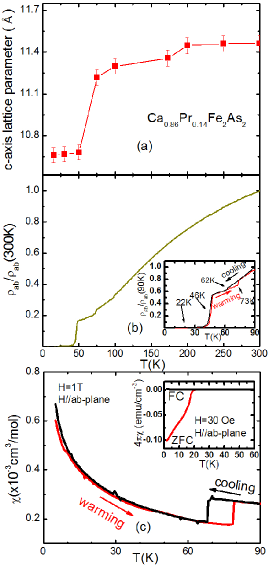
In Fig. 1(a) we calculated the c-axis parameter of Ca0.86Pr0.14Fe2As2 from the XRD data, a great shrinkage happened below 75 K indicates the lattice collapse transition Saha et al. (2012). Correspondingly, a sudden drop is observed near 73 K in its in-plane resistivity (show in the main panel of Fig. 1(b)). The thermal hysteretic loop in the inset of Fig. 1(b) indicates the first order nature of this transition. From the dc magnetic susceptibility (shown in Fig. 1(c)), a kink combined with a thermal hysteresis can also be found near 73 K. Even though obvious drops at 46 K and zero-resistance behavior at 21 K are observed in the resistance curve Lv et al. (2011), the shielding volume fraction estimated from the field-cooling curve and zero-field-cooling curve in the inset of Fig. 1(c) is about 10%, which is much smaller than that expected for a bulk superconductor Saha et al. (2012). Furthermore, the superconductivity is easily to be suppressed by a magnetic field of 1 T, suggesting its interfacial or filamentary nature Gofryk et al. (2014).
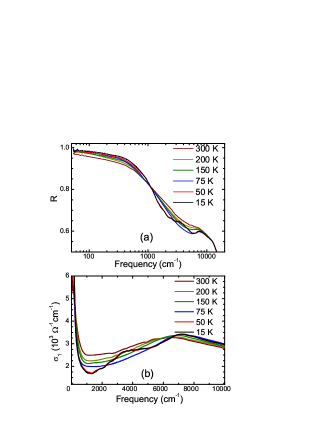
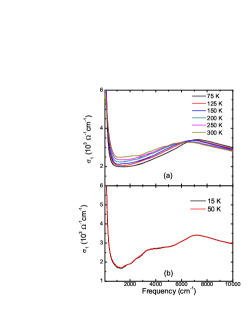
The measured in-plane reflectivity and the real part of the in-plane optical conductivity are presented in Fig. 2, respectively, for selected temperatures above and below . The reflectivity shows a typical metallic response, approaching unity at low frequencies () and increasing upon cooling. Upon entering the cT phase, the in the mid-infrared range (1 000-3 000 ) is greatly suppressed. As a consequence, the reflectivity edges at about 1 000 become sharper, suggesting a suppression of the carrier scattering. As suggested by Basov et al. and Pratt et al. Basov and Timusk (2005); Pratt et al. (2009), the scattering could be caused by spin fluctuation, shaper reflectivity edges also indicate diminishing spin fluctuation in the cT phase. The drastic change could also be seen from the optical conductivity data in Fig. 2(b), below , an abrupt decrease in the conductivity between 1 000 and 2 500 and a peak at 3 500 (0.4 eV) are observed (see Appendix A for more detail). Similar behaviors have also been observed in and data of P-doped CaFe2As2 , which have been attributed to an abrupt band reconstruction across the cT transition Wang et al. (2014).
To quantitatively analyze the optical data of Ca0.86Pr0.14Fe2As2, we fit the with a simple Drude-Lorentz mode Wu et al. (2008); Dai et al. (2014):
| (1) |
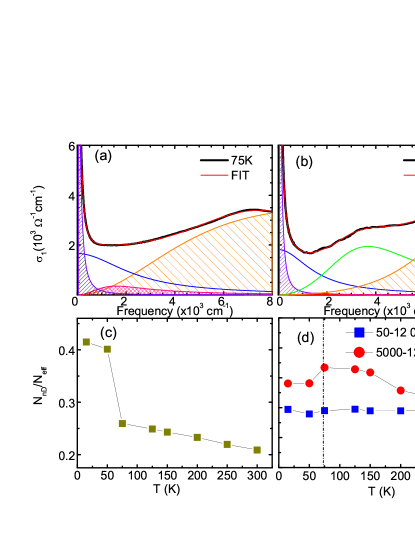
where is the real part of the dielectric function at high frequencies, the second term corresponds to the Drude response characterized by a plasma frequency , with a carrier concentration and an effective mass, and the scattering rate. The third term is a sum of Lorentz oscillators characterized by a resonance frequency , a linewidth , and an oscillator strength . The Drude term accounts for the free carrier (intraband) response, while the Lorentz contributions represent the interband excitations Marsik et al. (2013); Calderón et al. (2014). The fitting results shown in Fig. 3(a)(b) can well reproduce the experimental results regardless of the detail band structure.
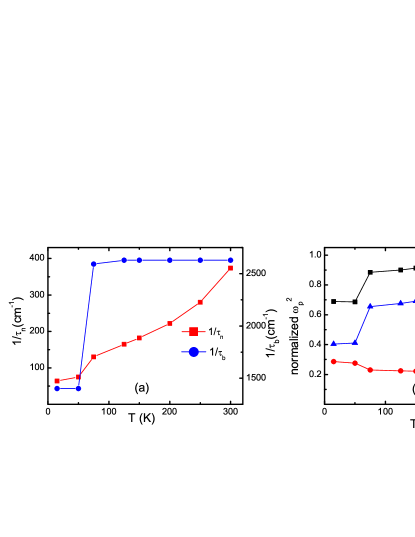
From the fitting results (Fig. 3(a)(b) see more results in the supplementary material), we find that the optical conductivity at low frequency () is dominated by two Drude (intraband) responses, a broad one and a narrow one, reflecting the multi-orbital nature of the iron pnictides (see Appendix B for a detail fitting results). The narrow Drude item represents the response of the coherent carriers, corresponding to the electron pockets. The other Drude component with an extremely broad width of 2 300 or more is originated from a highly incoherent scattering and is dominated by the hole pockets at the center of Brillouin zone. Wu et al. (2008); Dai et al. (2014) It has been pointed out that the fraction of coherent Drude weight ( in which , , denote the free electron mass, the cell volume and the narrow Drude component, respectively.) at low frequency represents the degree of coherence. Here we define as the sum of the weight of the narrow and broad Drude components in order to estimate the low-energy intraband response Nakajima et al. (2014). Since the electronic correlation has been regarded as a source of incoherence in iron arsenides, could also be a measure of the strength of electronic correlations Nakajima et al. (2014). The data of in Fig. 3(c) shows an abrupt enhancement of the degree of coherence across the T to cT phase transition, suggesting a weakening of electronic correlation.
Then we focus on the optical conductivity at high frequencies (above 5 000). It has been reported that in iron-pnictides the spectral weight at low frequency would transfer to high energy area ( eV) as temperature goes down. This behavior is widely attibuted to the Hund’s rule coupling effect Wang et al. (2012); Schafgans et al. (2012), which can localize and polarize the itinerant electrons to enhance the correlation and local moment. To investigate the anomalous spectral weight transfer, we have calculated and normalized the spectral weight between different lower and upper cutoff frequencies. From the results shown in Fig. 3(d), it can be found that the overall spectral weight between 50and 12 000is temperature-independent 111Since the high energy( 12 000) optical spectral we observed does not vary with the temperatue, we do not take the spectral weight in this area into consideration. while the spectral weight at high frequency () varies significantly with the temperature, suggesting that there indeed exists obvious Hund’s rule coupling effect. Above , more low-frequency spectral weight transfers to high energy area ( 5 000) with decreasing temperature, but after the phase transition, this tendency is suppressed. The spectral weight above 5 000starts to decline, indicating the weakening of the Hund’s coupling effect, which can lead to weaker correlation and smaller Fe local moment Mandal et al. (2014).
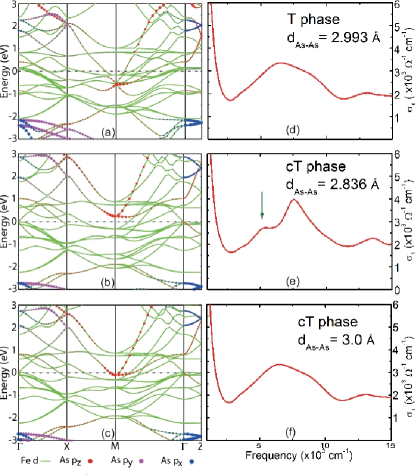
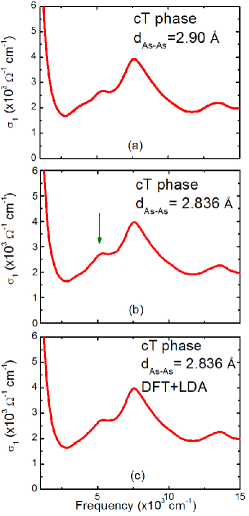
A remarkable feature we observed in the optical spectra is the newly formed mid-infrared peak around 0.4 eV after the phase transition. By comparing the optical spectral of CaCu2As2 which has an intrinsic As-As interlayer bond Cheng et al. (2012), we suppose that this new feature may be associated with the formation of As-As bond in the cT phase. To confirm this hypothesis, we have calculated the band structure and simulated the optical conductivity in different situations. The calculations are performed using density functional theory (DFT) as implemented in the Vienna simulation package (VASP) code Kresse and Furthmüller (1996); Kresse and Hafner (1993); Kresse and Furthmüller (1996). Generalized-gradient approximation (GGA) for the exchange correlation functional are used Perdew et al. (1996).Throughout the work, the cutoff energy is set to be 400 eV for expanding the wave functions into plane-wave basis and the number of these k points are 16 16 8. Furthermore, the experimental parameters Diehl et al. (2014)(=3.8915 Å, =11.690 Å; =3.9792 Å,=10.6073 Å) were used in the calculation. The results are shown in Fig. 4, the simulated optical conductivities agree well with the observed ones in both the T and cT phase qualitatively (more detail results could be seen in Appendix C). Then we enlarge the interlayer distance without changing the intralayer structure in the cT phase. When the distance exceeds 3.0 Å, the antibonding state sinks below the Fermi level (Fig. 4(c)), corresponding to the destroyed As-As bond. Simultaneously, the mid-infrared peak (as illustrated in Fig. 4(e) by the green arrow) in the simulated optical conductivity disappears (Fig. 4(f)). This provides strong evidence that the mid-infrared peak around 0.4eV is associated with the interlayer As-As bond. From the optical conductivities (Fig. 2(b)) and their fitting results (Fig. 3(a)(b)), we find that, the newly formed 0.4 eV peak seems to absorb the spectral weight of the broad Drude item at low frequency and frustrate the spectral weight transfer from low to high frequency area. Hence, we infer that the As-As bond may relate to the weaker correlation, quenched magnetism as well as the disappeared bulk superconductivity in the cT phase.
According to the calculated band structure (Fig. 4(a-c)), the bonding-antibonding splitting of As / orbitals around the point is found to be enlarged after the cT phase transition, suggesting increased overlap between Fe orbitals and As / orbitals Belashchenko and Antropov (2008) due to shorter Fe-As covalent bond induced by the formation of As-As bond Saha et al. (2012). The enhanced overlap will make the electrons, especially those in orbitals, more itinerant and greatly weakens the correlation Diehl et al. (2014); Yin et al. (2011). Since the Fe spin polarization is driven by the on-site (Hund) exchange Belashchenko and Antropov (2008), the more itinerant electrons are hardly to form the local moment. Thus, the shorter Fe-As bond ( 2.36 Å Saha et al. (2012)) is responsible for the weaker correlation and quenched local moment Mirbt et al. (2003). On the other hand, around the M point, the As orbitals, which locate under the Fermi level and hybridize well with the Fe orbitals in the T phase (Fig. 4(a)), have been pushed above the Fermi level and decoupled with the Fe orbitals after the cT phase transition (Fig. 4(b)). Previous research pointed out that the As-As bond perpendicular to the Fe layer was dominated by the As orbitals Hoffmann and Zheng (1985), thus the empty antibonding states of As orbitals in Fig. 4(b) correspond to the formation of As-As bond in the cT phase. Since the hybridizations between the As orbitals and the Fe orbitals delivers the antiferromagnetic superexchange interaction between the nearest and next nearest Fe atoms to form the AFM order and to induce the spin fluctuation Ma et al. (2008), the decoupling effect caused by the newly formed interlayer As-As bond greatly frustrates the antiferromagnetic interaction and, in turn, eliminate the AFM order and spin fluctuation in the cT phase. In addition, the bulk superconductivity disappearing with the spin fluctuation supports the notion of a coupling between spin fluctuations and unconventional superconductivity in the iron pnictides Paglione and Greene (2010); Soh et al. (2013). Accordingly, the newly formed As-As hybridization plays a decisive role on suppressing the correlation, magnetism and superconductivity in the cT phase by affecting the Fe-As hybridiztion.
In summary, we report detailed transport and optical study results on Ca0.86Pr0.14Fe2As2 single crystal, which undergoes structural phase transition from tetragonal to collapsed tetragonal phase. After the cT phase transition, the sharper reflectance edge and great spectral weight redistribution in the optical conductivity reflect suppressed spin fluctuation and weaker electron correlation. Based on the fist-principle calculation, we confirm that the newly formed feature around 0.4 eV is caused by the interlayer As-As bonding. The formation of As-As bond in the cT phase weakens the correlation, quenches the local moment and frustrates the dynamical spin fluctuation by affecting the Fe-As hybridization. Since the superconductivity in iron pnictides is widely believed to be mediated by the spin fluctuation, the degree of hybridization between iron and arsenic atoms can provide a possible explanation on the lack of bulk superconductivity in the cT phase.
Acknowledgements.
The authors thank Pengcheng Dai, Yaomin Dai, Bohong Li and Fei Cheng for useful discussion, and we thank Yuping Sun, Minghu Fang, Hangdong Wang for assistance with X-ray diffraction measurements. This work was supported by the NSFC (Grants No. 91121004 and 973 Projects No. 2015CB921303) and the MOST (973 Projects No. 2012CB21403, No. 2011CBA00107, No. 2012CB921302, and No. 2015CB929103).Appendix A OPTICAL CONDUCTIVITY BEFORE AND AFTER THE LATTICE COLLAPSE TRANSITION
In Fig. 5 we present all the measured optical conductivity in two pictures, one with all measured temperature above 75 K and one below 75 K. The optical conductivity of Ca0.86Pr0.14Fe2As2 in the normal state ( 75 K) shows typical feature of 122 iron-pnictides. The peak-like structural around 6 000 has been regarded as a high-energy pseudogap which relates to Hund’s rule coupling effect. From 300 K to 75 K this peak shift from 6 000 to 7 000 . This peak shifting is common in Ba122 and Sr122 systems Wang et al. (2012), but the range is wider in our sample. The reason for such big shifting range is still unknown, we think that this anomalous shifting may be related to the structural instability and the spin state transition in rare-earth doped CaFe2As2 Gretarsson et al. (2013) and needs further investigation.
Appendix B THE DETAIL FITTING RESULTS
To quantitatively analysis the optical data we fitted the optical conductivity with generally used two-Drude model, the results are shown in Fig. 6. The subscript n and b stand for the narrow and broad Drude terms, respectively. From the results, we find out that, upon entering the cT phase, the plasma frequency and the scattering rate of broad Drude term shows abrupt decrease, suggesting remarkable shrinkage of broad Drude as well as the hole pockets which are caused by the formation of As-As bond.
Appendix C MORE CALCULATED RESULTS
To demonstrated whether the interlayer distance could greatly affect the position of new formed mid-infrared peak in the cT phase. We calculate the optical conductivity with the interlayer distance of 2.90 Å, the results are shown in Fig. 7. By comparing the results of 2.83 Å, we do not observe obvious shifting of the new-formed mid-infrared structure. We infer that the difference may not be caused by the different interlayer distance. Very recently, S. Mandal et al. has calculated the optical conductivity in the cT phase base on DFT+DMFT Mandal et al. (2014). The calculated data precisely reproduced the experimental one. The discrepancy of our data may come from the strong correlation, which is underestimated in our calculation. However, the correlation does not affect the formation of As-As bond in the cT phase, our calculation can qualitatively reflect the nature of the sample in the cT phase.
References
- Lee et al. (2006) P. A. Lee, N. Nagaosa, and X.-G. Wen, Rev. Mod. Phys. 78, 17 (2006).
- Johnston (2010) D. C. Johnston, Advances in Physics 59, 803 (2010).
- Paglione and Greene (2010) J. Paglione and R. L. Greene, Nat. Phys. 6, 645 (2010).
- Belashchenko and Antropov (2008) K. D. Belashchenko and V. P. Antropov, Phys. Rev. B 78, 212505 (2008).
- Diehl et al. (2014) J. Diehl, S. Backes, D. Guterding, H. O. Jeschke, and R. Valentí, Phys. Rev. B 90, 085110 (2014).
- Ma et al. (2008) F. Ma, Z.-Y. Lu, and T. Xiang, Phys. Rev. B 78, 224517 (2008).
- Mirbt et al. (2003) S. Mirbt, B. Sanyal, C. Isheden, and B. Johansson, Phys. Rev. B 67, 155421 (2003).
- Saparov et al. (2014) B. Saparov, C. Cantoni, M. Pan, T. C. Hogan, W. Ratcliff, S. D. Wilson, K. Fritsch, B. D. Gaulin, and A. S. Sefat, Sci. rep. 4, 4120 (2014).
- Tompsett and Lonzarich (2009) D. A. Tompsett and G. G. Lonzarich, arXiv:0902.4859 (2009).
- Gretarsson et al. (2013) H. Gretarsson, S. R. Saha, T. Drye, J. Paglione, J. Kim, D. Casa, T. Gog, W. Wu, S. R. Julian, and Y.-J. Kim, Phys. Rev. Lett. 110, 047003 (2013).
- Canfield et al. (2009) P. Canfield, S. Bud ko, N. Ni, A. Kreyssig, A. Goldman, R. McQueeney, M. Torikachvili, D. Argyriou, G. Luke, and W. Yu, Physica C: Superconductivity 469, 404 (2009).
- Torikachvili et al. (2008) M. S. Torikachvili, S. L. Bud’ko, N. Ni, and P. C. Canfield, Phys. Rev. Lett. 101, 057006 (2008).
- Yu et al. (2009) W. Yu, A. A. Aczel, T. J. Williams, S. L. Bud’ko, N. Ni, P. C. Canfield, and G. M. Luke, Phys. Rev. B 79, 020511 (2009).
- Saha et al. (2012) S. R. Saha, N. P. Butch, T. Drye, J. Magill, S. Ziemak, K. Kirshenbaum, P. Y. Zavalij, J. W. Lynn, and J. Paglione, Phys. Rev. B 85, 024525 (2012).
- Ma et al. (2013) L. Ma, G.-F. Ji, J. Dai, S. R. Saha, T. Drye, J. Paglione, and W.-Q. Yu, Chin. Phys. B 22, 057401 (2013).
- Soh et al. (2013) J. H. Soh, G. S. Tucker, D. K. Pratt, D. L. Abernathy, M. B. Stone, S. Ran, S. L. Bud’ko, P. C. Canfield, A. Kreyssig, R. J. McQueeney, and A. I. Goldman, Phys. Rev. Lett. 111, 227002 (2013).
- Kasahara et al. (2011) S. Kasahara, T. Shibauchi, K. Hashimoto, Y. Nakai, H. Ikeda, T. Terashima, and Y. Matsuda, Phys. Rev. B 83, 060505 (2011).
- Yildirim (2009) T. Yildirim, Phys. Rev. Lett. 102, 037003 (2009).
- Wang et al. (2014) X. B. Wang, H. P. Wang, T. Dong, R. Y. Chen, and N. L. Wang, Phys. Rev. B 90, 144513 (2014).
- Ronning et al. (2008) F. Ronning, T. Klimczuk, E. D. Bauer, H. Volz, and J. D. Thompson, J. Phys. Condens. Matter 20, 322201 (2008).
- Homes et al. (1993) C. C. Homes, M. Reedyk, D. A. Cradles, and T. Timusk, Appl. Opt. 32, 2976 (1993).
- Dai et al. (2014) Y. M. Dai, A. Akrap, J. Schneeloch, R. D. Zhong, T. S. Liu, G. D. Gu, Q. Li, and C. C. Homes, Phys. Rev. B 90, 121114 (2014).
- Lv et al. (2011) B. Lv, L. Deng, M. Gooch, F. Wei, Y. Sun, J. K. Meen, Y.-Y. Xue, B. Lorenz, and C.-W. Chu, Proc. Natl. Acad. Sci. U. S. A. 108, 15705 (2011).
- Gofryk et al. (2014) K. Gofryk, M. Pan, C. Cantoni, B. Saparov, J. E. Mitchell, and A. S. Sefat, Phys. Rev. Lett. 112, 047005 (2014).
- Basov and Timusk (2005) D. Basov and T. Timusk, Rev. Mod. Phys. 77, 721 (2005).
- Pratt et al. (2009) D. K. Pratt, Y. Zhao, S. A. J. Kimber, A. Hiess, D. N. Argyriou, C. Broholm, A. Kreyssig, S. Nandi, S. L. Bud’ko, N. Ni, P. C. Canfield, R. J. McQueeney, and A. I. Goldman, Phys. Rev. B 79, 060510 (2009).
- Wu et al. (2008) D. Wu, P. G. Khalifah, D. G. Mandrus, and N. L. Wang, J. Phys. Condens. Matter 20, 325204 (2008).
- Marsik et al. (2013) P. Marsik, C. N. Wang, M. Rössle, M. Yazdi-Rizi, R. Schuster, K. W. Kim, A. Dubroka, D. Munzar, T. Wolf, X. H. Chen, and C. Bernhard, Phys. Rev. B 88, 180508 (2013).
- Calderón et al. (2014) M. J. Calderón, L. d. Medici, B. Valenzuela, and E. Bascones, Phys. Rev. B 90, 115128 (2014).
- Nakajima et al. (2014) S. Nakajima, Masamichi Ishida, T. Tanaka, and S.-i. Uchida, J.Phys. Soc. Japan 83, 104703 (2014).
- Wang et al. (2012) N. L. Wang, W. Z. Hu, Z. G. Chen, R. H. Yuan, G. Li, G. F. Chen, and T. Xiang, J. Phys. Condens. Matter 24, 294202 (2012).
- Schafgans et al. (2012) A. A. Schafgans, S. J. Moon, B. C. Pursley, A. D. LaForge, M. M. Qazilbash, A. S. Sefat, D. Mandrus, K. Haule, G. Kotliar, and D. N. Basov, Phys. Rev. Lett. 108, 147002 (2012).
- Note (1) Since the high energy( 12\tmspace+.1667em000) optical spectral we observed does not vary with the temperatue, we do not take the spectral weight in this area into consideration.
- Mandal et al. (2014) S. Mandal, R. E. Cohen, and K. Haule, Phys. Rev. B 90, 060501 (2014).
- Cheng et al. (2012) B. Cheng, B. F. Hu, R. Y. Chen, G. Xu, P. Zheng, J. L. Luo, and N. L. Wang, Phys. Rev. B 86, 134503 (2012).
- Kresse and Furthmüller (1996) G. Kresse and J. Furthmüller, Computational Materials Science 6, 15 (1996).
- Kresse and Hafner (1993) G. Kresse and J. Hafner, Phys. Rev. B 47, 558 (1993).
- Kresse and Furthmüller (1996) G. Kresse and J. Furthmüller, Phys. Rev. B 54, 11169 (1996).
- Perdew et al. (1996) J. P. Perdew, K. Burke, and M. Ernzerhof, Phys. Rev. Lett. 77, 3865 (1996).
- Yin et al. (2011) Z. P. Yin, K. Haule, and G. Kotliar, Nat. Mater. 10, 932 (2011).
- Hoffmann and Zheng (1985) R. Hoffmann and C. Zheng, J. Phys. Chem 89, 4175 (1985).