Stellar Populations and the Star Formation Histories of LSB Galaxies: V. WFC3 Color-Magnitude Diagrams
Abstract
We present WFC3 observations of three low surface brightness (LSB) galaxies from the Schombert et al. LSB catalog that are within 11 Mpc of the Milky Way. Deep imaging at F336W, F555W and F814W allow the construction of the color-magnitude diagrams (CMD) to . Overall 1869, 465 and 501 stellar sources are identified in the three LSB galaxies F415-3, F608-1 and F750-V1. The spatial distribution of young blue stars matches the H maps from ground-based imaging, indicating that star formation in LSB galaxies follows the same style as in other irregular galaxies. Several star complexes are identified, matching regions of higher surface brightness as seen from ground-based imaging. The color-magnitude diagrams for each LSB galaxy has the similar morphology to Local Volume (LV) dwarf galaxies, i.e. a blue main sequence, blue and red He burning branches and asymptotic giant branch (AGB) stars. The LSB CMD’s distinguish themselves from nearby dwarf CMD’s by having a higher proportional of blue main sequence stars and fewer AGB stars than expected from their mean metallicities. Current [Fe/H] values below 0.6 are deduced from the position of the red helium-burning branch (rHeB) stars in the diagram. The distribution of stars on the blue helium-burning branch (bHeB) and rHeB from the and CMD indicate a history of constant star formation for the last 100 Myrs.
1 Introduction
The importance of low surface brightness (LSB) galaxies to galaxy studies is not that they dominate the total galaxy population of the Universe (they do not, Hayward, Irwin & Bregman 2005; Rosenbaum & Bomans 2004; Schombert, Pildis & Eder 1997) nor that they represent a special form of star formation (they do not, Schombert & McGaugh 2014). Instead, their importance lies in the need to explore the full range of galaxy characteristics in order to derive formation and evolutionary scenarios unbiased by size, mass or density. A clear picture of galaxy formation requires the inclusion of the LSB realm both globally, those galaxies that are LSB in their mean stellar densities (Pildis, Schombert & Eder 1997), and locally, the LSB regions of a galaxy (Boissier et al. 2008)
This series of papers (Schombert, Maciel & McGaugh 2011, Schombert, McGaugh & Maciel 2013, Schombert & McGaugh 2014a, Schombert & McGaugh 2014b) has explored the class of LSB galaxies selected from visual survey only by their mean surface brightness (in this sense, a class of objects that occupy the faintest end of central surface brightness distribution). The LSB class contains a full range of galaxy types (irregulars to disks) and a full range of size and luminosity (dwarfs to giants). They are found in all types of galaxy environments (Schombert et al. 1992; van Dokkum et al. 2014), but tend to avoid the dense, rich environments, such as cluster cores (Galaz et al. 2011). While LSB dwarf ellipticals (dE’s) and dSph are gas-poor and often found in clusters, the typical LSB galaxy is gas-rich (Huang et al. 2014, and references therein), but with low H fluxes indicating low current star formation rates (SFR; Schombert, Maciel & McGaugh 2011).
Over the years, and numerous studies by many observing teams, the following characteristics were found to be in common with galaxies at the low end of the surface brightness spectrum. There are, of course, exceptions to all of the following generalizations, but a majority of LSB galaxies maintain these trends. First, the ratio of gas to stellar masses increases dramatically with decreasing mean surface brightness such that the highest gas fraction galaxies () are typically LSB as has been shown in previous studies (McGaugh & de Blok 1997, Geha et al. 2006). This is not too surprising in that baryonic content of galaxies is primarily stars and gas, so the decreased importance of stellar mass will naturally result in an increasing fractional dominance of gas.
Second, the optical and near-infrared (near-IR) colors of LSB galaxies are atypically blue (Pildis, Schombert & Eder 1997; Schombert & McGaugh 2014b). This is only considered atypical in the sense that their current SFR are extremely low, with values in common with red spirals and S0’s. However, galaxy colors have a trend of becoming bluer with more irregular morphology and higher gas fractions, so the expectation, just based on morphology and gas content, is that LSB galaxies should have similar colors as other irregular galaxies.
Third, unsurprisingly, LSB galaxies do have extremely low current SFRs (on average a factor of ten lower than other irregular galaxies of similar stellar mass; Schombert, McGaugh & Maciel 2013). The style of star formation is similar to other irregular galaxies, i.e., most of the star formation is concentrated in HII regions. This dispels a scenario where LSB galaxies only form stars outside molecular complexes (Schombert et al. 1990). LSB galaxies also have a normal range of HII region sizes from massive complexes to individual OB star regions (Schombert, McGaugh & Maciel 2013), i.e., massive complexes do occur despite their low mean stellar densities.
The key dilemma from LSB galaxies studies is primarily concerning their stellar populations. As the mean surface brightness decreases, the optical and near-IR colors become bluer, SFR decreases. This is opposite to the expectation that a galaxy whose current SFR’s are low should be dominated by the older, redder population, particularly in the lowest surface brightness regions. Contrary, Schombert, McGaugh & Marciel (2013) found that the optically dimmest regions were, in fact, the bluest regions. Near-IR imaging revealed that the colors for LSB galaxies could be explained by a combination of metallicity and the pattern of recent star formation (low level bursts separated by quiescent epochs; Schombert & McGaugh 2014a). Models of roughly constant mean star formation rate punctuated by stochastic variations in current SFR also agree well with constraints from kinematic studies, where LSB irregulars display solid body rotation rather than the differential rotation that drives most spiral patterns (Kuzio de Naray, McGaugh & Mihos 2009, Eder & Schombert 2000). Constant star formation, in turn, provides a natural explanation for the observed range of stellar mass-to-light ratios in LSB galaxies (Schombert & McGaugh 2014a).
A more direct method to understanding the star formation history of LSB galaxies is to, of course, resolve the stellar population using deep space imaging (Dalcanton et al. 2009). For even the top of a stellar population’s color-magnitude diagram (CMD) reveals detailed information on the evolution of the underlying stars, the SFR over the last Gyr and chemical evolution of those stars. Interpretation is assisted by numerous synthetic CMD simulators that use the most recent stellar isochrones and take into account short-lived, but highly luminous, phases of stellar evolution (e.g., asymptotic giant branch stars, blue stragglers, etc., see Gallart et al. 1996; Mighell 1997; Holtzman et al. 1999; Dolphin 2002; Aparicio & Hidalgo 2009)
The analysis of CMD’s in numerous Local Volume (LV, galaxies within 10 Mpc of the Milky Way) primary and dwarf galaxies has filled the literature in the last ten years (see Tully et al. 2009; McQuinn et al. 2012). These studies have found that the star formation history of most LV dwarfs is a complicated progression of bursts of star formation; however, they all also have significant old stellar populations ( 8 Gyrs) that dominate their global colors and the lower portion of the CMD. Resolved populations also give spatial information on the star formation history (SFH) of LV dwarfs (McQuinn et al. 2012), usually solid body rotation prevents significant mixing on 50 Myr timescales (Bastian et al. 2009) allowing for the potentially mapping of the spatial chemical history of stars rather than gas metallicity from emission lines (Gallart et al. 2005).
Of course, the less distant a galaxy is to the Milky Way, the fainter into a CMD one can resolve. Unfortunately, none of the LSB dwarfs from our samples are closer than 8 Mpc, the outer edge of successful HST stellar photometry and, thus, our interpretation will be limited to the bright portion of the CMD. For this study, we have selected three dwarfs from our LSB catalogs that are the closest to the Milky Way (F415-3, F608-1 and F750-V1) for WFC3 imaging in three filters (F336W, F555W and F814W). Our objective is to obtain the first observations of the top of the CMD in any LSB galaxy for comparison to other LV dwarfs. These galaxies also have matching ground-based optical, near-IR, H and HI imaging for comparison to the resolved stellar populations. Our goal is a first look at the details of the star formation history of these low density galaxies and their relevance to galaxy formation and evolution scenarios.
2 Analysis
2.1 Sample
Three LSB galaxies were selected from dwarf LSB catalog of Schombert, Pildis & Eder (1997), an optically selected sample with Arecibo HI observations. The criteria for inclusion in the Schombert dwarf LSB sample was 1) LSB nature, 2) one arcmin or greater angular size and 3) irregular morphology. The intent of the sample was to extend the local dwarf galaxy sample as a test of biased galaxy formation scenarios. There was no attempt to be luminosity or mass complete; size, morphology and LSB appearance were the main criteria.
The three galaxies selected were all Fall objects (F415-3, F608-1 and F750-V1) and all located less than 11 Mpc away. Their distances are from HI observations (Eder & Schombert 2000), corrected to the CMB reference frame by NED, and are 10.4, 8.9 and 7.9 Mpc respectively with an accuracy of 0.1 Mpc. These were the closest LSB dwarfs in the Schombert LSB catalog to maximize the detection of stellar populations and depth to the resulting CMD. F608-1 is also UGC159, where the original coordinates were misprinted on POSS SAO overlays resulting in separate designations for several years. We maintain the LSB catalog labels for clarity.
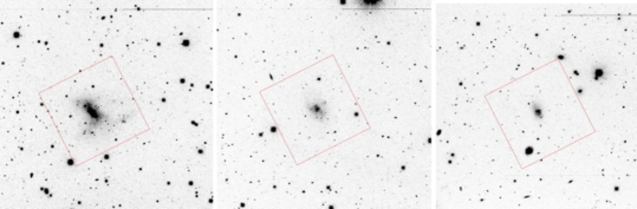
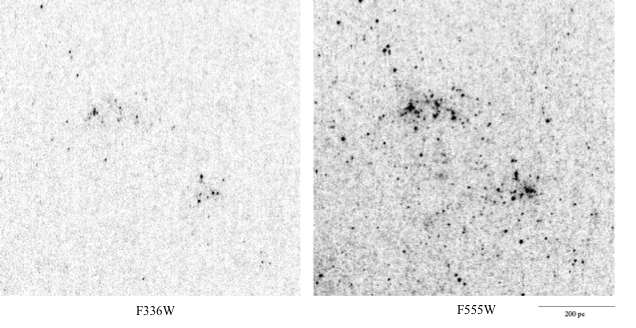
Ground-based images from KPNO 2.1m for all three galaxies are shown in Figure 1 (each image is 900 secs of exposure, 0.61 arcsecs/pixel plate scale). Their optical and HI properties are summarized in Table 1. Compared to other LSB galaxies studied in H (Schombert, McGaugh & Maciel 2013), F608-1 and F750-V1 are on the small size (less than 0.6 kpc in radius at the 26 mag arcsec-2 isophote), F415-3 is 1.8 kpc in radius, larger but still dwarf-like in size. Their central surface brightness are average with respect to the LSB sample as a whole, ranging around 23 mag arcsecs-2. F608-1 and F750-V1 have the lowest baryon masses (gas plus stellar mass) in the LSB sample (107.8 and 10). F415-3 has an average LSB mass and luminosity (10). All three have high gas fractions (/+) greater than 70%.
With respect to star formation, all three galaxies have very low current star formation rates based on H measurements. They lie in the lower 10% of the star formation rates (SFR) for LSB galaxies (110 objects) studied by Schombert, McGaugh & Maciel (2013) and in the bottom 5% of star forming dwarf galaxies (168 objects, van Zee 2001; Hunter & Elmegreen 2004). Despite the low SFR’s, their optical colors are very blue, typical of values for LSB galaxies and star-forming spirals, although the blue colors in star forming galaxies is presumingly due to a large high-mass stellar population. The origin of blue colors in LSB galaxies is unclear as the current SFR is low. Possible explanations for the blue colors of LSB has ranged from extremely low metallicities (Schombert et al. 1990) to unusual stellar types (i.e. over abundance of bHB or blue straggler stars, Rakos & Schombert 2004), but no particular idea has gained support from observations.
2.2 Observations
The CMD’s presented herein are produced by performing HST stellar photometry taken with the Wide Field Camera 3 (WFC3), the fourth generation UV/IR imager. WFC3 uses two backside illuminated 2Kx4K CCDs with a combined field of view of 162x162 arcsecs. The plate scale is 0.04 arcsecs/pixel. Observations were taken in three filters F336W, F555W and F814W, approximately Johnson , and . These filters were selected to isolate a CMD in to measure mean metallicity of the older population and observations to identify the UV sources of the limited H emission seen in these LSB dwarf galaxies.
Ten orbits from cycle 20 were assigned to each object, split as five orbits for F336W, three orbits for F555W and two orbits for F814W. Due to their low surface brightness nature, the observations were made in LOW-SKY mode where the zodiacal light is less than 30% of the minimum. Each orbit was broken into four exposures using UVIS-DITHER-BOX for cosmic-ray subtraction and to minimize pixel-to-pixel sensitivity variations. A pre-flash option was used for the F336W exposures to avoid a known WFC3 charge transfer problem (Anderson & Baggett 2014). Orbital variations resulted in total F336W exposure times of 8,800 secs for F415-3 and 10,000 secs for F608-1 and F750-V1. F555W and F814W received total exposures of 7,088 and 4,688 secs for all three galaxies.
Reduction images were taken directly from the STScI pipeline where bias, flat-fielding and image distortion were automatically corrected. Calibration was performed using standard WFC3 header values. CMD’s for all three colors, in the HST filter system, are shown in Figure 12. Conversion from the WFC3/UVIS filter passbands to the Johnson/Cousins passbands was accomplished using the photometric transformation to magnitudes, then from to . The conversion for and are well known, but the conversion to is less well established. After some investigation, we used the and magnitude of the Sun (6.35 and 5.61 at 336 nm, Blanton et al. 2007) for the conversion. We confirmed the and calibration by comparison to ground-based images calibrated with Landolt standards. The mean difference between HST and ground-based magnitudes was 0.010.05 in and 0.020.07 in , effectively zero. Galactic extinction was applied to the final photometry following the prescription of Schlafly & Finkbeiner (2011). These values were 0.27, 0.15 and 0.25 for our three galaxies.
Stellar sources were identified using a threshold filter that used local sky for discrimination. Crowded fields in the galaxies’ cores were isolated by visual inspection; however, the crowding was by no means as intense as often appears in high surface brightness galaxies. Star clusters were identified by visual inspection and assigned a letter designation. Many of these corresponded to regions of enhanced surface brightness in ground-based images ( knots and HII regions). Comparison between frames made use of the internal WCS for the WFC3 frames. Comparison to ground-based optical and H images used a coordinate system based on a dozen stars in common with the WFC3 fields.
Stellar photometry was performed using the version of DAOPHOT found in the recent PyRAF platform. Although more sophisticated photometry programs were available, the low number of sources and wide spacing indicative to LSB galaxies made for uncomplicated PSF fitting and local sky determination. Targets were identified by a combination of threshold filtering and visual inspection. A series of 10 to 15 stars were selected as PSF standards. The FWHM was consistent at 0.092 arcsecs in each filter. Non-stellar objects, based on profile sharpness, were rejected as presumed background galaxies (although the possibility that these objects are planetary nebula is not excluded). A few interesting (i.e., very bright) stars were too crowded to process automatically and were reduced by interactive tools.
Blending is a serious problem at distances of the three galaxies in our sample. However, there are couple factors that work to minimize the effects of blending on our results. First, the stellar densities of our LSB galaxies are, by definition, much lower than other LV dwarfs with resolved stellar populations. Aside from a few very dense regions associated with the high H signature of strong star formation, most of the stellar sources are spatially well defined. Second, blending by binary pairs is less of a concern than other CMD studies for we only sample the top of the luminosity function. Odds are that the companion star for a binary system will be much less luminous than the primary, that have a small contribution to the measured color.
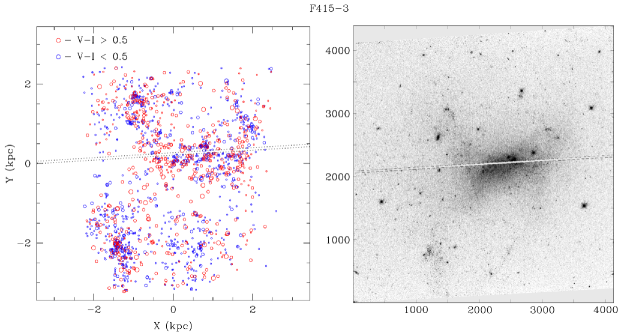
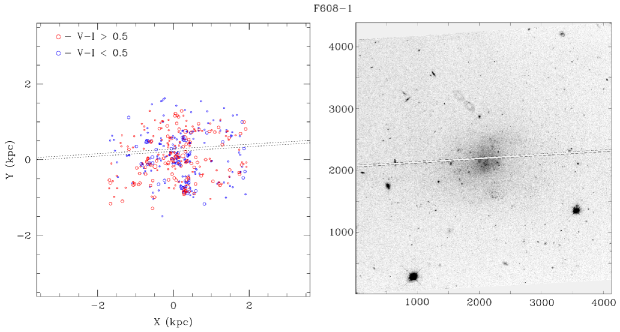
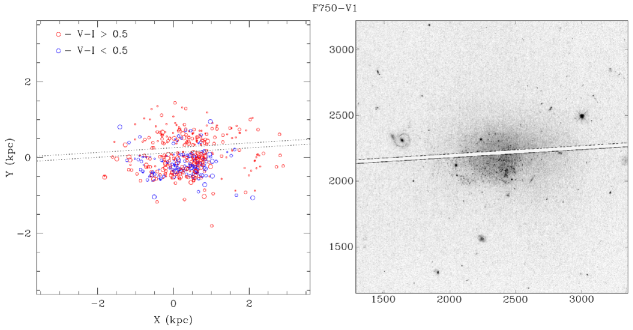
A large occulted region passes through the center of the WFC3 frame as an artifact of the interface between the two CCD’s. This region, while manually removed from the image, unfortunately, also passes through the center of each galaxy. However, offsets would have moved interesting outer star-forming regions off field. As the occulting strip varies in sky position from filter to filter (orbit visit to visit), some clusters in the galaxy cores were only observed through one or two filters. A map of all the sources with at least two color photometry is found in Figures 2, 3 and 4.
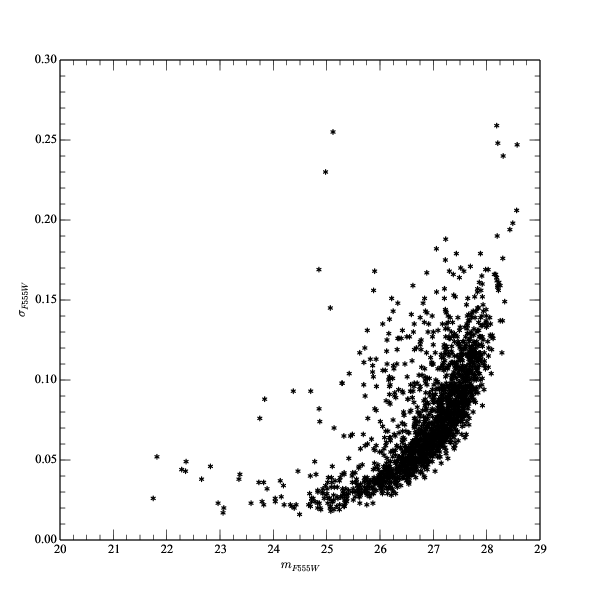
The limiting magnitudes and photometric errors were similar from galaxy to galaxy since the exposure times and instrument set-up were identical. The limiting magnitudes were 27.1 in F336W (), 27.4 in F555W () and 27.5 in F814W (), which corresponds to approximately at the distances of the sample. These were exactly the expected limiting magnitudes based on pre-observation calculations from HST’s APT for the requested orbits and filters. The photometric errors as a function of F555W magnitude is shown in Figure 5. At the limiting magnitude, errors reach 0.12, 0.07 and 0.20 in F336W, F555W and F814W. Stars with errors greater than these values were inspected visually for reality. Experiments with artificial stars demonstrated that our sample is complete to 80% at the limiting magnitude in F555W. Thus, we use the catalog of F555W detections as the primary catalog and search for stars detected only in F336W or F814W as extreme blue or red objects. A total of 2,155 sources are found for all three galaxy with S/N 5 (1,869 in F415-3, 465 in F608-1 and 501 F750-V1). All the photometry and images can be found at our LSB website (http://abyss.uoregon.edu/js/lsb).
2.3 Surface Brightness Mapping
One of the many paradoxes for LSB galaxies is the origin of their LSB nature. There is the original problem of why their are so low in surface brightness as a class of objects, compounded with the dilemma that even their lowest LSB regions are atypically blue in color (Schombert, McGaugh & Maciel 2013). A faded (i.e., old) stellar population would exhibit a LSB nature, but would be quite red (Rakos & Schombert 2005). Alternatively, the spacing between stars might be much larger than star-forming spirals, resulting in less stellar luminosity per pc2 or the galaxies might be much thinner than other dwarf galaxies. Both scenarios require very different star formation mechanisms than the usual molecular cloud collapse into star clusters once a critical gas density is reached (i.e., Schmidt’s law, Lada 2014).
The distribution of stellar sources is the first look we have into the tip of the underlying stellar population in LSB galaxies. There are 1,869 detected stellar objects in F415-3. They range in absolute luminosity from 10 to 0.5 mag. The total luminosity of the stellar sources is log = 6.86, compared to log = 7.85 for the galaxy’s total luminosity (using 4.83 as the absolute magnitude of the Sun). This means that the observed WFC3 stellar population is only 1/10th of the total luminosity of the galaxy, the rest contributed by an unresolved, underlying stellar population.
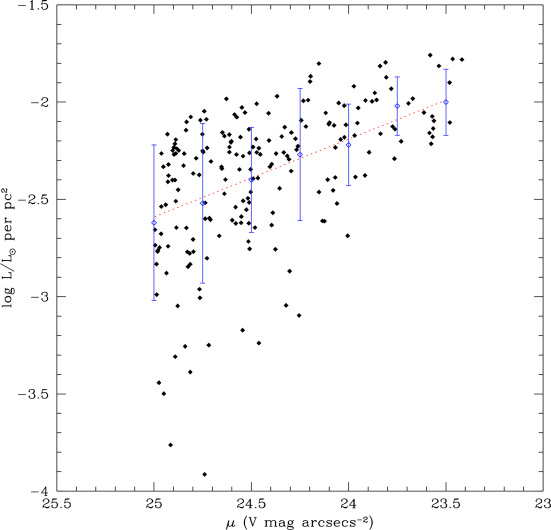
We can check the distribution of surface brightness from ground-based images, which measures the contribution from all the stars, with the luminosity distribution of the WFC3 sources. The mean surface brightness is taken from re-registered ground-based images where a 3x3 arcsecs box was used to smooth the cleaned image (foreground and background objects removed). This is compared to the sum of the luminosity of all the stellar sources in the same region, converted to luminosity per pc2. The resulting correlation between the source distribution and surface brightness shown in Figure 6, scaled by a factor of 1/10 for the luminosity of the stellar sources.
There are several interesting points to extract from this Figure. First, as was expected by visual inspection of Figure 2, there is a correlation between stellar counts and the underlying surface brightness of the galaxy. Regions of bright surface brightness (knots from Paper II) are clearly associated with stellar associations. Regions of densely packed stellar sources are also higher in mean surface brightness. Note that this correlation does not necessarily have to exist, for while the higher surface brightness regions would be associated with new star formation, the lower surface brightness regions could be faded populations devoid of bright stars. This increases the confidence that conclusions based on the top of the stellar luminosity function can be extended to the underlying stellar population.
The correlation between stellar sources and mean surface brightness also follows the trend expected for converting surface brightness into stellar luminosity per pc2 (dotted line in Figure 6, corrected for missing luminosity of undetected stars). A majority of the data is within the expectation of liner correlation between surface brightness and stellar counts. This implies that for every square parsec the relationship between the bright stars and faint, unresolved, stars is constant. That is, there are no hidden populations in LSB galaxies. Aside from the very brightest, short-lived blue stars, the other stellar sources trace the faintest, unresolved stars as well. The broad distribution of blue stars indicates a great deal of uniformity by age to the stellar populations in LSB galaxies. There appear to be no regions that are strictly old (greater than 3 Gyrs) stars. In most galaxies, an old population is associated with some central concentration of light. The irregular morphology of LSB galaxies means the older populations, if they exist, are intermixed with the new stars.
2.4 Star Clusters Identification
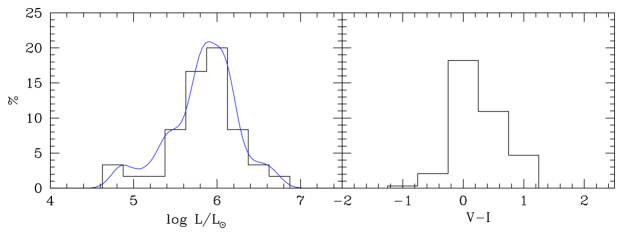
Numerous stellar associations are identified in all three galaxies, again indicating that star formation in LSB galaxies proceeds in a fashion similar to HSB star-forming spirals and irregulars, i.e. molecular clouds collapsing to form stellar clusters. Thirty-nine groupings were identified in all three galaxies (23 in F415-3, 11 in F608-1 and 5 in F750-V1). Assuming a standard IMF, these clusters range in masses from a few times to , see Figure 7. However, as a cautionary note, most of these groupings are 25 to 50 pc in size and are probably collections of several smaller clusters in the same region. Open clusters found in M31 (Williams & Hodge 2001) display a similar appearance to the clusters identified in our LSB galaxies (see their Figure 5), but the regions associated with H emission are 100’s of pc in diameter and can accommodate several groups of ionizing OB stars.
The star clusters’ mean colors are typically blue (), but the inclusion of one or two bright red red giant branch (RGB) or asymptotic giant branch (AGB) star makes a mean color less sensitive to the age of the cluster (see Asa’d & Hanson 2012). Our limiting magnitude (see §2.2) means that the stellar sources that identify the clusters are composed solely of OB stars or stars above the tip of the RGB. The clusters in F415-3 are bluer, on average (mean ), versus the cluster colors in F608-1 and F750-V1 (mean ). These colors map consistently into the of LSB knots from ground-based images (Schombert, McGaugh & Maciel 2013) implying that the ground-based colors of the enhanced surface brightness knots are also driven by the brightest stars.
Figures 8, 10 and 11 display a mosaic of some clearer examples of the star associations in each galaxy. Associations are identified by a letter and H contours from ground-based imaging are also shown in each Figure. The H peaks are always associated with a bright, blue star or small grouping of blue stars. However, there are several associations not identified with H emission (e.g., cluster C in F608-1). Normally, these would be identified with older associations (ages greater than 10 Myrs) as the ionizing stars would have died off; however, most have at least one centrally located bright, blue star. Presumingly, these are clusters where the leftover gas has been blown away by galactic winds or made too diffuse to be detected in ground-based H imaging.
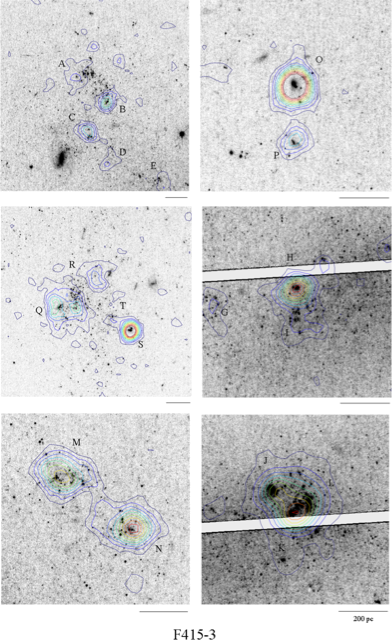
F415-3 is our largest galaxy in sample with the most number of detected stellar sources. Twenty-three associations were identified by visual inspection, all associated with a distinct HII region. The irregular morphology of LSB galaxies is often driven by the presence of one or two knots, now identified with a single cluster or group of clusters. For example, the LSB features to the SE and SW (see Figure 1) are cluster groups A through D (SW) and groups Q through S (SE). However, their spacing is sufficiently wide enough to prevent a distinct HSB knot as would be visible in a star-forming irregular galaxy. Cluster O demonstrates the sharp correlation between ionizing star luminosity and the H emission. The ionizing pair of OB stars in cluster O are the brightest in the sample.
Clusters M and N (bottom left) are good examples of two H knots associated with two distinct knots in ground images. The two clusters are displayed in Figure 9 with the F336W frame next to the F555W frame. The ionizing blue stars are obvious in the F336W frame, with 4 to 5 OB stars per cluster. This maps nicely into the H fluxes of those regions (log and 37.15 respectfully) which corresponds to approximately five OB stars (see Figure 13; Schombert, McGaugh & Maciel 2013).
The central HII region in F415-3 divides into at least three groupings (J, K and L). The H flux of this region (38.10) corresponds to several Orion sized HII regions, but was unresolved into the distinct clusters. We suspect that many of the bright HII regions in LSB galaxies are unresolved combinations of several Orion-sized clusters as displayed by clusters J, K and L as their combined surface brightness is only slightly less that a 30 Dor sized complex. Cluster H and I (middle right panel) display a more common grouping where cluster H is powered by a massive O star, while cluster I has only two, faint stars visible in the F336W frame and would produce very few ionizing photons.
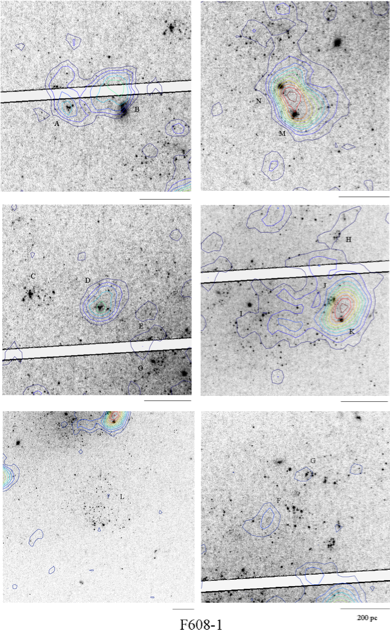
F608-1 also displays a number of distinct associations (see Figure 10, ranging from to a few times . Of the thirteen identified groupings, only two are not associated with H emission. One grouping (L) is widely dispersed, having the appearance of an old, open cluster, but being much too dispersed to be a gravitational unit (having a scale size of 400 pcs). Most likely, this is a region where several complexes were born, evolved and dispersed by kinematic effects. The G cluster displays very faint H under closer inspection of the original ground-based images. The remaining cluster (C, middle left) shows no H despite having several OB stars to ionize any nearby gas. It is one of the reddest clusters in the sample () perhaps indicating an older age where the leftover gas has been blown away by stellar winds.
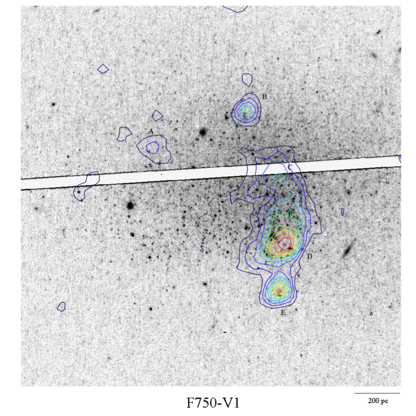
Our smallest galaxy, F750-V1 (see Figure 11), has five distinct HII regions but with H luminosities near log = 36.0, i.e. the flux expected from one OB star. Cluster E is a distinct cluster of a handful of blue stars, but the HII regions to the north are a widely dispersed, over an area of 500 pc, with only a few OB stars. Clusters A and B are powered by a single O star.
2.5 Stellar Distribution
Without a global dynamic structure, such as supplied by spiral density waves, the star formation history in LSB galaxies should be dominated by stochastic processes and, thus, the spatial distribution of young stars is a measure of this process. As can be seen in Figure 2, the blue stars are clearly more clustered then the redder population, although this is even more magnified as many of the stars are on the red helium-burning branch and, thus, are only 100 Myrs old.
This differs from the stellar distribution in LV dwarfs such as NGC 1705 (Tosi et al. 2001) where the young stars are concentrated in the central regions with an older population found in the halo. However, the distribution of young stars in our irregular LSB galaxies is mostly a statement of how the stellar mass is distributed. Most irregular LSB galaxies have no well-defined central location and it is rare to find the highest surface brightness region associated with the geometric center defined by the outer isophotes. Star formation, and thus the youngest stars, are clearly associated with the higher surface brightness knots seen in the ground-based images and the uniform stellar distributions, such as those in NGC 1705, are accidents of the uniformity of the isophotes in some LV dwarfs.
To be more precise, 75% of the stars in identified stellar associations or groupings have colors less than while only 40% of the field population are that blue. Although we refer to the groupings in Figure 8, 10 and 11 as star clusters, this is a misnomer as gravitational bound open clusters range have sizes from a few to 10 pc’s in diameter. In fact, these associations should be referred to star complexes, for they probably contain several cluster-sized units and their luminosity plus H fluxes are more in agreement with a grouping of young open clusters.
The star formation pattern in our LSB sample is similar to the pattern found in Sextans A (a Local Group dwarf of similar size and luminosity as F415-3, see Dohm-Palmer et al. 2002) where the brightest bMS stars are found in the stellar groupings and the highest percentage of older AGB stars are found in the regions between the H knots. Also the 100 Myr population (rHeB stars) are located primarily in the stellar associations, but with less density than the very young bMS stars (50% versus 75%). None of this is particularly surprising as it appears that local star formation in LSB galaxies proceeds in the same fashion as their HSB irregular cousins, i.e., from compact clusters to dispersed associations.
The only peculiar aspect to the stellar distribution (especially for F415-3) is the existence of any bright O stars outside of an association or an HII region. The lack of H emission may relate to the low gas density in LSB galaxies for about 50% of the H emission in LSB galaxies is not associated with a particular HII region, but exists in a low surface brightness diffuse form. Thus, the isolated O stars may be generating this H emission not visible against the sky background. O stars outside of a cluster is not improbable considering the internal kinematics of LSB galaxies. The typical gas velocity dispersion is 8 km/sec (Kuzio de Naray et al. 2006) which corresponds to 5 pc/Myr, or sufficient velocity to scatter older O stars from their regions of intense star formation, or isolate single O star HII regions.
2.6 Color Magnitude Diagrams
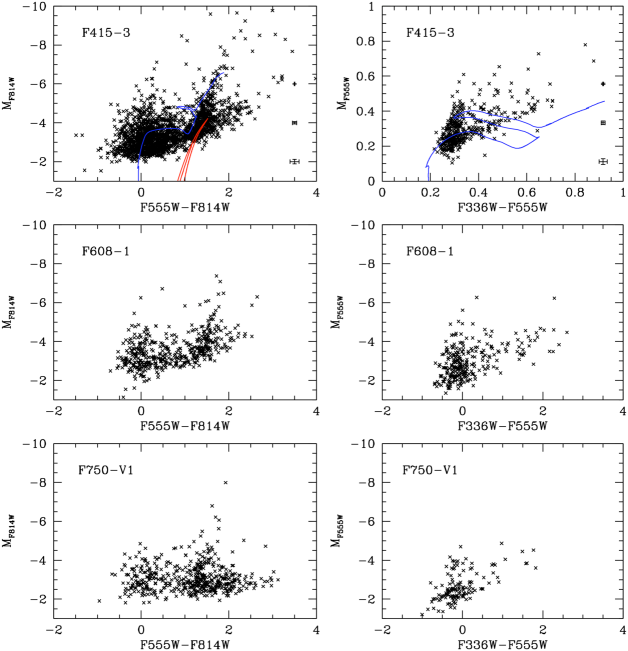
The color-magnitude diagrams for all three galaxies, in HST filters F336W, F555W and F814W, are shown in Figure 12. The left panels are versus , the right panels display versus , where the absolute magnitudes are determined from the distances in Table 1. Shown for reference are stellar isochrones for a 50 Myr population of [Fe/H]=0.6 and a 12 Gyr population with a [Fe/H]=1.5. Similar features are seen in all three galaxies, with the clearest CMD morphology visible in F415-3 due to its larger sample.
The brightest stars in F415-3 () are potentially foreground stars. According to Gould, Bahcall & Maoz (1993), a total of 3105 stars per square degree are expected at this galactic latitude and limiting magnitude of (). For the size of F415-3, this results in 15 possible contaminating stars, whereas there are 16 stars brighter than in F415-3. This makes all of them potentially non-members of the F415-3’s stellar population. Neither F608-1 nor F750-V1 appear to have foreground stars contaminating their samples, probably due to their smaller samples and angular sizes.
Our analysis of the CMD’s in LSB galaxies is guided by comparison to other dwarf CMD’s (e.g., IC 2574, see below) and stellar population simulations. One of the highest quality simulators is the synthetic CMD generator from IAC-STAR (Aparicio & Gallart 2004). Numerous variables control a synthetic CMD generator, i.e., the IMF, star formation rates and chemical evolution scenarios. Our experiments used the isochrones (Bertelli et al. 1994) with the default mass loss and IMF settings from the IAC-STAR simulations. We adopt a chemical evolution scenario similar to our own stellar population models (Schombert & McGaugh 2014a) where the initial metallicity was chosen to be [Fe/H] = 1.5 and ending with values varying from 0.9 to +0.1.
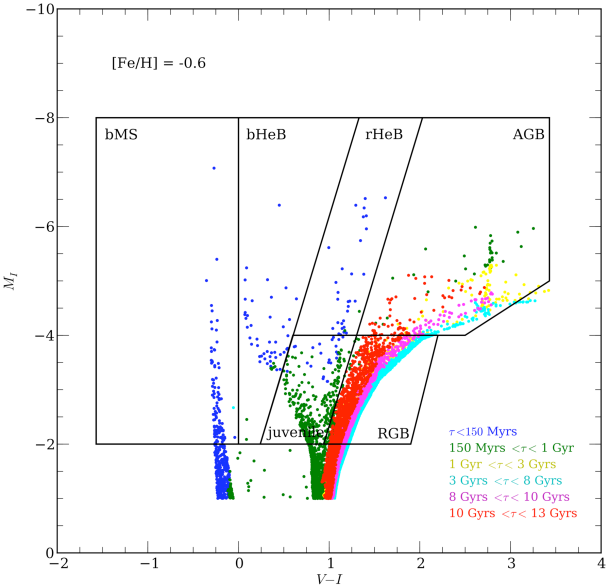
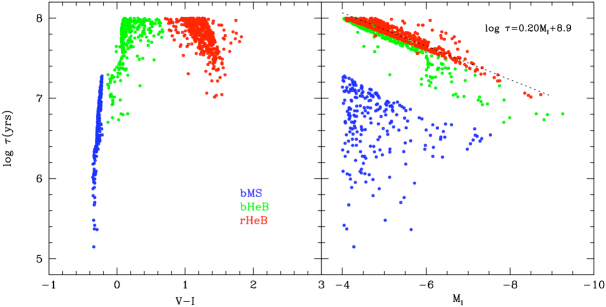
One such synthetic CMD’s, for a final metallicity of [Fe/H] and constant star formation over 13 Gyrs, is shown in Figure 13. Only the top of the CMD is shown () and different aged stars are represented with different symbol colors (blue for less than 150 Myrs, green for between 150 Myrs and 1 Gyrs, yellow for 1 to 3 Gyrs, cyan for 3 to 8 Gyrs, magenta for 8 to 10 Gyrs and red for older than 10 Gyrs). Immediately obvious are the very young features of a stellar population, the bMS, bHeB and rHeB branches plus a fainter ’juvenile’ population of stars with ages between 150 Myrs and one Gyr (this would include the brightest portion of the red clump). Beyond one Gyr, the stellar populations quickly develops into a classic RGB with the oldest stars forming the blue edge of the RGB. Intermediate aged stars (between two and eight Gyrs) dominate the AGB region of the synthetic CMD.
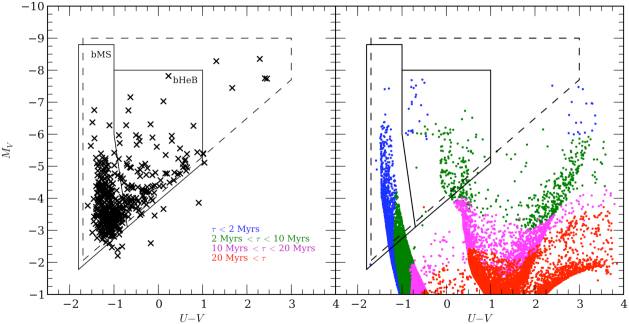
We have designated specific regions in the vs CMD to compare the star formation history of LSB galaxies with the other HST dwarf galaxy samples. This will allow us to compare data from dwarf galaxies with large numbers of stellar sources to our smaller samples plus comparison with synthetic CMDs. The six regions are shown in Figure 13 and comprise the area in the CMD that are sensitive to specific age and metallicity effects. The region to the far blue encompasses the youngest stars, those making up the tip of the main sequence (bMS), defined as all stars bluer than . Slightly redder is the region containing the blue branch of the helium-burning phase (bHeB) defined by a wedge parallel to the red (rHeB) branch. The rHeB branch is defined as a parallelogram with a width that would capture a range of metallicities strictly above the line, i.e. the tip of the RGB.
Stars in bMS region are less than 15 Myrs in age, while stars in the bHeB and rHeB are between 15 and 150 Myrs. The rHeB feature is from and between and, while this region also contains very young stars, the age of the stars decreases as their luminosity increases (see Figure 18). Therefore, the number of the stars from the base of the rHeB to the tip are a measure of star formation over the last 100 Myrs (see §2.8). A combination of studying the bluest stars, and the brightest red stars, resolves the most recent star formation epoch outside of H emission ( Myrs).
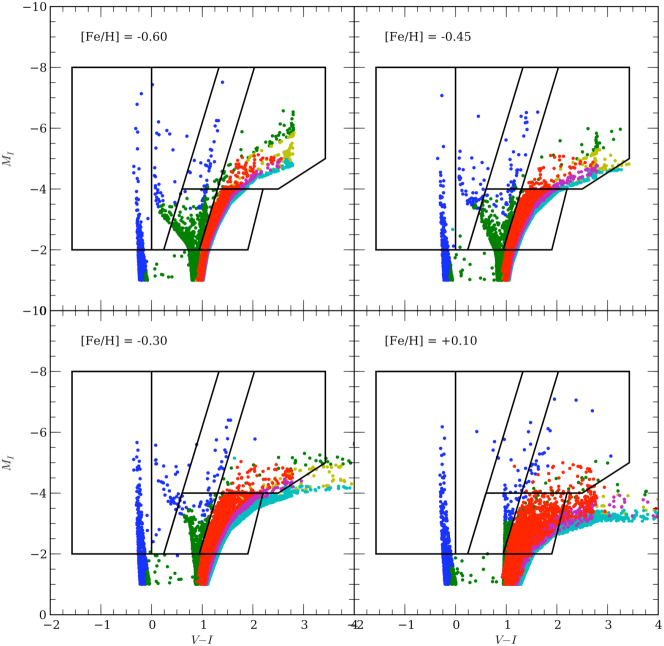
The region below the rHeB contains stars with ages between 150 Myrs and 1 Gyrs, a young population, but not the stars involved in HII regions or any emission line signatures of star formation. As they are younger that the typical intermediate age population (e.g., AGB stars), we have titled this region as ’juvenile’ stars. Stars older than one Gyr will occupy the AGB and RGB sections of the CMD. The stars with ages between one and 8 Gyrs dominate the AGB region, thus the ratio of AGB to RGB stars is a measure of this epoch of star formation. However, this region is also highly dependent on the metallicity where lower metallicity populations contain more stars in the AGB region. The effect of metallicity can be seen in Figure 14, where four simulations of varying ending [Fe/H] are shown. Metallicity effects are most prominent for the rHeB and AGB populations.
Lastly, there is the region below (the tip of the RGB) that is the classic old, RGB. The blueward side of the old RGB is fixed by the metallicity of the initial stellar population. As the metallicity, and age, increases for later generations, those stars occupy the redder portion of the CMD. Low metallicity, old stars can occupy the AGB region but with decreasing number of AGB’s with increasing metallicity. Thus, the ratio of the AGB region to the old RGB region, combined with the position of the rHeB, is a measure of the rate of chemical evolution of a galaxy and its current metallicity.
Interpretation of the various regions is dependent on the chemical history of the galaxy. To demonstrate this effect, we varied the final metallicities between [Fe/H] and +0.1 for a population with a history of constant star formation and a initial metallicity of [Fe/H]=1.5. The results are shown in Figure 14 for the four different ending [Fe/H] values. The first characteristic to note is that the position of very young stars (less than 15 Myrs, the bMS) is independent of metallicity. On the other hand, the color of the bHeB and rHeB branches are mildly dependent on metallicity. In fact, the rHeB is a feature that only exists for metallicities less than 0.3 and its mean color is sharply defined by the current metallicity.
Other features to note is the broadening of the RGB with increasing metallicity, and the decreasing importance of AGB stars with metallicity. For the range of expected metallicities (LSBs range from [FE/H] = 1.0 to 0.3 based on oxygen abundance analysis, McGaugh 1994; Kuzio de Naray, McGaugh & de Blok 2004), the morphology of the RGB and AGB are fairly constant. The juvenile population also remains well defined over these metallicities, with the dividing line between the juvenile and RGB populations unchanged by variation in metallicity. Changes in star formation history will work to increase (or decrease) the numerical proportions of the various ages, but will not alter the position of the various regions in color-luminosity space.
A complicating factor to the simulations is the ratio of so-called light or elements, typically expressed as /Fe, in a stellar population. Supernovae are the main contributors of metallicity in a stellar population; however, Type Ia and Type II SN contribute differing amounts of Fe where Type Ia SN overproduce Fe with respect to elements. Thus, the ratio of elements to Fe is a function of the number of Type II versus Type Ia supernova in a galaxy’s past with Type Ia SN producing extra amounts of Fe and driving the ratio downward. Since main source of free electrons in stellar atmospheres is Fe, stars with high /Fe ratios will have hotter (i.e., bluer) colors. Ellipticals tend to have high /Fe ratios (typically near 0.3, compared to the solar value of 0.0, Sánchez-Blázquez et al. 2006), primarily due to their evolution dominated by a rapid burst of star formation at early epochs. As Type Ia SN require at least a Gyr to develop their white dwarf companions, a rapid burst of star formation will leave a stellar population deficient in Fe (i.e., a high /Fe ratio). However, Type Ia SN require at least a Gyr of time to build-up within a galaxy and, therefore, high fractions of /Fe indicate shorter duration times for star formation. Constant star formation, such as found for the Milky Way, allows for the build-up of Type Ia SN and, therefore, lower /Fe values.
We investigated the effects of variation in /Fe in Paper III (Schombert & McGaugh 2014a) using -enhanced isochrones from the BaSTI group (Pietrinferni et al. 2004). Increasing the /Fe ratio by 0.3 from solar resulting in integrated color of 0.03 bluer. The isochrones are approximately 0.02 bluer around the red clump, decreasing to zero at the turn-off point. Similar changes were observed for the bHeB and rHeB positions in the -enhanced isochrones. The expectation for the star formation history of LV and LSB dwarfs is that their past SFR’s are more similar to the Milky Way than ellipticals. So expected values for /Fe should range from solar (i.e. zero) to slightly less than zero. For example, Lapenna et al. (2012) found the youngest stars in the LMC to be slightly under solar (/Fe=0.1). If the stars in the LSB galaxies in are sample have similar ratios, than the effect of /Fe on the synthetic CMD’s will be quite small (less than 0.01 in ) and comparison with LV dwarfs (with near solar values) is appropriate.
In order to compare the deeper CMD’s of nearby dwarfs to our three LSB galaxies, we have outlined a completeness region (see Figure 15) that includes 95% of the stars in our target galaxies. The same completeness region is applied to the CMD’s taken from the Extragalactic Distance Database (EDD, Jacobs et al. 2009) and to the synthetic CMD’s generated from IAC-STAR. Thus, it is important to remember that the fractional values quoted in the following discussions do not represent the percentages with respect to the entire galaxy stellar population. They only refer to the completeness region although an extrapolation to the total population could be made with some simple assumptions to the distribution of faint stars.
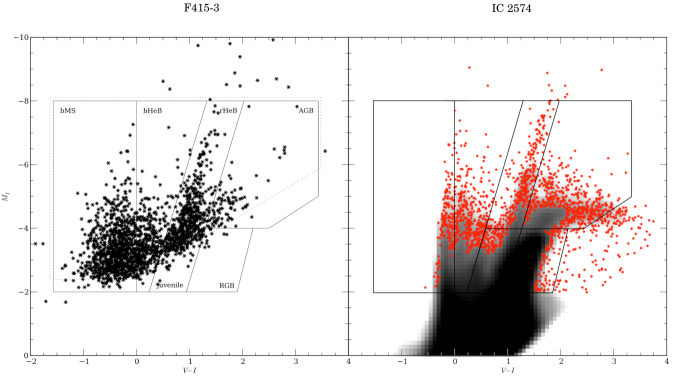
While the depth of the CMD’s for our three LSB galaxies does not approach the depth of other CMD studies in galaxies (i.e., a main sequence and turnoff, Jacobs et al. 2009), a clear red helium-burning sequence (rHeB) is visible as well as the top of the blue main sequence (bMS, also called the blue plume) along with a significant intermediate age AGB population (see Figure 15). The rHeB branch is of particular interest for it only develops in metal-poor populations ([Fe/H] ) and the number of stars along the branch is a direct measure of the star formation rate for the last 100 Myrs (see §2.8). The stars in the bMS are consistent with a young, high mass OB star population, the stars responsible for the low level H emission in LSB galaxies. All the stars found in F814W () are detected in F555W () with the exception of five stars. These five stars are detected in F814W between and 6, but not visible in F555W. This predicts their colors are greater than 2, typical of extreme AGB stars. The bHeB population is poorly defined in , but is clearer in (see §2.9).
The LSB CMD’s mostly closely resemble the CMD’s of LV starburst dwarfs from McQuinn et al. (2010) and the ANGST survey (Dalcanton et al. 2009) (comparison CMD’s can be found at the Extragalactic Distance Database, Jacobs et al. 2009). In particular, the morphology of the CMD in our LSB sample closely resembles the morphology of the CMD from IC 2574 (McQuinn et al. 2010), one of the faintest (and lowest metallicity) of their sample. A comparison between F415-3 and IC 2574 CMD’s is seen in Figure 15 where the IC 2574 data contains 158,000 stars and, thus, is displayed using a logarithmic Hess diagram overlayed with individual datapoints in the CMD regions of low density. Regions of particular interest in the star formation history are marked. As can be seen in Figure 15, the dwarfs in the EDD catalog display all the CMD features for stellar populations with a range of ages, such as a blue main sequence, an old red giant branch (divided by the tip of the RGB at ), blue and red helium-burning sequences (bHeB and rHeB), a red clump (RC) and an asymptotic giant branch (AGB). Features in common with F415-3 are a distinct rHeB branch and AGB population. A bMS is evident in both galaxies, but that feature in F415-3 is broader due to increased photometric errors near the completion limit. We note that the LSB galaxies in our sample have very little resolution of the old RGB populations. Several bMS tracks are visible in IC 2574, indicating bursts of star formation on timescales of 10 Myrs. Similar features are not seen in F415-3, probably due to small number statistics.
2.7 CMD Morphology
Using the CMD regions defined in Figure 13, we can classify the CMD morphologies of existing HST samples from the EDD (Jacobs et al. 2009) for comparison with our LSB galaxies. We have divided the existing CMD samples from EDD into young (CMD’s with a clear rHeB branches and strong AGB populations, such as IC 2574) and old (ones lacking a rHeB branch, but may have a weak bMS populations). Examples of old morphologies are DDO 44, DDO 71 and ESO 294-010 from the ANGST survey. In all, 57 CMD’s were extracted from the HST archives and the EDD website, 45 classified as young and 12 classified as old.
Each CMD of the three LSB galaxies in our sample, is analyzed by calculating the number of stars in the six population regions outlined in Figure 13. The population percentages are displayed as histogram in Figure 16. The percentage of bMS stars varied from only a few percent for old dwarfs (e.g. DDO 44) to over 40% for dwarfs such as NGC 3077 and UGC 5336. The galaxies with strong rHeB branches have bMS populations that vary between 10 and 40%, indicating a connection between the two features but the bMS being more sensitive to very recent SF. For example, the fraction of stars in the rHeB branch ranges between 10 and 20% of the population, regardless of the fraction of bMS stars, due to the fact that the bMS fraction varies on very short timescales. The old dwarfs in the EDD sample display strong RGB fractions and weak bMS and rHeB branches. Both young and old EDD dwarfs have similar AGB fractions (suggesting their primary differences is due to their star formation rates over the last Gyr). The galaxies without prominent rHeB branches display the highest concentrations of RGB stars in the completeness region, reinforcing the interpretation that old dwarfs, while often having some current star formation, produced most of their stars over 5 Gyrs ago.
Young dwarfs typical have strong bMS, bHeB and rHeB populations (McQuinn et al. 2010) which would agree with the fact that their current SFR (based on H values) exceeds the mean past SFR based on dividing their stellar mass by 12 Gyrs (i.e., SFR, see §3.2). Increasing importance of the bMS stars in young dwarf CMD’s reflects into decreasing percentages of RGB stars, i.e., star formation has continued to recent epochs. The constant fraction of rHeB stars indicates that the bursts of star formation responsible for the bMS population are fairly evenly spacing on timescales of 100 to 200 Myrs.
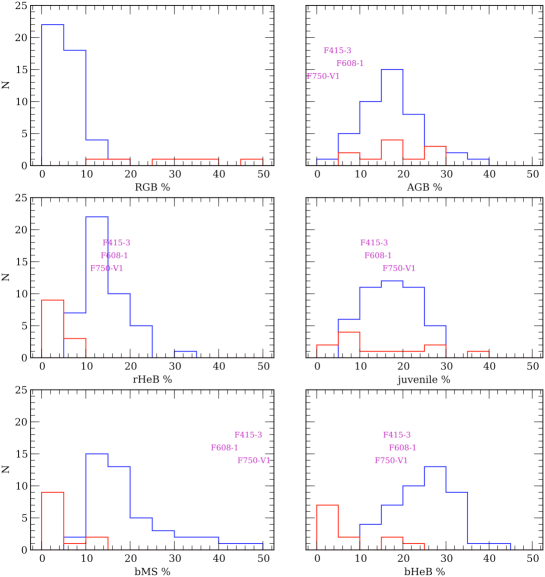
The three LSB galaxies in our sample distinguish themselves from the young dwarfs by having weaker AGB fractions and stronger bMS fractions. The LSB galaxies also have weaker juvenile and RGB fractions; however, the RGB region is undersampled and, even when we apply the same completeness boundaries to all the CMDs, we are hesitant to draw strong conclusions from this trend. The LSB galaxies have similar bHeB and rHeB branch fractions with the star-forming EDD dwarfs, which samples the Gyr timescale of star formation.
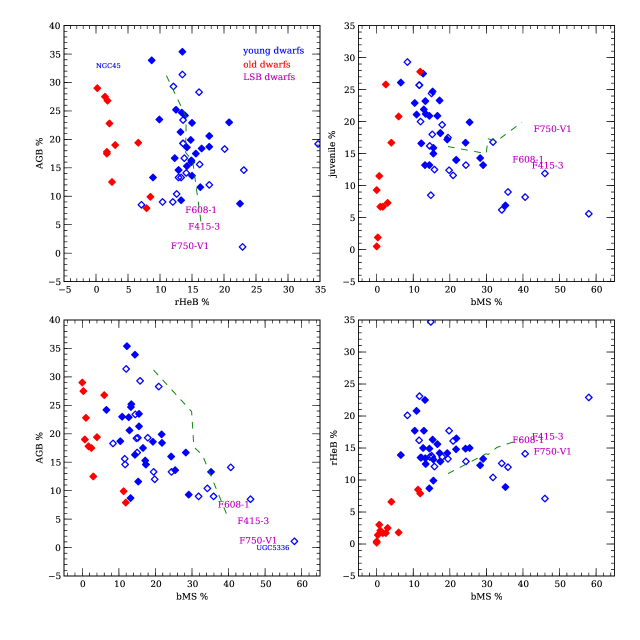
The difference in young and old populations can be seen more clearly in Figure 17, a comparison of the fraction of bMS, rHeB, juvenile and AGB stars. Old dwarves were selected by an absence of a distinct rHeB branch, so their low values are unsurprising. They typically, also, have very weak bMS, bHeB and rHeB populations, signaling very low rates of star formation over the last Gyr. Old dwarfs display a range of juvenile and AGB fractions (anti-correlated), suggesting a continuum driven by a star formation history of increasing SFR from the young to old dwarfs.
Even though AGB’s are a measure of intermediate age stars, there is a strong anti-correlation between the bMS and the AGB fraction (bottom left panel of Figure 17. We see the dominance of AGB stars in the older CMD’s, but the trend of decreasing AGB populations with increasing bMS populations is also evident in the young CMD’s. As the AGB stars sample intermediate timescales (3 to 8 Gyrs), then we, again, see a trend of increasing star formation from intermediate ages (although strict interpretation requires comparison to synthetic CMDs, see §2.6). The ratio of AGB to RGB stars (not shown) increases with larger AGB populations to a maximum of approximately 20%. The linear behavior of the AGB to RGB relation for young dwarfs may signal a late initial star formation epoch, in agreement with their higher current SFRs compared to their past mean rates.
All three LSB galaxies in our sample have CMD morphologies at the extreme edges of other dwarf CMD’s. Our LSB galaxies CMD’s typically have stronger very young components (i.e., bMS) with a mean of 45% compared to the LV dwarf mean value of 20%. The dominance of the bMS population comes as no surprise due to the extremely blue colors for most LSB galaxies. And while their HSB cousins also have blue star-forming colors, those colors are typically restricted to the bright star-forming regions. LSB galaxies are unique in that even the regions between the few higher surface brightness knots are blue in optical colors (Schombert, Maciel & McGaugh 2011). The widely dispersed, and predominately blue, stellar population are responsible for this effect.
LSB galaxies also have weaker intermediate aged components, with the AGB fraction at 5% compared to the LV dwarf values between 10 and 30%. The interpretation here is that the current SFR is much higher than the SFR over the last 5 Gyrs, although this is not supported by the mean past SFR (SFR) as estimated by the current stellar mass divided by a Hubble time. The AGB fraction is metallicity dependent (see Figure 14), however, for the estimated [Fe/H] of our LSB sample (between 1.0 and 0.6) the AGB fraction should be greater than the higher metallicity LV dwarfs.
The RGB population in LSB galaxies also deficient compared to old LV dwarfs, but young LV dwarfs have RGB fractions below 10% so this comparison is difficult. Also, the conclusions concerning the Gyrs populations in our LSB galaxies are less secure due to the lack of complete resolution of the old RGB in our CMD’s. We deduce the crude characteristics of old stars in LSB’s based on this limited resolution plus the fact that the chemical evolution requires some older population in order to produce even the low [Fe/H] values measured with the rHeB populations (see §2.8 and Villegas et al. 2008). In addition, the pixel-by-pixel surface surface brightness characteristics (see §2.3) also match the expectations for an underlying normal older population.
Given these limitations, the three LSB galaxies still have very low AGB fractions. Their rHeB branch fractions are similar to other young dwarfs (although all star-forming dwarfs have rHeB fractions near 10%). A more telling diagnostic is the ratio of AGB to bMS for LSB galaxies. While most young, blue dwarfs have an AGB population in proportion to their bMS populations, the three LSB galaxies have significantly higher bMS and bHeB populations compared to the AGB populations. This is particularly significant since the fraction of AGB’s increases with decreasing metallicity (based on comparison to synthetic CMD’s) and both LSB and young dwarfs display the opposite trend. Either the star formation rate in LSB’s has suddenly increased in the last Gyr (i.e. the current epoch is a special time) or the past star formation rates of LSB have long been inhibited, perhaps an explanation for their LSB nature as a whole.
2.8 Recent SF and [Fe/H] from the rHeB Branch
The mapping of the most recent star formation has the advantage that the youngest stars have positions on the CMD that are most easily distinguished from other aged populations. In particular, stars with ages less than 100 Myrs are the domain of the bMS, bHeB and rHeB branches (McQuinn et al. 2012). Figure 18 displays a breakdown of these three young phases of the CMD from a IAC-STAR simulation by age, color and luminosity. Note that a cut by will isolate all stars younger than years old. The timescale between and years is represented by the bHeB and rHeB branches. A star will oscillate between the two branches, with the younger stars at higher luminosities. However, the rHeB branch is much easier to distinguish from the bHeB branch due to confusion in the CMD between bMS and bHeB stars (however; these two branches are separated in color, see §2.9) . In addition, stars on the rHeB branch display a strong correlation between age and luminosity (see right panel, Figure 18). This provides a simple, and direct, measurement of star formation between and .
The linear relation between absolute luminosity and age for rHeB branch stars (see Figure 18) allows the distribution of rHeB branch stars on the CMD to be compared with various star formation histories. For example, in Figure 19, the averaged distribution of blue LV dwarfs is compared to an IAC-STAR synthetic CMD using a constant SFR (the results were independent of metallicity). The mean star formation history for young dwarfs is slightly higher for ages greater than 50 Myrs and slightly lower for younger populations, although the range for all LV dwarfs is consistent with approximately constant SF for the last 200 Myrs.
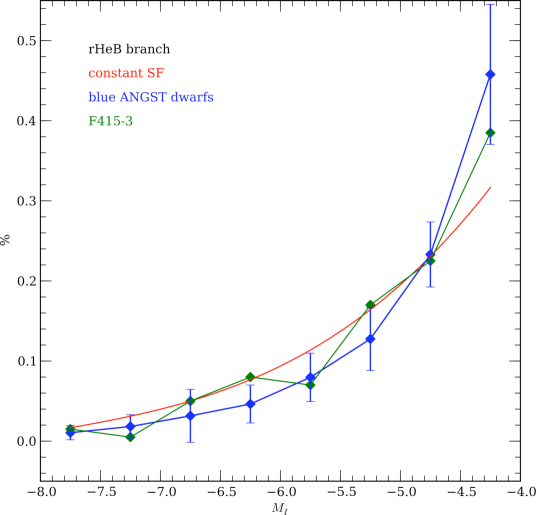
The SF history of F415-3 (our LSB with the best sampling of the rHeB branch) is similar to other young LV dwarfs. F415-3 has a slightly lower SFR at 100 Myrs, rising to a constant SF by 50 Myrs. However, F415-3 is well within the distribution of SF histories of other young dwarfs, again, surprisingly considering the very different appearance of LSB dwarfs and LV dwarfs in terms of mean stellar density. If both types of galaxies have similar current SFR, then their differences lie in their intermediate and older populations, i.e., the mean past SFRs.
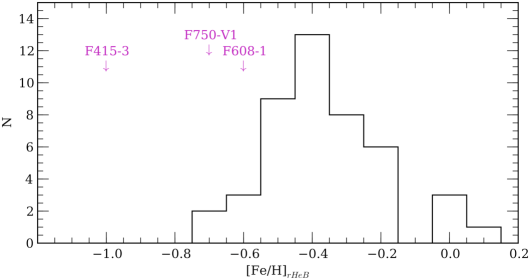
The current metallicity can also be extracted from the mean position of the rHeB branch. As can be seen in Figure 14, the rHeB branch moves redward with increasing [Fe/H]. Calibrating the position of the rHeB branch using synthetic CMD’s, we can assign a current metallicity to each CMD ([Fe/H]rHeB). The results are shown in Figure 20 where the histogram displays the deduced [Fe/H]rHeB values for 45 LV dwarfs with strong rHeB populations. The three LSB galaxies in our sample are also marked in Figure 20 with [Fe/H] values of 1.0, 0.6 and 0.7 respectfully. This places all three on the low end of the distribution, in line with a history of inhibited star formation and, therefore, a suppressed chemical evolutionary path. This is also in agreement with the typical oxygen abundances deduced from LSB emission lines (McGaugh 1994).
2.9 CMDs
The bMS region of a CMD is relatively insensitive to metallicity effects as increasing metallicity primarily lowers the peak luminosity of the brightest O stars, and the range of blue star absolute luminosity. Age dominates the position of the isochrones on the blue side in the versus diagram (see Figure 21). And, unsurprisingly, the bright portion of the blue branch of the CMD can only be explained by very young ( Myrs), metal-poor stars. A majority of the blue stars are concentrated along this young isochrone with only 10% have colors redder than 0.
Where the bMS and bHeB branches are blurred in the CMD due to photometric errors, the bHeB branch separates nicely in . Shown in the right panel of Figure 21 is an IAC-STAR simulation of a constant star formation, [Fe/H]= population. The colors, sampled by our survey, explore the stellar populations with ages less and 10 Myrs (i.e., very recent), and the ratio of the bMS versus bHeB regions is a measure of the fraction of 2 Myrs to 10 Myrs stars. Increasing metallicity will lower the fraction of bHeB stars (they become fainter and drop below the completeness line).
Using this CMD diagnostic, we find that the three LSB galaxies in our sample have bMS and bHeB fractions of 70% and 25% on average. Enhanced recent star formation predicts fractions of 85% and 10% for metal-poor populations. Constant star formation models predict 80% and 20%. This would suggest, as indicated in the previous section, that despite the large fraction of young stars (see Figure 17) this does not signal a sharp increase in the SFR in the last 50 Myrs. Rather, this is an indication that the past SFR has been inhibited such that the blue colors of LSB galaxies is from a suppressed old population, rather than a recent enhanced cycle of current SF.
3 Discussion
Although, due to the distance to our LSB galaxies, their CMD’s to not reach to absolute limiting magnitudes comparable to other LV dwarfs, the LSB CMD’s have many of the same CMD features that LV dwarfs display. In particular, strong signatures of recent star formation with numerous OB stars, very low current [Fe/H] values as deduced by the position of the rHeB population and a measurable deficiency of intermediate age AGB stars (compared to LV dwarfs).
Our analysis can be divided into three sections; 1) pure observables from the spatial and color distribution of the LSB CMD’s, 2) empirical comparison to CMD’s in other dwarf galaxies and 3) examination of the results from comparison to synthetic CMD simulations.
3.1 H emission and Mean Surface Brightness
The clearest result from HST stellar photometry of our three LSB galaxies is the significant one-to-one correspondence between the types and luminosity of the resolved stars and global features such as local surface brightness, local color and H emission. While this was not unexpected, it is direct confirmation that the same star formation processes that dominates normal spirals and irregulars are also found in LSB galaxies (Helmboldt et al. 2009).
For every HII region identified in Schombert, McGaugh & Maciel (2013) there exists at least one, often several, stars with colors less than 1. In addition, the brighter the HII region, the brighter the ionizing stars. Several groupings are identified without H emission (also identified in ground-based imaging as surface brightness knots) and these regions have a higher fraction of rHeB stars, i.e. older than 10 Myrs stars and non-ionizing. The connection between bright OB stars and ionized gas confirms that star formation in LSB galaxies proceeds in the same fashion as normal spirals and irregulars, i.e., collapse of a gas cloud, star cluster formation, massive star gas ionization followed by gas blowout. There is no support of earlier speculation that LSB galaxies form stars without massive stars (Meurer et al. 2009; Dopcke et al. 2013) nor that H emission in LSB galaxies is due to an exotic ionizing population (e.g., blue HB stars or hot white dwarfs).
In addition, the local colors (optical and near-IR) are in direct correspondence with the colors and luminosity of the local brightest stars. Regions that are blue in mean color are also rich in blue stars. High surface brightness regions are also dominated by the brightest stars (both blue and red). Blue regions with low mean surface brightness have an excess of faint, widely dispersed bMS and bHeB stars suggesting strong kinematic mixing on short timescales in LSB galaxies. This is in agreement with typical gas velocity dispersion estimates of 8 km/sec (Kuzio de Naray et al. 2006) that corresponds to stellar motions of 5 pc per Myr, most than sufficient to scatter O stars from their original regions of intense star formation.
Lastly, the total luminosity of the resolved population is roughly 10% of the total luminosity of the galaxy. This agrees with the estimates from simulations of synthetic CMD’s, where the ratio between the completeness region and the fainter stars was between 5 and 20%, highly variable due to small number statistics of the brightest stars. In addition, the stellar counts per pc2 are in excellent agreement with the local mean surface brightnesses when scaled to the total luminosity of the galaxy (see Figure 6). This implies there are no hidden stellar populations in LSB galaxies, the resolved bright stars trace the same structure as the underlying stellar contribution. As suspected from the lack of CO and far-IR detections, LSB have almost no extinction or significant absorption over the scale sizes of the large star-forming regions (Lynn et al. 2005; Hinz et al. 2007).
The difference between the lowest surface brightness regions and the higher surface brightness knots is due primarily to the brightest blue stars. There are numerous B stars in low surface brightness regions indicating that their ages differ only by a few tens of Myrs from the bright cluster regions. In other words, there are no distinct old regions in LSB galaxies, strong mixing with the star forming regions is implied or there are simply no obvious regions with stars older than 5 Gyrs, in conflict with the observed chemical evolution.
3.2 Comparison to LV dwarfs CMDs
The CMD has been explored for dozens of LV dwarf galaxies, some as deep as the turn-off point, but all fainter than the limiting magnitude of our three LSB galaxies. The CMD features of LV dwarfs varies widely as their star formation histories range from very little recent star formation (e.g., IC 3104 and DDO88) to galaxies with a full range of main sequence, post-main sequence, RGB and post-RGB features. In terms of general features, our best CMD in F415-3 contains all the same CMD features as those in LV dwarfs such as IC 2574 (see Figure 15). In particular, we observe the bMS, bHeB, rHeB and AGB populations. Our CMD’s do not extend significantly below the tip of the RGB to fully sample the red clump or lower RGB populations.
Compared to 57 LV dwarf CMD’s, we find that the fraction of bMS stars is much higher in our LSB galaxies than LV dwarfs. Star forming LV dwarfs have bMS fractions between 5 and 20%, whereas LSB galaxies have bMS fractions greater than 30% (see Figure 16). Despite the high fraction of bright blue stars, the total numbers are in agreement with H fluxes. For example, in F415-3, log is 38.5, which is the equivalent to a cluster slightly larger than cluster. With a normal IMF, this population would have between 800 and 1,000 stars brighter than . In F415-3, there are 850 stars brighter than this luminosity, which we interpret that there is nothing particularly unusual on the upper end of the IMF in LSB galaxies. This is in agreement with the one-to-one correspondence found between H emission and the ionizing population in LV dwarfs (McQuinn et al. 2010), but in contradiction with the observations of Meurer et al. (2009) who found a deficiency in the upper mass of the IMF for LSB galaxies (see also Lee et al. 2004).
However, this high bMS fraction must be reconciled with the extremely low SFR rates for LSB galaxies, typically less than per yr. Since the current SFR is low, the only way to produce a high bMS fraction is to suppress the fraction of stars in the older populations. In other words, the stellar population in LSB galaxies appear to be predominately very young with an underpopulated stellar population older than 2 to 3 Gyrs.
This is confirmed by the fraction of AGB stars in LSB galaxies, a measure of intermediate age populations. For LV dwarfs, the fraction of AGB stars ranges from 20 to 30% for non-star forming dwarfs to 10% for star forming dwarfs. The LSB galaxies have AGB fractions below 10%, indicating a much lower SFR in the distant past which, of course, is in agreement with their abnormally low stellar densities. This is even a more abnormal fraction for the LSB galaxies in our study are particularly low in [Fe/H], which should strengthen the AGB population fraction. Thus, the abnormally blue colors of LSB galaxies is due as much to an absence of old red stars as much as an overabundance of young blue stars.
There is very little evidence of any stellar population older than 5 Gyrs; however, our data does not sample the RGB where these stars would lie in the CMD. A unusually low fraction of older stars is deduced from the lack of their color signatures in broadband imaging (Pildis, Schombert & Eder 1997) and the close correspondence between the resolved stars and the underlying colors. Some older population must exist for the metallicity values, while low, imply the existence of some earlier enriching stars (see below and, for example, old globular clusters are found in large LSB galaxies, Villegas et al. 2009).
While a high fraction of bMS and rHeB stars implies either recent surge of SFR or a highly suppressed SFR in the past, these conclusions uncomfortably imply that we live in a special epoch with respect to the star formation history of LSB galaxies. That is, we are seeing their first epochs of increasing star formation from a large reservoir of gas reserves. This is possible, as our sample size is small and selected from a survey of blue PSS-II plates. However, more likely, either due to internal or external inhibitors, we are seeing a global history of steady, but very slowly increasing star formation where surface brightness is an aftereffect of a very low, past total star formation rate. Once a galaxy has achieved a certain value of SF per pc2, the mean surface brightness of the galaxy exceeds a visibility threshold, the galaxy becomes detectable for our surveys and catalogs. Confirmation of this idea would be the detection of numerous pure-HI systems with very little past star formation and, therefore, extremely low surface brightness (Davies et al. 2004).
3.3 Comparison to Synthetic CMDs
To extract the star formation and chemical evolution history from CMD’s one must make statistical comparisons to artificial CMD’s generated with known metallicity and SFRs as a function of population age. Several examples are shown in Figure 14. The two regions where comparison to synthetic CMD’s is most informative is the rHeB (see §2.8) and the CMD (as there are very few CMD’s in the literature).
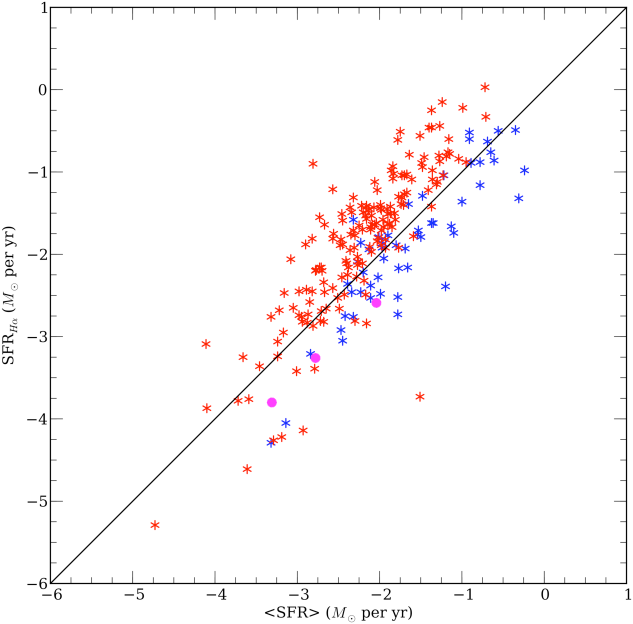
The results we deduce from the rHeB region is that LSBs have very nearly constant SF for the past 108 years, slightly stronger than the typical LV dwarf, but well within the range of recent SFR for LV dwarfs of a range of surface brightnesses. We note that although the star formation has been nearly constant, this constant rate is still at extremely low absolute levels. Proposing even lower SFRs in the past is in conflict with the deduced mean SFR from the stellar mass of HSB and LSB galaxies. For comparison, Figure 22 displays the current SFR in three samples of irregular galaxies (our LSB sample; van Zee 2001; Hunter & Elmegreen 2004) versus the stellar mass of each galaxies divided by 12 Gyrs (a measure of the mean SFR, SFR, in a galaxy where galaxy luminosity is converted to stellar mass with a M/L value. The M/L values used were deduced by McGaugh & Schombert (2015) modified for color following the prescription given in de Blok & McGaugh (1997) and varied, at most, from 0.4 to 0.6. Per unit mass, the LSB galaxies are typically a factor of ten lower in current SFR than other HSB irregulars. And their SFR values are typically higher than their current SFR values, indicating past rates that are higher than the current value (the unity line is shown in Figure 22 where most HSB irregulars are above the line and LSB galaxies are below the line).
The global properties of LSB galaxies (compared to HSB irregulars) are difficult to reconcile with the deficiency of AGB stars in our three LSB galaxies. While we lack resolution of truly old stars on the RGB, a deficiency in AGB stars with a deduced higher past SFRs from Figure 22 induces a contrived star formation history (one with an initial burst sufficient to produce most of the current stellar mass, then a long quiescent period, to a current epoch of slowly increasing SFR). While this may very well be the case, and is consistent with low stellar density distribution, the mechanism for this type of star formation history, given the stochastic appearance of current star formation, would require some external process to moderate the quiescent phases (McQuinn et al. 2015).
Second, the position of the rHeB sequence in the CMD is very sensitive to metallicity of the younger stars. Calibrating the position to [Fe/H] (using a standard enrichment scenario), we find the current [Fe/H] values for our three LSB galaxies are 1.0, 0.6 and 0.7 respectfully. This is on the low side for [Fe/H] of LV dwarfs by the same method (their mean value is 0.4). Given the assumption of lower past SFR’s in LSB galaxies compared to LV dwarfs, this is an unsurprising result and reflects the abnormally low current [Fe/H] values, i.e., the chemical history of LSB galaxies is strongly suppressed.
Lastly, the CMD allows for a comparison of the bMS and bHeB populations which are blurred in the CMD. The ratio of these populations, compared to synthetic CMD’s, confirms the result from the rHeB population, i.e., that the current SFR in LSB has been roughly constant for the last few 100 Myrs. Constant star formation is not a new conclusion for gas-rich galaxies (West et al. 2009; Hunter et al. 2011) and the bluest gas-rich galaxies require rising SFR to explain their global colors. Schombert & McGaugh (2014a) found that recent weak bursts on timescales of 500 Myrs would satisfy the colors of LSB galaxies, rather than a uniformly rising SFR (see also Boissier et al. 2003). It may be a coincidence that the three LSB galaxies in this sample display the rHeB population indicated the onset of a recent burst (thus, making them more visible in a blue oriented visual survey).
4 Summary
The results from the CMD’s of Local Volume dwarf galaxies has historically been a shockingly revelation on the stochastic and random nature to the star formation history in dwarf galaxies. The uniform nature of their global colors and H luminosities with mass (Hunter & Elmegreen 2004) is replaced with a highly variable history of brief, weak bursts. While our study lacks the luminosity depth and high number of resolved stellar sources to match the detail of most LV dwarfs CMD’s, the similarity between the CMD’s for LSB galaxies and LV dwarfs indicates that they have analogous recent star formation histories.
The primary difference between LV dwarfs and our LSB galaxies is the underpopulated older population ( 3 Gyrs), implied by the overabundance of young stars and, yet, a low current SFR. Most studies of LSB galaxies in the past have tested and dismissed various explanations for their LSB nature based on stellar population variations (extinction by dust, unusual IMF’s, exotic stellar populations). Whereas, this study indicates that that LSB are low in surface brightness simply because they have lower stellar densities due to a widely dispersed stellar population. In other words, they have fewer stars per pc2 than their HSB cousins, and that this underpopulation occurs with both recent and older stars. Their current and past star formation rates are typically a factor of ten less then their HSB cousins, which clearly reflects into their different mean surface brightness. However, a kinematic mechanism is required to disperse the younger stellar populations to maintain the uniform color mixing from high to low surface brightness regions within the LSB galaxies themselves.
This resurrects then idea that LSB galaxies are ”young” (Vorobyov et al. 2009; Gao et al. 2010), not necessarily young in their formation epoch, for their mean metallicities indicate some small amount of chemical evolution over the that last 10 Gyrs. Rather they are ”young” in the sense that a majority of their stars formed after 5 Gyrs (McGaugh & Bothun 1994; Jimenez et al. 1998; Schombert, McGaugh & Eder 2001), and their chemical history is the weakest of any galaxy type. We also note that the analysis of rHeB population in §2.8 opens a powerful technique to study galaxies outside the Local Volume out to 20 Mpc or more. There is a great deal of information in the resolved stellar populations brighter than , the canonical value for the tip of the RGB.
Ultimately, the conclusions from H and CMD studies is that star formation is suppressed in LSB galaxies. However, the dilemma exists on why should the SFR be so low in galaxies so rich in the neutral gas that is the fuel for star formation. The evidence points to the star formation efficiency as the difference between HSB and LSB galaxy types. While star formation has been directly linked to gas density (Kennicutt 1989), numerous secondary factors vary with surface brightness. For example, it has been shown that star formation efficiency decreases with surface brightness (Leroy et al. 2008) and driven in part by lower metallicities in the gas clouds (Shi et al. 2014). This results in a fluctuating (bursts) and a spatially irregular star formation history (McQuinn et al. 2015) such as seen in most LSB galaxies.
References
- Anderson & Baggett (2014) Anderson, J., & Baggett, S. 2014, Space Telescope WFC Instrument Science Report, 22
- Aparicio & Gallart (2004) Aparicio, A., & Gallart, C. 2004, AJ, 128, 1465
- Aparicio & Hidalgo (2009) Aparicio, A., & Hidalgo, S. L. 2009, AJ, 138, 558
- Asa’d & Hanson (2012) Asa’d, R. S., & Hanson, M. M. 2012, MNRAS, 419, 2116
- Bastian et al. (2009) Bastian, N., Gieles, M., Ercolano, B., & Gutermuth, R. 2009, MNRAS, 392, 868
- Bertelli et al. (1994) Bertelli, G., Bressan, A., Chiosi, C., Fagotto, F., & Nasi, E. 1994, A&AS, 106, 275
- Blanton & Roweis (2007) Blanton, M. R., & Roweis, S. 2007, AJ, 133, 734
- de Blok & McGaugh (1997) de Blok, W. J. G., & McGaugh, S. S. 1997, MNRAS, 290, 533
- Boissier et al. (2003) Boissier, S., Monnier Ragaigne, D., Prantzos, N., et al. 2003, MNRAS, 343, 653
- Boissier et al. (2008) Boissier, S., Gil de Paz, A., Boselli, A., et al. 2008, ApJ, 681, 244
- Dalcanton et al. (2009) Dalcanton, J. J., Williams, B. F., Seth, A. C., et al. 2009, ApJS, 183, 67
- Davies et al. (2004) Davies, J., Minchin, R., Sabatini, S., et al. 2004, MNRAS, 349, 922
- Dohm-Palmer et al. (2002) Dohm-Palmer, R. C., Skillman, E. D., Mateo, M., et al. 2002, AJ, 123, 813
- Dolphin (2002) Dolphin, A. 2002, HST Proposal, 9521
- Dopcke et al. (2013) Dopcke, G., Glover, S. C. O., Clark, P. C., & Klessen, R. S. 2013, ApJ, 766, 103
- Eder & Schombert (2000) Eder, J. A., & Schombert, J. M. 2000, ApJS, 131, 47
- Galaz et al. (2011) Galaz, G., Herrera-Camus, R., Garcia-Lambas, D., & Padilla, N. 2011, ApJ, 728, 74
- Gallart et al. (1996) Gallart, C., Aparicio, A., & Bertelli, G. 1996, From Stars to Galaxies: the Impact of Stellar Physics on Galaxy Evolution, 98, 339
- Hayward et al. (2005) Hayward, C. C., Irwin, J. A., & Bregman, J. N. 2005, ApJ, 635, 827
- Gallart et al. (2005) Gallart, C., Zoccali, M., & Aparicio, A. 2005, ARA&A, 43, 387
- Gao et al. (2010) Gao, D., Liang, Y.-C., Liu, S.-F., et al. 2010, Research in Astronomy and Astrophysics, 10, 1223
- Geha et al. (2006) Geha, M., Blanton, M. R., Masjedi, M., & West, A. A. 2006, ApJ, 653, 240
- Gould et al. (1993) Gould, A., Bahcall, J. N., & Maoz, D. 1993, ApJS, 88, 53
- Helmboldt et al. (2009) Helmboldt, J. F., Walterbos, R. A. M., Bothun, G. D., O’Neil, K., & Oey, M. S. 2009, MNRAS, 393, 478
- Hinz et al. (2007) Hinz, J. L., Rieke, M. J., Rieke, G. H., et al. 2007, ApJ, 663, 895
- Holtzman et al. (1999) Holtzman, J. A., Gallagher, J. S., III, Cole, A. A., et al. 1999, AJ, 118, 2262
- Huang et al. (2014) Huang, S., Haynes, M. P., Giovanelli, R., et al. 2014, ApJ, 793, 40
- Hunter & Elmegreen (2004) Hunter, D. A., & Elmegreen, B. G. 2004, AJ, 128, 2170
- Hunter et al. (2011) Hunter, D. A., Elmegreen, B. G., Oh, S.-H., et al. 2011, AJ, 142, 121
- Jacobs et al. (2009) Jacobs, B. A., Rizzi, L., Tully, R. B., et al. 2009, AJ, 138, 332
- Jimenez et al. (1998) Jimenez, R., Padoan, P., Matteucci, F., & Heavens, A. F. 1998, MNRAS, 299, 123
- Kennicutt (1989) Kennicutt, R. C., Jr. 1989, ApJ, 344, 685
- Kuzio de Naray et al. (2004) Kuzio de Naray, R., McGaugh, S. S., & de Blok, W. J. G. 2004, MNRAS, 355, 887
- Kuzio de Naray et al. (2006) Kuzio de Naray, R., McGaugh, S. S., de Blok, W. J. G., & Bosma, A. 2006, ApJS, 165, 461
- Kuzio de Naray et al. (2009) Kuzio de Naray, R., McGaugh, S. S., & Mihos, J. C. 2009, ApJ, 692, 1321
- Lapenna et al. (2012) Lapenna, E., Mucciarelli, A., Origlia, L., & Ferraro, F. R. 2012, ApJ, 761, 33
- Lee et al. (2004) Lee, H.-c., Gibson, B. K., Flynn, C., Kawata, D., & Beasley, M. A. 2004, MNRAS, 353, 113
- Leroy et al. (2008) Leroy, A. K., Walter, F., Brinks, E., et al. 2008, AJ, 136, 2782
- Matthews et al. (2005) Matthews, L. D., Gao, Y., Uson, J. M., & Combes, F. 2005, AJ, 129, 1849
- McGaugh (1994) McGaugh, S. S. 1994, ApJ, 426, 135
- McGaugh & Bothun (1994) McGaugh, S. S., & Bothun, G. D. 1994, AJ, 107, 530
- McGaugh & de Blok (1997) McGaugh, S. S., & de Blok, W. J. G. 1997, ApJ, 481, 689
- McGaugh & Schombert (2015) McGaugh, S. S., & Schombert, J. M. 2015, ApJ, 802, 18
- McQuinn et al. (2010) McQuinn, K. B. W., Skillman, E. D., Cannon, J. M., et al. 2010, ApJ, 721, 297
- McQuinn et al. (2012) McQuinn, K. B. W., Skillman, E. D., Dalcanton, J. J., et al. 2012, ApJ, 759, 77
- McQuinn et al. (2015) McQuinn, K. B. W., Cannon, J. M., Dolphin, A. E., et al. 2015, arXiv:1501.07313
- Meurer et al. (2009) Meurer, G. R., Wong, O. I., Kim, J. H., et al. 2009, ApJ, 695, 765
- Mighell (1997) Mighell, K. J. 1997, AJ, 114, 1458
- Pietrinferni et al. (2004) Pietrinferni, A., Cassisi, S., Salaris, M., & Castelli, F. 2004, ApJ, 612, 168
- Pildis et al. (1997) Pildis, R. A., Schombert, J. M., & Eder, A. 1997, ApJ, 481, 157
- Rakos & Schombert (2004) Rakos, K., & Schombert, J. 2004, AJ, 127, 1502
- Rakos & Schombert (2005) Rakos, K., & Schombert, J. 2005, PASP, 117, 245
- Rosenbaum & Bomans (2004) Rosenbaum, S. D., & Bomans, D. J. 2004, A&A, 422, L5
- Sánchez-Blázquez et al. (2006) Sánchez-Blázquez, P., Gorgas, J., Cardiel, N., & González, J. J. 2006, A&A, 457, 787
- Schlafly & Finkbeiner (2011) Schlafly, E. F., & Finkbeiner, D. P. 2011, ApJ, 737, 103
- Schombert et al. (1990) Schombert, J. M., Bothun, G. D., Impey, C. D., & Mundy, L. G. 1990, AJ, 100, 1523
- Schombert et al. (1992) Schombert, J. M., Bothun, G. D., Schneider, S. E., & McGaugh, S. S. 1992, AJ, 103, 1107
- Schombert et al. (1997) Schombert, J. M., Pildis, R. A., & Eder, J. A. 1997, ApJS, 111, 233
- Schombert et al. (2001) Schombert, J. M., McGaugh, S. S., & Eder, J. A. 2001, AJ, 121, 2420
- Schombert et al. (2011) Schombert, J., Maciel, T., & McGaugh, S. 2011, Advances in Astronomy, 2011, 143698
- Schombert et al. (2013) Schombert, J., McGaugh, S., & Maciel, T. 2013, AJ, 146, 41
- Schombert & McGaugh (2014a) Schombert, J., & McGaugh, S. 2014, PASA, 31, e036
- Schombert & McGaugh (2014b) Schombert, J. M., & McGaugh, S. 2014, PASA, 31, e011
- Shi et al. (2014) Shi, Y., Armus, L., Helou, G., et al. 2014, Nature, 514, 335
- Tosi et al. (2001) Tosi, M., Sabbi, E., Bellazzini, M., et al. 2001, AJ, 122, 1271
- Tully et al. (2009) Tully, R. B., Rizzi, L., Shaya, E. J., et al. 2009, AJ, 138, 323
- van Dokkum et al. (2015) van Dokkum, P. G., Abraham, R., Merritt, A., et al. 2015, ApJ, 798, LL45
- van Zee (2001) van Zee, L. 2001, AJ, 121, 2003
- Villegas et al. (2008) Villegas, D., Kissler-Patig, M., Jordán, A., Goudfrooij, P., & Zwaan, M. 2008, AJ, 135, 467
- Vorobyov et al. (2009) Vorobyov, E. I., Shchekinov, Y., Bizyaev, D., Bomans, D., & Dettmar, R.-J. 2009, A&A, 505, 483
- West et al. (2009) West, A. A., Garcia-Appadoo, D. A., Dalcanton, J. J., et al. 2009, AJ, 138, 796
- West et al. (2009) West, A. A., Garcia-Appadoo, D. A., Dalcanton, J. J., et al. 2009, AJ, 138, 796
- Williams & Hodge (2001) Williams, B. F., & Hodge, P. W. 2001, ApJ, 559, 851
| Object | Distance | log | log | log | |||||
|---|---|---|---|---|---|---|---|---|---|
| (Mpc) | (V) | (kpc) | (ergs s-1) | () | () | ||||
| F415-3 (UGC 2017) | 10.4 | -15.2 | 0.52 | 22.8 | 0.7 | 38.5 | 8.04 | 8.65 | 0.80 |
| F608-1 (UGC 159) | 9.0 | -13.5 | 0.50 | 23.7 | 0.4 | 37.8 | 7.30 | 7.73 | 0.73 |
| F750-V1 | 8.0 | -12.7 | 0.32 | 22.7 | 0.2 | 37.3 | 6.77 | 7.14 | 0.70 |