ALMA Observations of the Largest Proto-Planetary Disk in the Orion Nebula, 114-426: A CO Silhouette
Abstract
We present ALMA observations of the largest protoplanetary disk in the Orion Nebula, 114-426. Detectable 345 GHz (856 m) dust continuum is produced only in the 350 AU central region of the 1000 AU diameter silhouette seen against the bright H background in HST images. Assuming optically thin dust emission at 345 GHz, a gas-to-dust ratio of 100, and a grain temperature of 20 K, the disk gas-mass is estimated to be 3.10.6 Jupiter masses. If most solids and ices have have been incorporated into large grains, however, this value is a lower limit. The disk is not detected in dense-gas tracers such as HCO+ J=43, HCN J=43, or CS =76. These results may indicate that the 114-426 disk is evolved and depleted in some light organic compounds found in molecular clouds. The CO J=32 line is seen in absorption against the bright 50 to 80 K background of the Orion A molecular cloud over the full spatial extent and a little beyond the dust continuum emission. The CO absorption reaches a depth of 27 K below the background CO emission at VLSR 6.7 km s-1 0.52″ (210 AU) northeast and 12 K below the background CO emission at VLSR 9.7 km s-1 0.34″ (140 AU) southwest of the suspected location of the central star, implying that the embedded star has a mass less than 1 M⊙.
1 Introduction
The Orion Nebula contains over a thousand low-mass young stars, many of which are surrounded by protoplanetary disks (O’Dell 2001). UV radiation from the massive Trapezium stars is photo-ablating these disks to produce several hundred proplyds with comet-shaped, ionized skins seen in H and visual-wavelength forbidden emission-line images (O’Dell & Wen 1994; Bally et al. 2000). In addition to these bright proplyds, the Nebula contains several dozen disks seen in silhouette against the bright background of nebular light. The absence of detectable emission lines from some silhouettes suggests that they are either located far from the Orion Nebula’s ionizing stars or completely outside the H ii region in the foreground.
With a major axis diameter of 2.3″, or 950 AU at a distance of 414 pc (Menten et al. 2007), the 114-426 disk is the largest silhouette in the Orion Nebula (McCaughrean & O’Dell 1996). Throop et al. (2001) found that the translucent, northeastern rim has grey extinction to a wavelength of about 2 m implying that grains with sizes of about 1 m or a little less dominate the extinction. Reddening between 1.87 m and 4.05 m, however, suggests that most of the obscuration is produced by grains smaller than 4 m (Shuping et al. 2003). Miotello et al. (2012) argued that despite being a silhouette, UV-induced photo-evaporation of the disk (Johnstone et al. 1998) may be responsible for its apparent warp, the translucent northeastern rim, and the large-bow shaped H arc 6″ to 10″ west of the disk (see Figure 1).
The nearly edge-on disk completely obscures its central star whose presence is indicated by a bipolar reflection nebula at visual and near-IR wavelengths. McCaughrean et al. (1998) used extinction of background nebular light to estimate a lower-bound of M⊙ for the mass of the 114-426 disk. They also used the flux of scattered light in the reflection nebula to infer the intrinsic K-band magnitude of the central star, m 9.5, and argued that it is likely to have a mass of 1.5 M⊙. The extinction to the star was used to argue for a disk mass larger than M⊙, higher than the lower bound based on extinction of nebular light. Multiple searches for dust continuum emission at mm and sub-mm wavelengths, however, have failed to detect emission (Bally et al. 1998; Williams et al. 2005; Eisner & Carpenter 2006; Eisner et al. 2008). Mann & Williams (2009, 2010) measured the dust masses of several dozen proplyds with the SMA interferometer, but failed to detect 114-426, placing a limit of M⊙ on the disk mass. Finally, Mann et al. (2014) detected the dust continuum at 856 m with ALMA, finding a disk mass of about 3.4 Jupiter masses ( M⊙).
In this paper, we present the ALMA observations of the 114-426 disk in four spectral lines and re-analyze the dust continuum in more detail than Mann et al. (2014). Having a diameter of 950 AU, 114-426 is the largest candidate protoplanetary disk seen in silhouette against the Orion Nebula. Nevertheless, the 856m continuum is confined to the inner 350 AU region. Remarkably, carbon monoxide, the only molecule detected in the 114-426 disk, is observed in absorption against the warm background CO emission from the Orion A molecular cloud. The central star’s mass is constrained by the disk rotation curve to be less than 1 M⊙. The observations show high-velocity CO emission 10″ north of 114-426, possibly associated with the HH 530 protostellar outflows in the Orion Nebula.
2 Observations
The data analyzed here were obtained with ALMA during Cycle 0 (ALMA project 2011.0.00028.S) on 24 October 2012 using twenty-two 12 m antennas, as part of a study of the Orion proplyds. Mann et al. (2014) present a detailed description of the observations and data reduction procedures. That paper also discusses the disk dust masses measured using the 856 m (350.0 GHz) dust continuum. In this paper, we present the molecular line data for the silhouette disk, 114-426. Four transitions were observed in ALMA Band 7; CO J=32, HCO+ J=43, HCN J=43, and CS J=76. Total on-source integration times were 1300 seconds, resulting in a continuum sensitivity of about 0.56 mJy per beam. The synthesized beam full-width at half-maximum (FWHM) size is 0.51″ (211 AU) 0.46″ (190 AU). At this frequency, 1 Jy corresponds to a brightness temperature of 42.8 K in the synthesized beam. The primary-beam field of view is 18″ and the maximum recoverable angular structure is about 5″ (2000 AU). The correlator was configured to observe four 1.875 GHz wide bands using a channel spacing of 488.28 kHz to yield 3840 channel spectra. After Hanning smoothing, the spectral resolution was = 976.56 kHz corresponding to a velocity resolution = 0.84 km s-1. The spectral line sensitivity of these observations is limited, presumably by over-resolved fluctuations in the spatial and radial velocity structure of the spectral-line emission from the background molecular cloud, to about 0.025 to 0.1 Jy beam-1 per Hanning-smoothed channel, or about 1 to 4 K per channel.
The reduced data were re-gridded to = 0.11″ per pixel. Each pixel value corresponds to the flux that would be measured by the ALMA synthesized beam at the pixel center. The number of square pixels with dimension in a circular aperture which has the same effective area on the sky as a Gaussian beam with a (circular) full-width-half-maximum = 0.485″ is given by 22.03 pixels111In terms of the FITS keywords , , , and , the quantity is given by . . Thus, the total flux in an aperture containing pixels is obtained by summing the pixel values in the aperture and dividing by .
3 Results
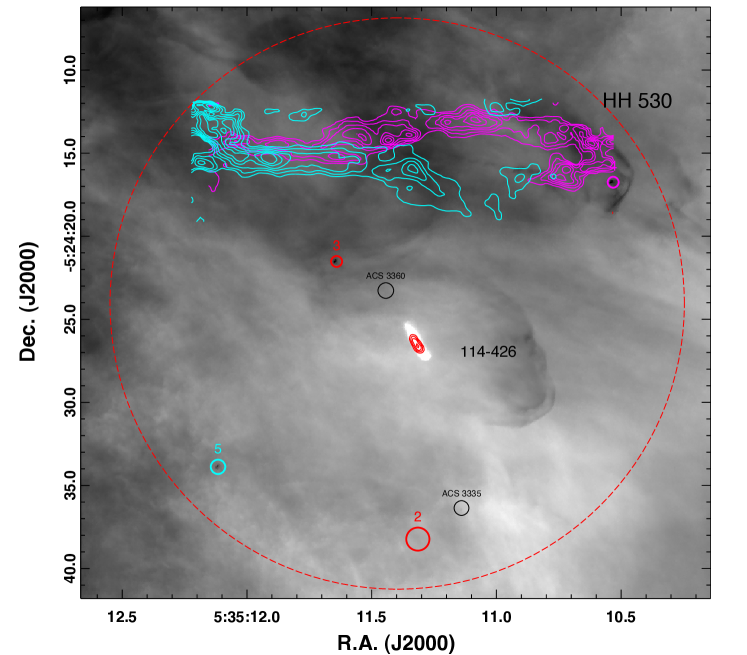
Figure 1 shows the field-of-view of the ALMA 856 m primary beam (large dashed circle) superimposed on a Hubble Space Telescope (HST) H image (Bally et al. 2006). Red contours show the dust continuum emission from the 114-426 disk on the visual wavelength silhouette. High-velocity CO emission from a background protostellar outflow suspected to be associated with Herbig-Haro (HH) object HH 530 is shown in cyan and magenta contours.
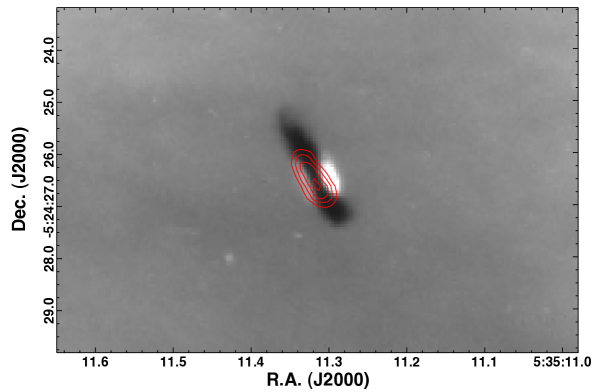
Figure 2 (top) shows a closeup of the disk in the F775W HST filter (Ricci et al. 2008; Robberto et al. 2013) with superimposed contours of 856 m continuum emission. The sub-millimeter dust emission has a major axis FWHM diameter of 1.110.05″, and a minor axis FWHM diameter of 0.530.05″. The beam de-convolved222The de-convolved major and minor axes were estimated by taking the square-root of the difference of the squares of the observed FWHM and beam FWHM. FWHM disk major and minor axis diameters are 1.0″ ( 414 AU) and less than 0.2″ (80 AU), implying that it is unresolved along its minor axis. Thus, the disk outer radius at 856 m is about 0.5″ (200 AU), more than a factor of two smaller than the visual wavelength radius of 475 AU. The peak flux, 4.2 mJy beam-1 is located at J2000 = 05:35:11.316, 5:24:26.62, coincident with the expected position of the central star based on the symmetry of the bipolar reflection nebula seen in the HST F775W filter image (Fig. 2). The area integrated flux in a 0.74″ by 1.55″ diameter elliptical aperture aligned with the disk major axis and centered on the emission is 6.00.6 mJy, 14% smaller than the 7 mJy flux reported by (Mann et al. 2014). The two flux measurements differ slightly because of variations in the size and shape of the measurement aperture combined with the presence of a low-amplitude negative bowl surrounding the continuum source. The disk mass is computed from the measured flux density, , the distance = 414 pc (Mann et al. 2014 used a distance of 400 pc), a grain emissivity = 0.034 (which assumes a gas-to-dust ratio of 100), and a grain temperature = 20 K, using the formula
where is the Planck function. Using these values, the disk mass is only 3.10.6 times the mass of Jupiter .
Williams & Best (2014) presented a parametric model for the estimation of disk gas masses using isotopologues of CO. They found that for nine disks they studied, the mass estimates based on the dust continuum flux using a standard gas-to-dust ratio of 100 were systematically higher than the masses based on CO isotopologues. Future ALMA observations of CO isotopologues should be obtained to test the validity of the assumptions used in converting the sub-millimeter continuum flux into a disk gas mass.
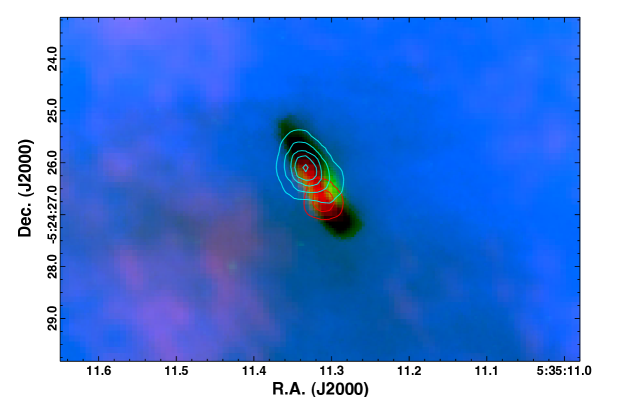
Remarkably, the 114-426 disk is seen in absorption in the ALMA 12CO J=32 images [Figures 2 (Bottom), 3, and 4 and Table 2]. The background CO emission from the Orion A cloud is bright. In the Nobeyama 45 meter 15″ telescope beam centered on 114-426, the 12CO J=10 emission has a brightness temperature above 50 K between VLSR = 5 to 10 km s-1 with a peak value of 82 K at VLSR = 8.0 km s-1 (Shimajiri et al. 2011, 2014)333 The Nobeyama data was downloaded from the NRO Star Formation Legacy Project website at http://th.nao.ac.jp/MEMBER/nakamrfm/sflefaqcy/image.html#orion. The IRAM 30-meter 12CO J=21 emission (Berne et al. 2014) shows peak temperatures of 6070 K and the APEX 12CO J=32 map (Peng et al. 2012) shows peak temperatures of around 70 K behind 114-426. 444Since we do not have access to these data in digital form, our analysis relies on extrapolation of the lower-lying transitions. These CO lines are optically thick as indicated by the high intensities of the 13CO and C18O lines at this location.
The ALMA interferometer filters-out structure on spatial scales larger than 5″ in the configuration that was used for these observations. Thus, the mean total power in each frequency channel is zero. Small-scale ( 5″) emission produces compact positive signals surrounded by extended (larger than 5″) negative bowls. Compact ( 5″) absorption features with amplitudes larger than the small-scale intensity variations in the background are retained in the maps as compact regions with negative values. In the velocity range occupied by the strong background emission, the CO intensity fluctuations in the ALMA data cube have a 1 rms of about 0.1 Jy or less (4 K) in apertures ranging in diameter from 0.5″ to 5″, less than 10% of the single-dish surface brightness in the background line core against which the CO absorption from 114-426 is seen, indicating that the background emission from the Orion A cloud is relatively smooth on these angular scales and does not contain intensity variations as large as the absorption signal from 114-426.
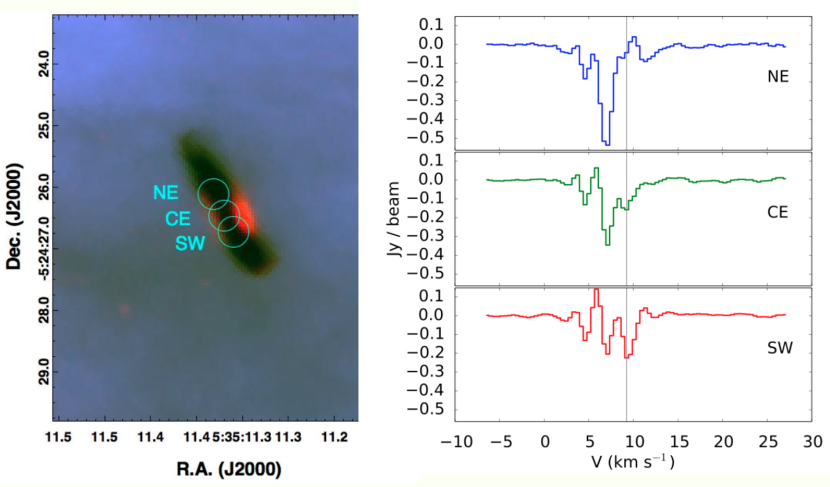
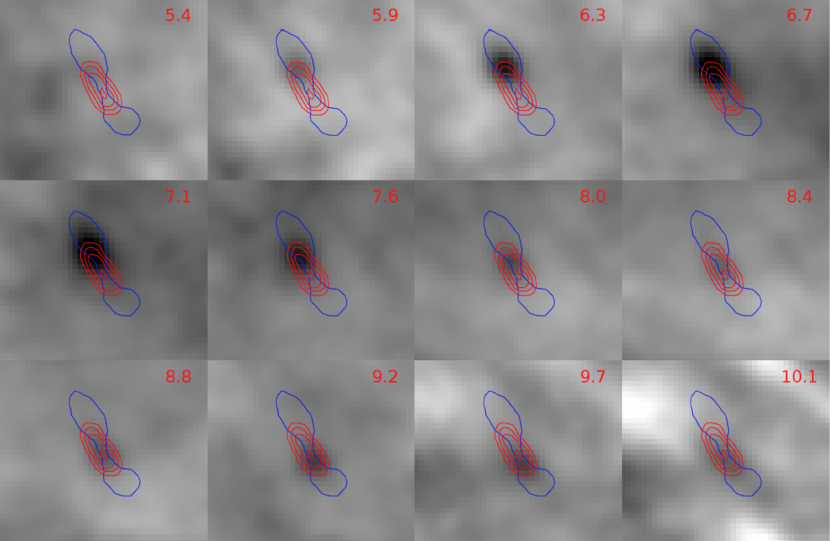
The northern portion of the 114-426 disk (as traced by dust-continuum) has the strongest CO absorption with a depth of 0.63 Jy beam-1. The southern lobe of the dust continuum disk has a CO absorption depth of 0.28 Jy beam-1 (Fig. 3). These flux deficits correspond to temperatures of 27 K and 12 K below the background CO emission. Table 2 lists the location of the deepest absorption as a function of radial velocity, the absorption depth in Janskys and degrees Kelvin, the extrapolated single dish data at the location of 114-426 interpolated to the radial-velocities of the ALMA data, and the ratio of the absorption divided by the estimated background CO temperature. Figure 4 shows the CO data cube (grey-scale) with the outline of the visual silhouette shown as a blue contour and the dust continuum emission shown in red contours. The spatial extent of the deepest, blue-shifted CO absorption from the northeast part of the disk appears to be wider than the 0.5″ synthesized ALMA beam and wider than the dust layer seen in the HST images, possibly indicating the presence of CO above and below the dust responsible for the visual-wavelength silhouette. The deepest absorption in the northern portion of the disk occurs at 6.70.15 km s-1. The deepest absorption in the southern portion of the disk occurs at 9.60.15 km s-1. The two deepest absorption peaks differ in radial velocity by V = 2.9 0.2 km s-1 and their centroids differ in position by X = 0.860.1″.
4 Discussion
The observed CO absorption can be affected by several factors including the optical depth, radial velocity, and temperature of the disk gas, beam dilution since the disk silhouette is thinner along its minor axis than the ALMA synthesized beam, and the brightness temperature distribution of the background emission as a function of radial velocity.
The projected 114-426 disk thickness varies from less than = 0.09″ to 0.43″ in the F775W image (Fig. 2). The smaller value, however, corresponds to only the foreground portion of the disk which occults the central reflection nebula. CO absorption against the background cloud samples the entire line-of-sight through the disk, including the portion behind the reflection nebula. The projected width of the deepest CO absorption at 7.1 km s-1 (cyan contour in Fig. 2 and the panel labeled 7.1 in Fig. 4) may be marginally wider than the 0.43″ apparent thickness of the silhouette. As stated above, it is possible that optically thick CO extends above and below the region seen in silhouette in the HST images.
Emission and absorption from the disk in the 0.25″ radius synthesized ALMA beam is diluted by a factor = 0.5 to 1. At the location of the strongest CO absorption in the northeast, the thickness in the F775W HST image is 0.43″ and 1. At the weaker southwest absorption, 0.20″ and 0.5. Correcting the southwest dip for beam dilution makes its absorption depth comparable to the northeast depth. The inner part of the disk where the highest rotation speeds are expected may be more beam diluted because the disk is expected to be even thinner. Additionally, the highest velocity CO in the center of the disk may extend beyond the velocity range where the background emission is brighter than the disk emission, in which case it would not be seen in absorption and any emission signature may be too beam-diluted to be seen.
The mean volume and column density of the 114-426 disk can be estimated from the dust-continuum derived mass, grams, and the projected size of the sub-mm dust emission, 0.2″ by 1″. Assuming that the disk mass is distributed uniformly in a pill-shaped volume with these dimensions implies a mean density, cm-3 and column density, cm-2 . The low-J transitions of CO will be thermalized at the gas temperature, and unless it is depleted by more than 3 orders of magnitude compared to molecular clouds, it will be optically thick.
The apparent surface brightness of the 856 m continuum in the ALMA beam, 4 mJy beam-1, is also affected by beam dilution. Using the beam dilution factor appropriate to the inner 350 AU portion of the disk, 0.5 to 1, implies an average surface brightness of 8 4 mJy if the disk were to fill the beam. Comparing this brightness to the Planck function, for temperatures ranging from = 20 40 K from a solid-angle equal to the synthesized ALMA beam provides an estimate of the dust optical depth, . The mean optical depth of the dust ranges from = 0.016 to 0.032 for 20 K dust or = 0.006 to 0.013 for 40 K dust.
A surprising feature of the 114-426 dust continuum emission is the sharp drop in flux at a radius of about 200 AU from the suspected location of the central star (Figs. 1 and 2). The flux decreases by 3 mJy beam-1 in a region comparable to or smaller than the synthesized beam diameter. The outer parts of the disk beyond R 200 AU but interior to the edge at visual wavelengths (1.4″ or 580 AU northeast of the suspected location of the central star and 0.8″ or 330 AU to the southwest) do not exhibit any continuum emission above the noise. Assuming that the total area of the outer region of the disk is 0.4 square arc seconds based on a comparison between the area of the silhouette in the HST images and the area where 856 m emission is detected, the 0.6 mJy/beam sensitivity limit implies that the column density of H2 must be cm-3. This column corresponds to a visual-wavelength extinction of about 8 magnitudes, assuming normal ISM dust. The HST images show that the visual extinction through the outer disk ranges from about 0.5 magnitudes in the translucent northeastern edge to more than 3 magnitudes at R 200 AU. Thus, for normal ISM dust, the visual extinction implies that the sub-millimeter continuum ought to be detected at a level of 0.2 mJy beam-1 for a 0.5″ beam diameter.
At the two velocities where the deepest CO absorption is seen (6.9 km s-1 and 9.5 km s-1), the background CO line temperature is between 60 K and 70 K. Assuming that the absorbing layer is optically thick and beam-filling (as it may be at the northwest portion of 114-426), an absorption depth of 0.6 Jy beam-1 against a 60 70 K background corresponds to a brightness temperature of 33 43 K. If the CO absorption is beam-diluted by a factor , the temperature will be correspondingly lower and likely a good estimate of the gas temperature where the CO optical depth reaches a value of order unity.
The CO absorption has a similar spatial extent as the dust continuum along the disk major axis. If the absorption minima trace the peak orbit speeds at their centroid locations, the mass of the central star can be estimated since the 114-426 disk is within a few degrees of being edge-on. As discussed above, the deepest absorptions occur at a projected separation of ″, implying AU ( cm) at a distance of 414 pc. The radial velocity difference between the north and south absorption dips, km s-1, implies km s-1. Thus, assuming that the disk is in Keplerian rotaion, the enclosed mass is M⊙. This estimate may be a lower bound since CO absorption would not trace gas outside the velocity range VLSR = 5 10 km s-1 where the brightness temperature of the background CO emission drops below the brightness temperature of the CO in the disk. The absence of emission at larger radial velocities, however, also sets an upper bound on the stellar mass.
We modeled the CO absorption from a geometrically thin, optically thick Keplerian disk inclined by a few degrees, convolved with a Gaussian to represent the synthesized ALMA beam using two free parameters: an inner hole with radius and the central star mass, . If the inner hole is small, a stellar mass between 0.4 msol and 0.7 M⊙ is favored. A stellar mass of about 1 M⊙ and a thin annular disk with a large ( 250 AU) hole, however, is also allowed. A flaring disk with a small scale-height close the star would produce results similar to a model disk with a large inner hole because of radially-dependent beam-dilution.
Our mass estimate is lower than than 1.5 M⊙ estimated by McCaughrean et al. (1998) based on extrapolation of the observed brightness of the reflection nebula. More efficient scattering by large, high-albedo grains, and significant forward scattering would lower the estimated intrinsic magnitude of the central star, and the resulting stellar mass estimate.
HCO+, HCN, and CS lines, in either emission or absorption, are not detected from 114-426. Their brightness temperatures may be either similar to that of the background, or these species may be depleted. Given the faint dust continuum emission, and the low relative abundances of these species compared to CO in molecular clouds (Bergin & Tafalla 2007), their absence in 114-426 may not be that surprising.
4.1 Is 114-426 an Evolved Proto-planetary Disk?
The small estimated mass of the 114-426 disk is in stark contrast to its large size in visual wavelength images. Visual extinction is dominated by small grains while the sub-millimeter emission is more sensitive to large particles. Multi-wavelength observations of circumstellar disks indicate that the grain size decreases with increasing distance from the central star. These observations suggest that the outermost regions of young circumstellar disks might be populated by dust similar to the ISM (Testi et al. 2014).
Photometry of the translucent northeast outer edge of the 114-426 disk has shown that the extinction is grey, implying that the mean particle size responsible for the attenuation of background light is large compared to interstellar grains in the outer parts of the disk at a projected radius of 400 AU to 500 AU from its central star (Throop et al. 2001). Reddening between 2 m and 4 m (Shuping et al. 2003), however, indicates that the grains must be smaller than a few micro-meters. These observations suggest that the 114-426 is an evolved disk in which solids and ices have been incorporated into large particles. These observations, and comparison to data on young disks (Testi et al. 2014), suggests that 114-426 is an evolved disk.
Grain growth rates are expected to increase with decreasing distance from the central star. Thus, it is possible that in the inner portions of the 114-426 disk, particles have grown to sizes larger than a millimeter, in which case the sub-millimeter emissivity per unit mass of solids (and gas) would decrease. Thus, the assumptions used above for converting the observed continuum flux into dust and gas mass may not apply. In this case, our estimated disk mass would be a lower bound. If the mean particle size responsible for the continuum emission is larger than the wavelength, however, then the shape of the dust continuum spectrum should approach the Rayleigh-Jeans slope of 2. Future sub-arc-second angular resolution, multi-frequency observations with ALMA can directly measure the sub-millimeter continuum spectral index to determine if indeed grains are larger than the observing wavelength. Given that the 114-426 disk lacks evidence for being surrounded by a photo-ionized skin, spectral index measurements can be extended into the centimeter-wavelength domain using the JVLA. Such measurements may in the future provide direct evidence for the sequestration of solids and ices into large bodies, a process expected to be the first phase of planet formation.
It is possible that the absence of dense gas tracers in the 114-426 disk is also evidence for chemical evolution. In the low-temperature conditions encountered in the outer Orion Nebula, many common tracers of molecular gas may have frozen out of the gas phase and locked into icy grain mantles. UV and X-ray photolysis of light organic compounds in an ice matrix may lead to their conversion into heavy organic material. Thus, the absence of measurable HCN, CS, and HCO+ lines may also be an indication that the 114-426 disk is highly evolved. Sensitive searches for other compounds in the sub-millimeter spectrum of 114-426 with ALMA should test this hypothesis.
Miotello et al. (2012) proposed that 114-426 is being photo-ablated by the non-ionizing FUV radiation field in the Orion Nebula and suggested a mass-loss rate M⊙ yr-1. For the disk mass estimated above, grams, the disk lifetime is years.
4.2 Comparison to ALMA Observations of Other Silhouette Disks in Orion
Two other giant disks in Orion, 216-0939 near OMC2, and 253-1536 in M43 show strong dust continuum (Mann et al. 2014) and bright line-emission in the dense gas tracers. CO is seen both in emission and absorption, but the latter signal is less prominent than in 114-426, probably because the background CO emission is dimmer, and possibly because foreground CO is more likely to be present along the line of sight. Analysis of the displacements and Doppler shifts of the absorption signals give stellar mass estimates comparable to those derived from the emission line rotation curves, namely 3.5 M⊙ for 253-1536 (Williams et al. 2014) and 1.1 M⊙ for 216-0939 (in preparation). These objects have central star masses around 1 M⊙ to 3 M⊙ and are surrounded by massive disks exhibiting strong sub-mimmimeter dust continuum and bright line emission in HCN, CS, and HCO+. The dim dust continuum and lack of detection of the dense gas tracers in the 114-426 silhouette disk is consistent with the low mass estimated for its central star and surrounding disk (Andrews et al. 2013).
4.3 Other Objects in the 114-426 ALMA field
Figure 1 shows that the northern portion of the 114-426 ALMA field contains bright CO emission associated with the Herbig-Haro object HH 530 (Bally et al. 2000). The H image shows a jet-like feature east of the star V2202 Ori (source 4 in Table 1 and the figures; source 106-417 in O’Dell and Wen 1994). Many components of HH 530, however, exhibit supersonic motions towards the southwest with velocities ranging from 25 km s-1 to 70 km s-1 (O’Dell & Doi 2003), indicating that these shocks trace a background outflow from a source embedded in the vicinity of OMC1-South, northeast of the 114-426 field. Thus, V2202 Ori is not related to this flow. The CO emission in the vicinity of HH 530 extends from VLSR = +2 km s-1 to over +20 km s-1 and may be associated with HH 530. It may trace a shell swept-up by this externally irradiated HH object. Given that both red and blueshifted components of the flow are seen in the same lobe (with respect to the VLSR 9 km s-1 radial velocity of the background CO emission in this portion of Orion), the outflow must move close to the plane of the sky. The presence of molecules in HH 530 shows that the H emission seen in the HST images must trace the ionized skin of a molecular outflow, indicating that this flow is only partially photo-ionized by the UV radiation field in the Orion Nebula.
The prominent bow-shaped H structure located about 6″ to 10″ west of 114-426 is not associated with any CO features. This bow, however, also exhibits a large proper motion of about 40 km s-1 toward the southwest as shown by the multi-epoch HST images of O’Dell & Doi (2003). It is unclear if this feature is associated with an outflow from 114-426 or an other unrelated background flow similar to HH 530 but without a CO counterpart.
5 Conclusions
The largest disk seen in silhouette against the visual-wavelength emission of the Orion Nebula, 114-426, is detected in dust continuum emission, and in absorption in the 345 GHz J=32 CO transition. The CO absorption against the warm background emission from the Orion A cloud has the same spatial extent and morphology as the dust continuum emission. The disk in these tracers is a factor of two smaller than in the visual wavelength HST images, however. A model consisting of a Keplerian rotation curve in a geometrically-thin, edge-on disk convolved with a 0.5″ Gaussian beam-profile indicates that is less than 1 M⊙ with a most likely value around 0.4 M⊙. The disk is not detected in HCN, CS, or HCO+ lines.
Assuming a gas-to-dust ratio of 100, and a a dust temperature of 20 K, the observed sub-mm dust continuum implies a disk mass of 3.10.6 times the mass of Jupiter ( grams). Comparison with ALMA observations of two other large disks in the Orion region provides support for a low-stellar mass and low-disk mass.
References
- Andrews et al. (2013) Andrews, S. M., Rosenfeld, K. A., Kraus, A. L., & Wilner, D. J. 2013, ApJ, 771, 129
- Bally et al. (2006) Bally, J., Licht, D., Smith, N., & Walawender, J. 2006, AJ, 131, 473
- Bally et al. (2000) Bally, J., O’Dell, C. R., & McCaughrean, M. J. 2000, AJ, 119, 2919
- Bally et al. (1998) Bally, J., Testi, L., Sargent, A., & Carlstrom, J. 1998, AJ, 116, 854
- Bergin & Tafalla (2007) Bergin, E. A. & Tafalla, M. 2007, ARA&A, 45, 339
- Berne et al. (2014) Berne, O., Marcelino, N., & Cernicharo, J. 2014, ArXiv e-prints
- Eisner & Carpenter (2006) Eisner, J. A. & Carpenter, J. M. 2006, ApJ, 641, 1162
- Eisner et al. (2008) Eisner, J. A., Plambeck, R. L., Carpenter, J. M., Corder, S. A., Qi, C., & Wilner, D. 2008, ApJ, 683, 304
- Johnstone et al. (1998) Johnstone, D., Hollenbach, D., & Bally, J. 1998, ApJ, 499, 758
- Mann et al. (2014) Mann, R. K. et al. 2014, ApJ, 784, 82
- Mann & Williams (2009) Mann, R. K. & Williams, J. P. 2009, ApJ, 694, L36
- Mann & Williams (2010) —. 2010, ApJ, 725, 430
- McCaughrean et al. (1998) McCaughrean, M. J. et al. 1998, ApJ, 492, L157
- McCaughrean & O’Dell (1996) McCaughrean, M. J. & O’Dell, C. R. 1996, AJ, 111, 1977
- Menten et al. (2007) Menten, K. M., Reid, M. J., Forbrich, J., & Brunthaler, A. 2007, A&A, 474, 515
- Miotello et al. (2012) Miotello, A., Robberto, M., Potenza, M. A. C., & Ricci, L. 2012, ApJ, 757, 78
- O’Dell (2001) O’Dell, C. R. 2001, ARA&A, 39, 99
- O’Dell & Doi (2003) O’Dell, C. R. & Doi, T. 2003, AJ, 125, 277
- O’Dell & Wen (1994) O’Dell, C. R. & Wen, Z. 1994, ApJ, 436, 194
- Peng et al. (2012) Peng, T.-C., Wyrowski, F., Zapata, L. A., Güsten, R., & Menten, K. M. 2012, A&A, 538, A12
- Ricci et al. (2008) Ricci, L., Robberto, M., & Soderblom, D. R. 2008, AJ, 136, 2136
- Robberto et al. (2013) Robberto, M. et al. 2013, ApJS, 207, 10
- Shimajiri et al. (2011) Shimajiri, Y. et al. 2011, PASJ, 63, 105
- Shimajiri et al. (2014) —. 2014, A&A, 564, A68
- Shuping et al. (2003) Shuping, R. Y., Bally, J., Morris, M., & Throop, H. 2003, ApJ, 587, L109
- Testi et al. (2014) Testi, L. et al. 2014, Protostars and Planets VI, 339
- Throop et al. (2001) Throop, H. B., Bally, J., Esposito, L. W., & McCaughrean, M. J. 2001, Science, 292, 1686
- Williams et al. (2005) Williams, J. P., Andrews, S. M., & Wilner, D. J. 2005, ApJ, 634, 495
- Williams & Best (2014) Williams, J. P. & Best, W. M. J. 2014, ApJ, 788, 59
- Williams et al. (2014) Williams, J. P. et al. 2014, ApJ, 796, 120
| No. | Flux1 | Comments | ||
|---|---|---|---|---|
| J2000 | J2000 | (mJy) | ||
| 1 | 05 35 11.32 | 05 24 26.4 | 6.00.6 | 114-426 |
| 2 | 05 35 11.32 | 05 24 38.2 | 8810 | 2MASS 05351131-05243812 |
| 3 | 05 35 11.66 | 05 24 21.5 | 3.70.6 | OW94 117-421; 2MASS 05351165-0524213 |
| 4 | 05 35 10.53 | 05 24 16.8 | 4 | OW94 106-417; HH 530; V2202 Ori |
| 5 | 05 35 12.11 | 05 24 33.9 | 9 | OW94 121-434; V2224 Ori |
Note. — [1]: Fluxes are measured on the ALMA dust continuum image. [2]: Source 2 corresponds to ROBb 18 (see Table 3 in Mann et a. 2014). Mann et al. (2014) measured a flux of 93.79 mJy for this source. The reprocessed data used in this paper gives a slightly lower flux. The discrepancy is probably due to the fact that the star is at the edge of the primary beam.
| VLSR | I(CO)a | T(CO)a | T | |||
|---|---|---|---|---|---|---|
| (km s-1) | J2000 | J2000 | (Jy) | (K) | (K) | |
| 5.43 | 05 35 11.332 | 05 24 26.10 | 0.07 | 3.0 | 51 | 0.06 |
| 5.86 | 05 35 11.328 | 05 24 26.04 | 0.14 | 6.0 | 59 | 0.10 |
| 6.28 | 05 35 11.336 | 05 24 26.04 | 0.43 | 18.4 | 67 | 0.27 |
| 6.70 | 05 35 11.336 | 05 24 26.04 | 0.61 | 26.1 | 73 | 0.36 |
| 7.13 | 05 35 11.334 | 05 24 26.09 | 0.63 | 27.0 | 78 | 0.35 |
| 7.55 | 05 35 11.331 | 05 24 26.20 | 0.42 | 18.0 | 82 | 0.22 |
| 7.97 | 05 35 11.326 | 05 24 26.31 | 0.24 | 10.3 | 82 | 0.13 |
| 8.40 | 05 35 11.322 | 05 24 26.38 | 0.14 | 6.0 | 81 | 0.07 |
| 8.82 | 05 35 11.314 | 05 24 26.59 | 0.18 | 7.7 | 77 | 0.10 |
| 9.24 | 05 35 11.310 | 05 24 26.72 | 0.28 | 12.0 | 71 | 0.17 |
| 9.67 | 05 35 11.306 | 05 24 26.81 | 0.26 | 11.1 | 63 | 0.17 |
| 10.09 | 05 35 11.306 | 05 24 26.81 | 0.15 | 6.4 | 51 | 0.13 |
| 10.51 | 05 35 11.306 | 05 24 26.81 | 0.05 | 2.1 | 39 | 0.05 |