Evolution of density of states and spin-resolved “checkerboard” pattern associated with Majorana bound state
Abstract
In terms of Bogoliubov-de Gennes approach, we investigate Majorana bound state (MBS) in vortex of proximity-induced superconductivity on the surface of topological insulator (TI). Mapping out the local density of states (LDOS) of quasiparticle excitations as a function of energy and distance from vortex center, it is found that the spectral distribution evolves from “V”-shape to “Y”-shape with emergence of MBS upon variation of chemical potential, consistent with the STM/STS measurement in a very recent experiment [Xu et al., Phys. Rev. Lett. 114, 017001 (2015)] on Bi2Te3 thin layer on the top of NbSe2. Moreover, we demonstrate that there is a “checkerboard” pattern in the relative LDOS between spin up and down channels, which maps out directly the quantum mechanical wave function of MBS. Therefore, spin-resolved STM/STS technique is expected to be able to provide phase sensitive evidence for MBS in vortex core of topological superconductor.
pacs:
03.65.Vf 74.25.Ha 74.45.+c 74.55.+v 03.67.LxIntroduction.— Majorana bound states (MBSs) are under intensive search in topolgoical superconductors (SCs) hasan2010 ; qi2011 . Because of the peculiar property that a particle is equivalent to its antiparticle majorana , non-Abelian quantum statistics can be generated which is believed to be potentially important for achieving decoherence-free topological quantum computation ivanov2001 ; nayak2008 ; alicea2011 ; liang2012 ; wu2014 ; alicearpp ; beenakkerarcp . MBSs were first predicted in the spinless pairing states of fermions including the Pfaffian state of quantum Hall system with filling read2000 and ultracold atomic gases with -wave Feshbach resonance gurarie2005 . Recently, heterostructures made of -wave SC and topological insulator (TI) fu2008 , or the combination of semiconductor with Rashba spin-orbit coupling (SOC) and ferromagnetic insulator sato2009 ; lutchyn2010 ; sau2010 , are proposed for realizing topological SC with the spin degree of freedom suppressed by SOC. Sr2RuO4 maeno2012 , UPt3 tsutsumi2013 and doped TI CuxBi2Se3 sasaki2012 are also discussed as possible candidates.
MBS is a unique quasiparticle excitation of topological SC carrying zero energy and zero total angular momentum, which appears at ends of one-dimensional systems or at vortex cores, where the SC gap is closed fu2008 ; sato2009 ; lutchyn2010 ; sau2010 ; kitaev2001 ; sau2010prb ; chamon2010 ; cheng2010 ; hosur2011 ; zzli2014 ; chiu2011 ; hui2015 ; jli2014 . The unique property of equivalence between particle and antiparticle, which renders MBS noble for advanced applications, makes them difficult to be identified fu2009 ; akhmerov2009 ; law2009 ; alicearpp . The hurdle has been tackled experimentally. Up to this moment, there are already several reports on possible MBSs in 1D nanowires mourik2012 ; deng2012 ; finck2013 ; nadj-perge2014 , where quasiparticle states are observed at ends of nanowires at zero-energy bias.
Very recently scanning tunneling microscopy and spectroscopy (STM/STS) experiments have been performed in vortex state of proximity-induced SC in Bi2Te3 thin layer xu2015 . Mapping the local density of states (LDOS) measured by differential conductance as a function of bias voltage and the distance from vortex core, an evolution from “V”-shape for thin TI to “Y”-shape for thick TI was observed, and it is conjectured that the “Y”-shaped LDOS with its center at zero-energy bias is due to the appearance of MBSs.
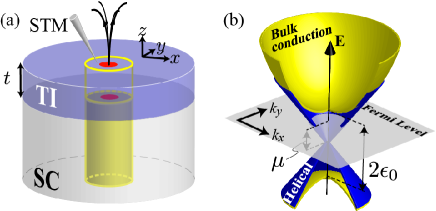
In this work, we examine the same geometry as in the experiment xu2015 (see Fig. 1) in terms of Bogoliubov-de Gennes (BdG) analysis based on a model system including explicitly the topological surface states of TI slab with proximity-induced SC. We clarify that, due to the relation among energy, angular momentum and spatial distribution of quasiparticle excitation, the spatial-energy distribution of LDOS evolves from “V”-shape to “Y”-shape corresponding to the absence and presence of MBS at vortex core when the chemical potential is reduced, which is in nice agreement with the STM/STS measurement xu2015 . Moreover, exploring the total angular momentum of quasiparticle excitation contributed from spin and orbital angular momenta and the phase winding of vortex, we demonstrate that there should be a “checkerboard” pattern in spin-resolved LDOS associated with MBS. This suggests a phase sensitive way for identifying MBS as a single quasiparticle by spin-resolved STM/STS technique.
Model Hamiltonian and BdG approach.— As can be read from Fig. 4 of Ref. xu2015 , when the thickness of TI slab increases, the Fermi level shifts from a position cutting the bulk conduction band [for one to four quintuple layers (QLs)] to a position below the conduction band (for five and six QLs), while the size of band gap between the bulk conduction and valance bands remains almost unchanged. For the whole range of thickness, the SC gap can be taken as constant as a fairly good approximation (see Fig. 2 of Ref. xu2015 ). In order to model the situation realized in the experiment, we consider a system of TI slab carrying on topological surface states and with proximity-induced SC as shown schematically in Fig. 1(a), where the chemical potential is varied while the thickness of TI slab and the SC gap are fixed. The BdG Hamiltonian is given by
| (3) |
with the effective Hamiltonian of TI
and Dirac mass
| (4) |
in the cylindric coordinates, where and are Pauli matrices for spin up and down states and orbitals of Bi and Te with even and odd parities respectively. The bulk gap between valance and conduction bands is taken as and Fermi level is measured from the Dirac point of the topological surface states of TI; corresponds to thin TI slabs and to thick TI slabs in the experiment xu2015 . Since the energy gap of Bi2Te3 is eV and the proximity-induced SC gap is meV in the experiment xu2015 , we take for numerical calculation in the present work, noticing that this value influences substantially the distribution of spectral weight. The Fermi velocity of topological surface state corresponds the slope of linear dispersion in Fig. 1(b), which yields the unit for lateral length . Taking nmeV for Bi2Te3 from another experiment chen2009 , one has nm. The effective mass is taken as for simplicity.
For simplicity we consider the case with only one vortex, where the SC gap takes the form with the azimuthal angle in the cylindrical coordinate. The eigen wave functions of quasiparticle excitations take the form
| (9) |
where , , and , the electron and hole wave functions, are two-component vectors referring to the two orbitals, and and are the angular momentum and eigen energy. For numerical diagonalization, we expand the wave functions and in terms of the Bessel orthonormal functions in radial direction gygi1991 and the Gauss-Lobatto functions in direction mizushima2010 . Since the coherence length is large, a radius is used for numerical calculations.
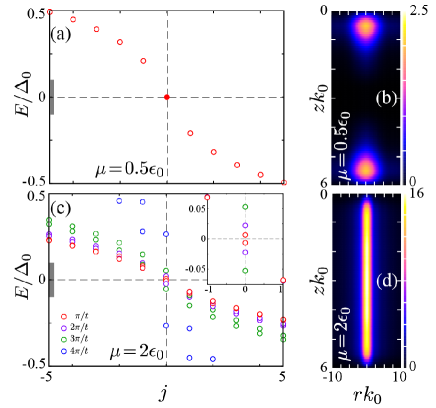
When the Fermi level lies in between the bulk conduction and valence bands, namely (thick TI slab in experiments), SC gap is opened only in the surface Dirac dispersions of TI. As the result, two MBSs with zero energy and zero angular momentum appear at the top and bottom surfaces of TI slab as shown in Fig. 2. The energy difference between MBSs and the lowest excitations is for . The spatial distributions of the two MBSs on the top and bottom surfaces are the same since in the present simplified model the effect of SC substrate is taken into account by a uniform proximity-induced SC gap. Because the two MBSs are localized at the two surfaces of TI slab, they are well described by the 2D model fu2008 , and the analytical solution chamon2010 ; cheng2010 .
When the Fermi level falls into the bulk conduction band, namely (thin TI slab in experiments), low-energy quasiparticle excitations carrying finite momenta with the thickness of TI slab spread along direction in vortex core as can be seen in Figs. 2(c) and (d). Due to these states in the normal vortex core the two MBSs on surfaces interact with each other hosur2011 yielding a mini gap as can be seen in inset of Fig. 2(c).
LDOS for quasiparticle excitations are given by the electron wave functions,
| (10) |
with
| (11) |
which is measured directly by the differential conductance in STM/STS experiments. Judging from the continuous spectra observed in Fig. 2 in Ref. xu2015 , the energy resolution in experiments is larger than the energy differences between quasiparticle levels. In order to simulate this situation, we replace with a smearing function with in Eq. (11).
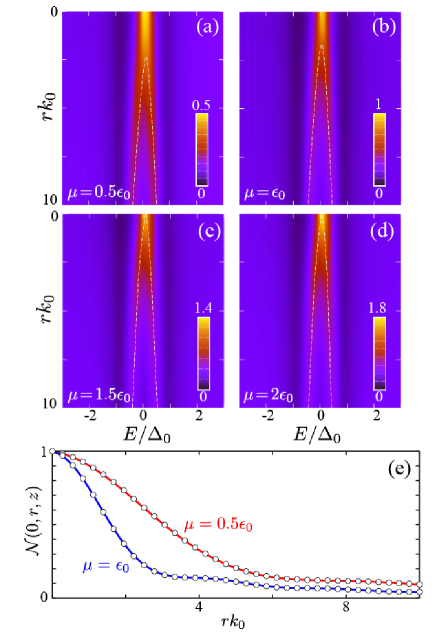
The spatial distribution of a quasiparticle excitation is mainly governed by the orbital angular momentum, which appears in the wave functions approximately given by Bessel functions. The energy dispersion with respect to the total angular momentum then gives a correlation between energy and spatial position of maximal absolute value of quasiparticle wave function. As a general rule, quasiparticles with higher energy locate at a position farer away from the center of vortex. As shown in Fig. 3, for and 1 (thick TI slab in experiments), accompanied by MBSs with zero energy locating around the center of vortex core [see Figs. 2(a) and (b)], the LDOS takes a “Y”-shape; for (thin TI slab in experiments), the LDOS takes a “V”-shape corresponding to the absence of spectral weight at zero energy [see Figs. 2(c) and (d)]. This tendency can also be seen directly from the wave function of MBSs. As shown in Fig. 3(e), the MBSs distribute over a larger area in the vortex core when the chemical potential is lowered, since their wave function is given by the Bessel function chamon2010 ; cheng2010 , where , the intercept of Dirac dispersion with Fermi level, decreases with decreasing upon lowering the Fermi level [see Fig. 1(b)]. The above evolution of spectral shape of LDOS is consistent with the tendency observed in the STM/STS experiments where the thickness of TI slab is changed systematically xu2015 , and supports the existence of MBSs in thick TI slabs.
LDOS presented in a previous work exhibits asymmetry in spectrum with respect to the zero energy zzli2014 . The apparent difference between them and the ones in Fig. 3 is due to that a large SC gap meV was taken in that work as compared with a small smearing factor.
Spin-resolved LDOS.—MBSs as quasiparticle excitation with zero energy and zero angular momentum can be better identified by spin-resolved LDOS even with the same STM/STS resolution. To demonstrate this idea, we check the wave functions of quasiparticle excitations paying attention to spin degree of freedom. Due to the rotational symmetry, the total angular momentum
| (12) |
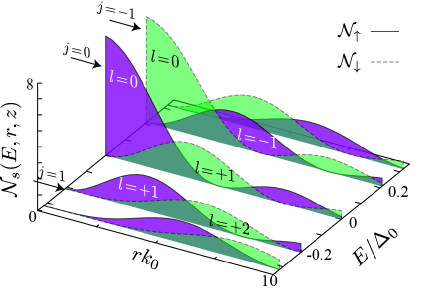
contributed from orbital and spin angular momenta and the phase winding of SC gap (presumed as anti-clockwise) is conserved. Therefore, it is clear that the MBS with zero total angular momentum has two components with for up spin () and for down spin (). The detailed wave functions of MBS are displayed in Fig. 4 with spin up and down separately, where the amplitudes oscillate with distance from vortex center in terms of Bessel functions chamon2010 ; cheng2010 . According to our numerical calculations, the excited state with energy and total angular momentum exhibits a spatial distribution almost the same as the MBS [see Fig. 4]. It is intriguing to notice that, however, the oscillations in the two wave functions are out of phase when the spin state is specified. The same out-of-phase oscillations happen in the excited state with energy and total angular momentum .
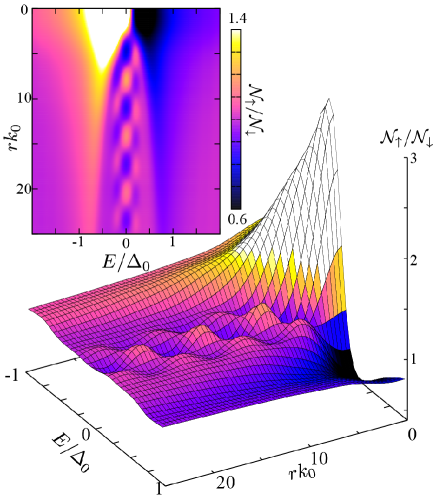
This property can be used for distinguishing MBSs from the first excited states. In order to see this explicitly, we calculate the spin-resolved LDOSs and given in Eq. (11) and evaluate the relative LDOS by taking the ratio between them. The result thus obtained for and is displayed in Fig. 5, where a checkerboard pattern is observed in the spatial-energy mapping of LDOS with the period of 10 nm in space and 0.4 meV in energy. We emphasize that, while the smearing factor in Figs. 3 and 5 is the same, corresponding to the same STM/STS resolution, the relative spin-specific LDOS resolves the wave function of MBS up to the quantum limit. In a sharp contrast, the spectrum of quasiparticle excitations for is continuous, since bound states with spread out in direction in the vortex core, and the relative spin-resolved LDOS loses the oscillating phase. In an anti-vortex with clockwise phase winding, the last term in Eq. (12) should change sign, and it is easy to see that the checkerboard pattern in Fig. 5 should switch the purple-blue contrast. Therefore, the checkerboard pattern of spin-resolved LDOS for quasiparticle excitation displayed in Fig. 5 provides a phase sensitive evidence for MBS in vortex core of topological SC. It is worth noticing that, if the energy resolution of STM/STS measurement is high enough, checkerboard patterns can be detected even in individual spin-resolved LDOS (without taking the ratio between signals in two spin channels, see Appendix). Experimentally, spin-resolved LDOS can be obtained by using a spin-polarized STM tip bode2003 . It is noticed that, with very high resolution splitting in spectral weight due to spin states can be observed even in the total LDOS hanaguri2014 .
Conclusions.— We clarify that, in a vortex core of proximity-induced SC on the surface of TI, the spatial-energy mapping of local density of states of quasiparticle excitations evolves from “V”- to “Y”-shape with emergence of Majorana bound state, which is in good agreement with a very recent STM/STS experiment. Moreover, we demonstrate that the relative density of states between spin up and down channels exhibits a checkerboard pattern reflecting the out of phase oscillations in the spin-specific wave functions of Mojarana bound state and excited states. It provides a clue toward observing Majorana bound state in terms of phase sensitive signal by using spin-resolved STM/STS experiments.
The authors are grateful to J.-F. Jia, F.-C. Zhang, C.-H. Chen, S.-H. Pan, and T. Hanaguri for stimulating discussions. This work was supported by the WPI Initiative on Materials Nanoarchitectonics, Ministry of Education, Culture, Sports, Science and Technology of Japan.
Appendix A Appendix: LDOS in individual spin channels
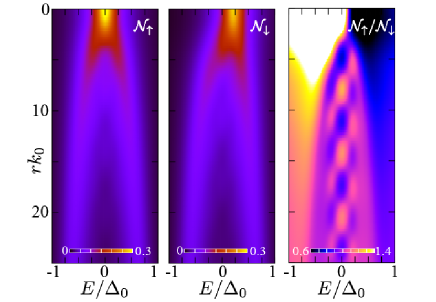
Spin-resolved local densities of states (LDOS) shown in Fig. 5 are re-plotted separately in two spin channels in Fig. 6. Checkerboard observed in the relative spin-resolved LDOS cannot be seen clearly in the two individual spin-resolved LDOS, which demonstrates the advantage of taking their ratio in highlighting the oscillating behavior in LDOS associated with the Majorana bound state. The LDOS is symmetric (asymmetric) in the spin-up (-down) channel corresponding to the anti-clockwise phase winding of vortex, as can be understood from the wave functions exhibited in Fig. 4.
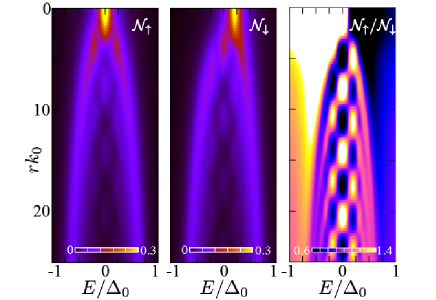
Meanwhile, it is worth noticing that checkerboard patterns can be identified in LDOS in individual spin channels provided the energy resolution of STM/STS measurement is high enough. In order to demonstrate this point, we simulate a case with smearing factor smaller than the one for Fig. 6 () and display the results in Fig. 7. Here, once again checkerboard pattern is enhanced in relative LDOS.
References
- (1) M. Z. Hasan and C. L. Kane, Rev. Mod. Phys. 82, 3045 (2010).
- (2) X.-L. Qi and S.-C. Zhang, Rev. Mod. Phys. 83, 1057 (2011).
- (3) F. Wilczek, Nat. Phys. 5, 614 (2009).
- (4) C. Nayak, S. H. Simon, A.Stern, M. Freedman, and S. Das Sarma, Rev. Mod. Phys. 80, 1083 (2008).
- (5) D. A. Ivanov, Phys. Rev. Lett. 86, 268 (2001).
- (6) J. Alicea, Y. Oreg, G. Refael, F. von Oppen, and M. P. A. Fisher, Nature Physics 7, 412 (2011).
- (7) Q.-F. Liang, Z. Wang, and X. Hu, Europhys. Lett. 99, 50004 (2012).
- (8) L.-H. Wu, Q.-F. Liang, and X. Hu, Sci. Technol. Adv. Mater. 15 064402 (2014).
- (9) J. Alicea, Rep. Prog. Phys. 75, 076501 (2012).
- (10) C. W. J. Beenakker, Annu. Rev. Condens. Mattter Phys. 4, 113 (2013).
- (11) N. Read and D. Green, Phys. Rev. B 61, 66151 (2000).
- (12) V. Gurarie, L. Radzihovsky, and A. V. Andreev, Phys. Rev. Lett. 94, 230403 (2005).
- (13) L. Fu and C. L. Kane, Phys. Rev. Lett. 100, 96407 (2008).
- (14) M. Sato, Y. Takahashi, and S. Fujimoto, Phys. Rev. Lett. 103, 20401 (2009).
- (15) R. M. Lutchyn, J. D. Sau, and S. Das Sarma Phys. Rev. Lett. 105, 077001 (2010).
- (16) J. D. Sau, R. M. Lutchyn, S. Tewari, and S. Das Sarma, Phys. Rev. Lett. 104, 040502 (2010).
- (17) Y. Maeno, S. Kittaka, T. Nomura, S. Yonezawa, K. Ishida, J. Phys. Soc. Jpn. 81, 011009 (2012)
- (18) Y. Tsutsumi, M. Ishikawa, T. Kawakami, T. Mizushima, M. Sato, M. Ichioka, and K. Machida, J. Phys. Soc. Jpn. 82, 113707 (2013).
- (19) S. Sasaki, Z. Ren, A. A. Taskin, K. Segawa, L. Fu, and Y. Ando, Phys. Rev. Lett. 109, 217004 (2012).
- (20) A. Y. Kitaev, Phys. Usp. 44, 131 (2001).
- (21) J. D. Sau, R. M. Lutchyn, S. Tewari, and S. Das Sarma, Phys. Rev. B 82, 094522 (2010).
- (22) C. K. Chiu, M. J. Gilbert, and T. L. Hughes, Phys. Rev. B 84, 144507 (2011).
- (23) Z.-Z. Li, F.-C. Zhang, and Q.-H. Wang, Sci. Rep. 4, 6363 (2014).
- (24) P. Hosur, P. Ghaemi, R. S. K. Mong, and A. Vishwanath, Phys. Rev. Lett. 107, 097001 (2011).
- (25) C. Chamon, R. Jackiw, Y. Nishida, S.-Y. Pi, and L. Santos, Phys. Rev. B 81, 224515 (2010).
- (26) M. Cheng, R. M. Lutchyn, V. Galitski, and S. Das Sarma, 82, 094504 (2010).
- (27) J. Li, H. Chen, I. K. Drozdov, A. Yazdani, B. A. Bernevig, and A. H. MacDonald Phys. Rev. B 90, 235433 (2014).
- (28) H.-Y Hui, P. M. R. Brydon, J.D. Sau, S. Tewari, and S. Das Sarma, Sci. Rep. 5, 8880 (2015).
- (29) L. Fu and C. L. Kane, Phys. Rev. Lett. 102, 216403 (2009).
- (30) A. R. Akhmerov, J. Nilsson, and C. W. J. Beenakker, Phys. Rev. Lett. 102, 216404 (2009).
- (31) K. T. Law, P. A. Lee, and T. K. Ng, Phys. Rev. Lett. 103, 237001 (2009).
- (32) V. Mourik, K. Zuo, S. M. Frolov, S. R. Plissard, E. P. A. M. Bakkers, and L.P. Kouwenhoven, Science 336, 1003 (2012).
- (33) M. T. Deng, C. L. Yu, G. Y. Huang, M. Larsson, P. Caroff, and H. Q. Xu, Nano Lett. 12, 6414 (2012).
- (34) A. D. K. Finck, D. J. Van Harlingen, P. K. Mohseni, K. Jung, and X. Li, Phys. Rev. Lett. 110, 126406 (2013).
- (35) S. Nadj-Perge, I. K. Drozdov, J. Li, H. Chen, S. Jeon, J. Seo, A. H. MacDonald, B. A. Bernevig, and A. Yazdani, Science 346, 602 (2014).
- (36) J.-P. Xu, M.-X. Wang, Z.-L. Liu, J.-F. Ge, X. Yang, C. Liu, Z.-A. Xu, D. Guan, C.-L. Gao, D. Qian, Y. Liu, Q.-H. Wang, F.-C. Zhang, Q.-K. Xue, and J.-F. Jia, Phys. Rev. Lett. 114, 017001 (2015).
- (37) Y. L. Chen, J. G. Analytis, J. H. Chu, Z. K. Liu, S. K. Mo, X. L. Qi, H. J. Zhang, D. H. Lu, X. Dai, Z. Fang, S. C. Zhang, I. R. Fisher, Z. Hussain, and Z. X. Shen, Science 325, 178 (2009).
- (38) F. Gygi and M. Schülter, Phys. Rev. B 43, 7609 (1991).
- (39) T. Mizushima and K. Machida, Phys. Rev. A 82, 023624 (2010).
- (40) M. Bode, Rep. Prog. Phys. 66, 523 (2003).
- (41) Y.-S. Fu, M. Kawamura, K. Igarashi, H. Takagi, T. Hanaguri, and T. Sasagawa, Nat. Phys. 10, 815 (2014).