Physical Properties of Gliese 229B Based on Newly Determined Carbon and Oxygen Abundances of Gliese 229A
Abstract
Recently Tsuji & Nakajima (2014) and Tsuji, Nakajima, & Takeda (2015) have developed a method of molecular line spectroscopy of M dwarfs with which carbon and oxygen abundances are derived respectively from CO and H2O lines in the band. They applied this method to Gliese 229A(Gl 229A), the primary star of the brown dwarf companion, Gliese 229B(Gl 229B). The derived abundances of Gl 229A are and , which are close to the classical values of the solar abundances of carbon and oxygen. We generate model spectra of Gl 229B for the metallicity of Gl 229A as well as for the classical solar metallicity ( and ). We find that the differences of the resulting spectra are not so large for the differences of the metallicity of 0.1 dex or so, but we now discuss the spectrum of Gl 229B on the basis of the reliable metallicity. From the literature (Gizis, Reid & Hawley, 2002), the lower limit to the age of Gl 229A is found to be 0.3 Gyr. From the kinematics of Gl 229A, we evaluate the upper limit to the age of Gl 229A to be 3.0 Gyr. The observed and model spectra are compared and goodness of fit is obtained in the range of model parameters, K, and . Among the candidates that satisfy the age constraint, the best combinations of model parameters are =(800K,4.75) and (850K,5.0), while acceptable combinations are (750K,4.75),(850K,4.75) and (900K,5.0).
1 Introduction
Since its discovery in 1995, Gliese 229B (catalog ) (Gl 229B), a companion to an M dwarf, has been regarded as the prototype T dwarf (Nakajima et al., 1995; Oppenheimer et al., 1995). Although many T dwarfs have been found in the field by large surveys such as SDSS (Strauss et al., 1999; York et al., 2000), 2MASS (Burgasser et al., 1999; Skrutskie et al., 2006), UKIDSS (Warren et al., 2007; Lawrence et al., 2007) and WISE (Mace et al., 2013; Wright et al., 2010), Gl 229B remains as one of the best studied T dwarfs to date. Although the overall energy distribution of Gl 229B was reproduced by early model spectra fairly well (Tsuji et al., 1996; Marley et al., 1996; Allard et al., 1996), there were discrepancies in detail between the model and observed spectra. By these models, the effective temperature was found to be around 900K, but surface gravity and metallicity were poorly known. According to the progress of observations in late 1990’s, attempts were made to improve the models. Saumon et al. (2000) showed that [M/H]) = (870K, 4.5,-0.5), (940K, 5.0,-0.2) and (1030K, 5.5,0.0) are all acceptable combinations of the parameters, while Leggett et al. (2002) claimed that the best fit combination of the model parameters is [M/H]) = (1000K, 3.5,-0.5) which corresponds to an age of 30 Myr. Despite the accumulation of more observational data, the determination of stellar parameters is far from conclusive. In the mean time, more and more T dwarfs were discovered, and in 2006, a unified near-infrared spectral classification scheme for T dwarfs was presented by Burgasser et al. (2006). According to this scheme, Gl 229B was classified as a T7 peculiar object, and after this classification, Gl 229B appears to have been forgotten in the literature.
The metallicity and age of the primary star Gl 229A are expected to be the same as those of Gl 229B. The metallicity of Gl 229A is controversial and the derived values so far are [M/H]=+0.15 (Mould, 1978), -0.2 (Schiavon, Barbuy, & Singh, 1997), and -0.5 (Leggett et al., 2002). The age indicators are the kinematics of the young disk population and stellar activity as a flare star, and based on them Leggett et al. (2002) claimed that the age of Gl 229A could be as young as 30 Myr.
In this paper, we apply newly determined carbon and oxygen abundances of Gl 229A (Tsuji & Nakajima, 2014; Tsuji, Nakajima, & Takeda, 2015) to model the atmosphere of Gl 229B. We also reexamine the age of Gl 229A from the points of view of the kinematics and stellar activity. We then give the combinations of the good fit parameters of Gl 229B, which satisfy the age constraint.
2 Carbon and oxygen abundances of Gl 229A
The details of the determination of carbon and oxygen abundances of M dwarfs including Gl 229A are described elsewhere (Tsuji & Nakajima, 2014; Tsuji, Nakajima, & Takeda, 2015) and a brief summary is given here.
The -band echelle spectrum of Gl 229A with a resolution of 20,000 was obtained at the Subaru Telescope, using IRCS (Kobayashi et al., 2000) with the natural guide star adaptive optics. Before the spectral line analysis, Tsuji & Nakajima (2014) calculated the effective temperature and the surface gravity. The effective temperature, K was estimated from the newly derived relation, where is the absolute magnitude at 3.4 m based on the -band flux and the Hipparcos parallax. The surface gravity was estimated to be using the temperature-radius relation and mass-radius relation derived by Boyajian et al. (2012).
The new analysis of spectral lines is based on the fact that pseudo-continua are seen both on the observed and model spectra. The observed spectrum of Gl 229A is depressed by numerous weak lines of H2O, by which a pseudo-continuum is created. On the other hand, both the true- and pseudo-continuum are evaluated on the model spectrum. The pseudo-continuum on the model spectrum is generated owing to the recent H2O line database. By analyzing EWs of the CO lines affected by H2O contamination on the pseudo-continua of both observed and model spectra, the difficulty of spectral line analysis of the depressed observed continuum can be overcome.
Almost all the carbon atoms are in the form of CO molecules in the M dwarf atmosphere of Gl 229A. This situation is not changed by the changes of physical condition in the photosphere and this is the reason that the numerous CO lines are excellent abundance indicators of carbon. H2O molecules consume a large portion of oxygen left after the CO formation and they are stable in the photosphere of Gl 229A. Similarly to the determination of carbon abundance from CO lines, oxygen abundance is determined from the analysis of H2O lines.
The resultant carbon and oxygen abundances are and respectively. The carbon abundance is higher than the classical high solar abundance of , while the oxygen abundance is slightly lower than the classical high solar abundance of , and the C/O ratio of 0.680.12 is slightly higher than the solar value of 0.48 (Grevesse et al., 1991).
3 Brown Dwarf Models of Gl 229B
We compare the observed spectrum of Gl 229B between 0.8 and 5.1 m obtained from the archive by Leggett (http://staff.gemini.edu/~sleggett/LTdata.html) with a set of model spectra based on the carbon and oxygen abundances of Gl 229A. The Gl 229B spectrum in the archive is a composite of several spectra with flux calibrations based on photometry: Schultz et al. (1998) HST/STIS spectrum, retained their calibration, attached at 1.023 m to Geballe et al. (1996) spectrum flux calibrated as per Leggett et al. (1999) plus far-red spectrum fluxed by Golimowski et al. (1998) [HST 0.81 m and] 1.04 m photometry includes Oppenheimer et al. (1998) band spectrum recalibrated 2.984.15 m and Noll, Geballe, & Marley (1997) 5 m spectrum calibrated with UKIRT photometry from Golimowski et al. (2004).
To compare with the observed spectrum, we first use the model spectra in a dust free subset based on the classical C & O abundances (Ca-series based on case a abundance) from the database of the Unified Cloudy Models (UCMs: http://www.mtk.ioa.s.u-tokyo.ac.jp/~ttsuji/export/ucm2) (Tsuji, 2002, 2005). Also we newly prepare a small grid of model photospheres (without dust clouds) for the metallicity scaled to the carbon abundance of Gl 229A, i.e. all the metals are increased except for He, Li and O by dex against the classical solar abundances referred to as case a. The oxygen abundance is kept to be , the value for Gl 229A. We use these abundances to generate model spectra of (about the same as the resolution of the observed spectrum). In the brown dwarf as cool as Gl 229B, the dust layer lies deep in the atmosphere and there is not significant effect on the photospheric emission (Tsuji, 2002). Therefore the use of dust-free models is justified.
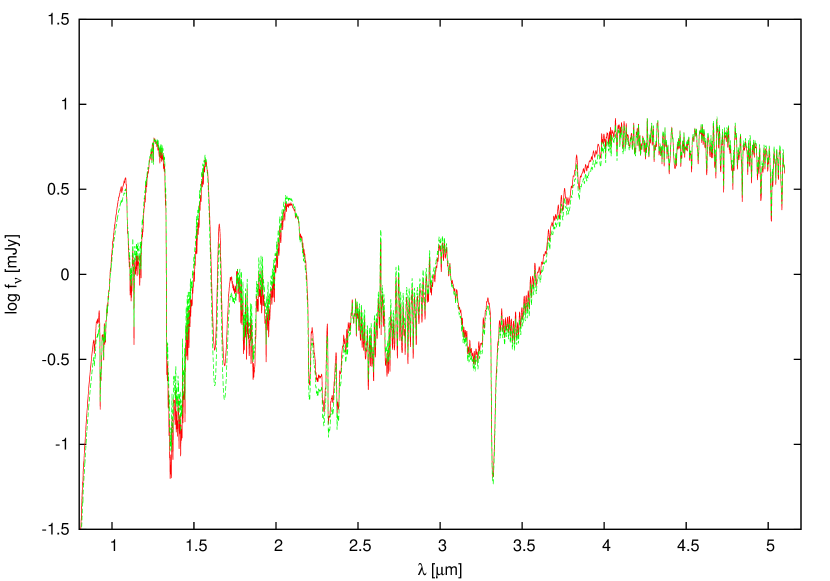
Before the comparison of the observed and model spectra, we first investigate the significance of the effect of the non-solar metallicity of Gl 229A on the Gl 229B’s spectrum by comparing the classical solar metallicity model (i.e. of & ) with the model with the metallicity of Gl 229A for =900K and =5.0. Inspection of Figure 1 reveals that CH4 bands (at 1.6, 2.3, & 3.5 m) are slightly stronger while H2O bands (1.4, 1.8, & 2.7 m) are slightly weaker in the model based on the metallicity of Gl 229A, as expected for the increased carbon and decreased oxygen. The differences of the spectra, however, are not very large at the resolution as low as 600. In the discussion below, we always use the models with the metallicity of Gl 229A, but the differences of the spectra based on the classical solar metallicity and on the metallicity of Gl 229A shown in Figure 1, generally result in the same model parameters, since the effect of metallicity difference of 0.1 dex or so on the low resolution spectra is rather modest. Thus we confirm that the abundance of Gl 229B is not much different from the classical solar abundance, and this is an advantage, since the evolutionary models we use to interpret the spectra (Burrows et al., 2001) are calculated only for the solar metallicity.
The limitations of the model and observed spectra should also be noted before their comparison. The -band methane absorption in the model spectra is calculated by a band model and the agreement with the observed spectrum at this portion of the spectrum is not so good. The -band methane absorption in the model spectra is calculated by a line list. However the quality of the line list is not so great and the agreement of the model and observed spectra at this portion (m) is not so good either. The model spectra are based on equilibrium chemistry and a feature related to disequilibrium chemistry, the 4.6 m CO fundamental band (Noll, Geballe, & Marley, 1997) is not reproduced. On the other hand, the CO absorption feature in the observed spectrum is very noisy and it cannot be analyzed simultaneously with other features. Signal-to-noise ratios at individual data points of the observed spectrum are unknown and the test based on the absolute value of is not possible.
Because of the limitations mentioned above, we focus our attention to good portions of the observed and model spectra, namely, wavelength segments at (m), (), ) and the red wing of -band methane feature(m) for which a line list (R. Freedman, private communication) is available for modeling. Since we do not know the signal-to-noise ratio of each data point, as proxy for a , we define a relative reduced , by assigning a constant signal-to-noise ratio, as
| (1) |
where indicates the th data point and is the number of data points. Since , , where is the standard deviation, which is unknown like . There is no significance in the value of . Since we are dealing with only one object Gl 229B, the usefulness of the relative reduced is justified. There are 1416 data points in all and the fitting parameter is the radius of the model brown dwarf.
A wide range of parameter space is explored in the model fitting. We calculate 30 model spectra with and 1000K and with = 4.5, 4.75, 5.0, 5.25 and 5.5. The results of model parameters and goodness of fit, are given in Table 1. From the radius obtained by fitting and of a model brown dwarf, its mass is derived.
The bolometric luminosity of Gl 229B has three determinations. Combining spectroscopic and photometric data from 0.82 to 10 m, Matthews et al. (1996) found . With their own photometry, Leggett et al. (1999) obtained . From a recalibration using the photometry of Golimowski et al. (1998), Saumon et al. (2000) found . We here adopt the mid value of the bolometric luminosity and the evolutionary models by Burrows et al. (2001) to estimate the ages of the model brown dwarfs, which are given in the column 5 of Table 1.
4 Age of Gl 229A
4.1 Kinematics of Gl 229A
The space velocity of Gl 229A is in units of kms-1. The solar motion in the Local Standard of Rest (LSR) frame of reference is (Dehnen & Binney, 1998) and the velocity of Gl 229A in the LSR frame is kms-1, which is significantly smaller than the LSR velocity of the average disk population of kms-1 (Gilmore & Zeilik, 1999). Leggett (1992) classified this star as a young-disk star, which is reasonable from the value of the LSR velocity.
A quantitative estimate of the age is possible if we assume that the present LSR velocity of Gl 229A is produced by a stochastic process in the galactic disk. The total velocity dispersion (kms-1) in the LSR frame, as a function of stellar age (Gyr), is described by
| (2) |
where is 5 Gyr (Gilmore & Zeilik, 1999).
The fraction of stars with random velocities smaller than for a given velocity dispersion , , is given by the isotropic Boltzmann distribution,
| (3) |
The values of are given for and in Table 2. According to the table, the probability that Gl 229A is actually younger than 3.0 Gyr is = 94%. We adopt 3.0 Gyr as the upper limit to the age of Gl 229A.
4.2 Stellar activity of Gl 229A
While Gl 229A is shown to flare, the time-integrated energy in flare light is very much lower than for ‘normally active’ flare stars. M dwarfs with high chromospheric activity show Balmer lines in emission, while Gl 229A shows Balmer lines in absorption indicating a low level of chromospheric activity (Byrne, Doyle & Menzies, 1985). The stellar activity indicates that Gl 229A is not extremely young, but not so old. As a quantitative analysis, Gizis, Reid & Hawley (2002) obtained a lower limit to the age of Gl 229A, based on the absence of H emission and their argument is summarized in the following.
The analysis of M dwarfs in open clusters by Hawley, Reid & Tourtellot (1999) suggests an approach to an age-activity relation. While the activity levels of stars in a given cluster exhibit considerable scatter, there is a well-defined color at which activity becomes ubiquitous. All stars redder than this color are dMe (defined as EW(H)Å), while the bluer stars are dM without emission. Observations exist for M dwarfs in six clusters: IC2602 and IC2391(30 Myr), NGC 2516 and Pleiades (125 Myr), Hyades (625 Myr), and M67 (4.0 Gyr). Hawley, Reid & Tourtellot (1999) have used these observations to determine the relationship between the “H limit” color and the age,
| (4) |
where is the age in Gyr. For Gl 229A, Gizis, Reid & Hawley (2002) used H absorption and to derive the lower limit to the age, 0.32 Gyr. Based on this age limit, Gizis et al. rule out the young age of 30 Myr advocated by Leggett et al. (2002) and suggest that the synthetic spectra from model atmospheres are not yet adequate for age determinations. We adopt 0.3 Gyr as the lower limit to the age of Gl 229A, taking into account the error in the use of instead of .
5 Interpretation of Models of Gl 229B
From the previous section, we have given the range of the age of Gl 229A to be between 0.3 and 3.0 Gyr. In the column 7 of Table 1, whether a model satisfies this age constraint or not is given by Y or N. The highest gravity models for are all ruled out, because the model brown dwarfs for K are more massive than the hydrogen burning limit and the model brown dwarfs for K and 1000K are older than 3 Gyr. The relative reduced , is given in the column 6 and the ranking of the goodness of fit(GOF) is given by A, B, and C in the column 8.
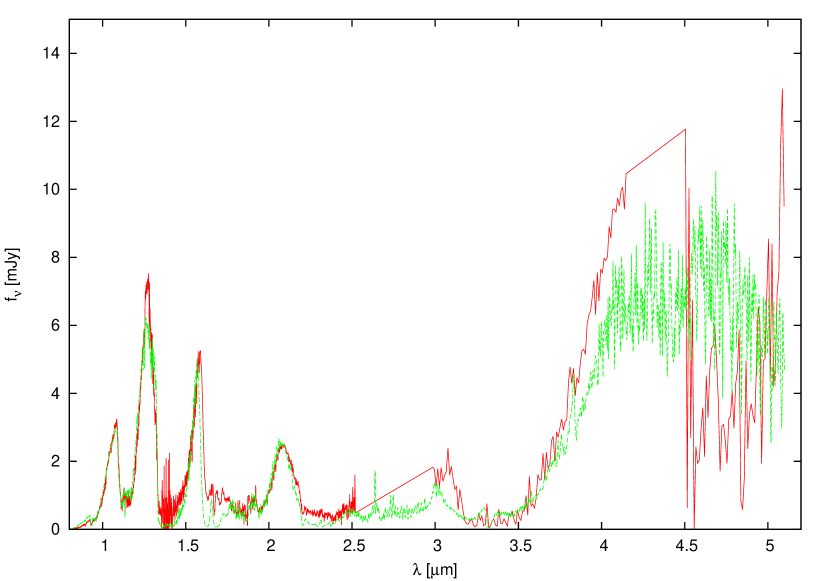
There are two models which satisfy the age constraint(Y), and GOF=A, whose physical parameters are = (800K,4.75,0.028,1.1Gyr) and (850K,5.0,0.037,2.3Gyr). These are the best fit models of all, and the spectrum for the former model is plotted in Figure 2.
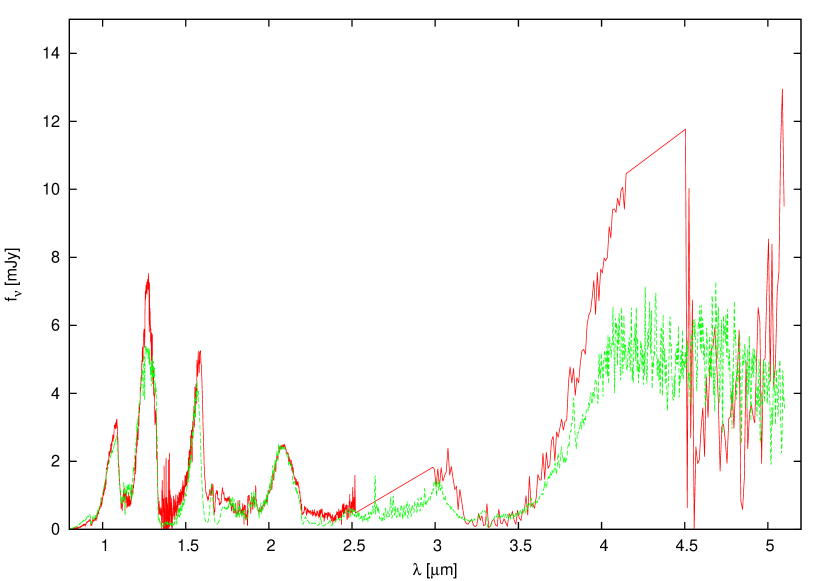
There are three models with (age constraint, GOF)=(Y,B). Their physical parameters are = (750K,4.75,0.038,2.5Gyr),(850K,4.75,0.021,0.70Gyr), and (900K,5.0,0.028,1.1Gyr). We consider that these models are still good fit to the observation. As an example, the spectrum for the parameters, (900K,5.0,0.028,1.1Gyr) is plotted in Figure 3.
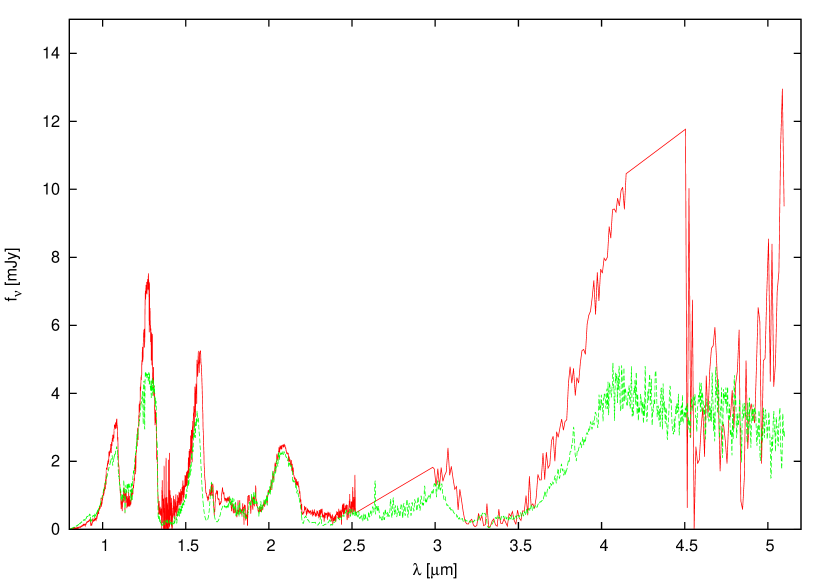
The rest of the seven models which satisfy the age constraint are ranked C. There is no (Y,A) or (Y,B) models for 950 and 1000K. The high temperature models apparently fit poorly compared to the models for lower temperatures. As an example of the poor fit models, the spectrum for parameters,(1000K,5.0,0.016,0.48Gyr), is plotted in Figure 4
To summarize, we consider that the spectra for (Y,A) models are the best fits and those for (Y,B) models are reasonable fits to the observed spectrum. In terms of the effective temperature and surface gravity, ()=(800K,4.75) and (850K,5.0) are the best fit parameters, while (750K,4.75),(850K,4.75) and (900K,5.0) are still acceptable model parameters.
6 Comparison with Other Works
6.1 Metallicity of Gl 229A
As far as we are aware, there have been three determinations of the metallicity of Gl 229A. Mould (1978) obtained high resolution spectra of and band using the Fourier Transform Spectrometer at KPNO with a resolution . He analyzed Al, Ca, and Mg lines and found [M/H]=+0.15. The effective temperature and the surface gravity he adopted are K and respectively, which are in good agreement with the estimates K and by Tsuji & Nakajima (2014).
Schiavon, Barbuy, & Singh (1997) obtained [Fe/H]=-0.2 by the analysis of the FeH Wing-Ford band at around 1 m from a medium resolution spectrum of . The effective temperature of their best fit model of K is significantly lower than the estimate by Tsuji & Nakajima (2014). The two determinations of the metallicity (Mould, 1978; Schiavon, Barbuy, & Singh, 1997) are both consistent with solar metallicity (within the error bars).
Leggett et al. (2002) fit with model atmospheres a spectrum covering from 0.8 to 2.5 m with a resolution and a spectrum covering from 1.12 to 1.22 m with a resolution . Best fit model parameters are , [M/H]) = (3700K, 4.0, -0.5) and (3700K, 3.5, -0.7). Although the effective temperature is in good agreement with our estimate, and [M/H] are significantly lower than our values and [C/H] = +0.13. The metallicity obtained by Leggett et al. (2002) is definitely lower than solar metallicity. The application of evolutionary models implies that the age of Gl 229A is as young as 30 Myr. As mentioned in Section 4.2, Gizis, Reid & Hawley (2002) rule out this young age and suggest that the problem is in the model spectra by Allard et al. (2001) used by Leggett et al. (2002).
6.2 Metallicity of Gl 229B
Saumon et al. (2000) do not use any information about Gl 229A and their abundance analysis is based on the bolometric luminosity of Gl 229B alone. Since is known, a determination of the surface gravity fixes , the radius, the mass, and the age of Gl 229B, as well as the metallicity. It is assumed that evolutionary models for solar metallicity (Burrows et al., 1997) are applicable for non solar metallicity. They fit the observed and model spectra by eye. They analyze the “red” spectrum from 0.83 to 1 m (), , , and spectra separately, and derive the H2O abundances, or [O/H]s. They interpret [O/H] as the metallicity [M/H]. No over-all fitting from 0.8 to 5 m is given. For a given , the optimal [M/H] was obtained out of a set of four [M/H]s for different wavelength bands. For three values of , they generated three models (ABC) with optimal parameters: (, , [M/H]) = A(870K, 4.5,-0.5), B(940K,5.0,-0.3) and C(1030K, 5.5,-0.1). They quote the error in abundance to be . In terms of the metallicity the model C is the closest to our models, but is out of the range. The compromise is the model B for which the counterpart of our model is (, , [M/H]) =(900K,5.0,+0.13).
Leggett et al. (2002) use the 0.844.15 m spectra for Gl 229B taken from Leggett et al. (1999) and also use the 4.55.1 m spectrum from Noll, Geballe, & Marley (1997) to fit with the model spectra by eye. The best fit model parameters are (, . [M/H]) = (1000K, 3.5, -0.5). Although the metallicity [M/H]=-0.5 is in agreement with the value obtained by Saumon et al. (2000), the surface gravity =3.5 is extremely small. The inspection of the best fit model spectra in comparison with the observed spectrum reveals significant discrepancies in , , and bands. These discrepancies are much greater than those seen in our fitting of bands. The H2O line list used by Allard et al. (2001) is of Partridge & Schwenke (1997), while that by us is of the BT2-HITEMP2010 database (Barber et al., 2006; Rothman et al., 2010). However, the effect of line lists may be minor at low resolution. Higher resolution spectra at , , and bands (Saumon et al., 2000) are also fitted by Leggett et al. (2002) with the best fit model spectra obtained from the analysis at the lower resolution. Although the H2O line list used by Saumon et al. (2000) was the same as that by Allard et al. (2001), the fit by Saumon et al. (2000) is significantly better especially at and bands. We suspect that the adopted by Leggett et al. (2002) is not adequate and consider that the range of adopted by Saumon et al. (2000) is more appropriate.
7 Disequilibrium Chemistry
Our analysis is based on equilibrium chemistry and we do not analyze the 4.6 m CO fundamental band. However, the effects of disequilibrium chemistry can be important for T dwarfs (Noll, Geballe, & Marley, 1997; Oppenheimer et al., 1998; Griffith & Yelle, 1999; Saumon et al., 2000; Visscher & Moses, 2011; Zahnle & Marley, 2014) and we briefly mention here the effect of the Gl 229B metallicity on the CO abundance estimation. In general, higher gravities, cooler temperatures and lower metallicity favor CH4 vs. CO. Some workers estimate CO abundances, assuming low metallicity ([M/H]) (Noll, Geballe, & Marley, 1997; Visscher & Moses, 2011), while others give CO abundances for low ([M/H]) and solar metallicity (Griffith & Yelle, 1999; Saumon et al., 2000). Since the carbon abundance we adopt is [C/H] = +0.13 (Tsuji & Nakajima, 2014), CO abundances derived for solar metallicity are of our interest. Griffith & Yelle (1999) estimate for [M/H]=0.0, while Saumon et al. (2000) give for [M/H]=. These values are significantly higher than for example obtained by Noll, Geballe, & Marley (1997).
8 Concluding remark
It has been two decades, since the discovery of Gl 229B as the first genuine brown dwarf in 1995. It had been the only known T dwarf, before a small number of field T dwarfs were discovered in 1999. As the prototype T dwarf, Gl 229B was studied intensively until early this century and efforts were made to determine its physical properties. There are two approaches in the determination of physical properties; one is to derive , and [M/H] all from the model fitting of the Gl 229B spectrum itself and the other is to derive and from the model fitting of the Gl 229B spectrum, but use [M/H] obtained from the spectrum of the primary star, Gl 229A. Although the latter approach is favorable because of the fewer parameters in the model fitting of the Gl 229B spectrum, it was deemed difficult because Gl 229A is an M dwarf. It was not until recently that the metallicity (abundances of C and O) was determined reliably. We used these newly determined C and O abundances of Gl 229A in the model fitting of the Gl 229B spectrum. In addition to the metallicity, the ages of the binary components are safely assumed to be the same. We estimated the range of the age of Gl 229A based on its activity and kinematics. This age constraint narrowed the combinations of physical parameters of acceptable models using the evolutionary models of brown dwarfs. It took twenty years to settle the question of physical properties of Gl 229B, although early guesses assuming the solar metallicity were not so bad.
References
- Allard et al. (1996) Allard, F., Hauschildt, P. H., Baraffe, I., & Chabrier, G. 1996, ApJ, 465, L123
- Allard et al. (2001) Allard, F., Hauschildt, P. H., Alexander, D. R., Tamanai, A., & Schweitzer, A. 2001, ApJ, 556, 357
- Barber et al. (2006) Barber, R. J., Tennyson, J., Harris, G. J., & Tolchenov, R. N. 2006, MNRAS, 368, 1087
- Boyajian et al. (2012) Boyajian, T. S. et al. 2012, ApJ, 757, 112
- Burgasser et al. (1999) Burgasser, A. J. et al. 1999, ApJ, 522, L65
- Burgasser et al. (2006) Burgasser, A. J., Geballe, T. R., Leggett, S. K., Kirkpatrick, J. D., & Golimowski, D. A. 2006, ApJ, 637, 1067
- Burrows et al. (1997) Burrows, A. et al. 1997, ApJ, 491, 856
- Burrows et al. (2001) Burrows, A., Hubbard, W. B., Lunine, J. I., & Liebert, J. 2001, Rev. Mod. Phys., 73, 719
- Byrne, Doyle & Menzies (1985) Byrne, P. B., Doyle, D. G., & Menzies, J. W. 1985, MNRAS, 214, 119
- Dehnen & Binney (1998) Dehnen, W., & Binney, J. 1998, MNRAS, 298, 387
- Geballe et al. (1996) Geballe, T. R., Kulkarni, S. R., Woodward, C. E., & Sloan, G. C. 1996, ApJ, 467, L101
- Gilmore & Zeilik (1999) Gilmore, G. F., & Zeilik, M. 1999, Allen’s Astrophysical Quantities, A. N. Cox, New York, AIP & Springer, 494
- Gizis, Reid & Hawley (2002) Gizis, J. E., Reid, I, N, & Hawley, S. L. 2002, AJ, 123, 3356
- Golimowski et al. (1998) Golimowski, D. A., Burrows, C. J., Kulkarni, S. R., Oppenheimer, B. R., & Brukardt, R. A. 1998, AJ, 115,2579
- Golimowski et al. (2004) Golimowski et al. 2004. AJ, 127, 3516
- Grevesse et al. (1991) Grevesse, N., Lambert, D. L., Sauval, A. J., van Dishoeck, E. F., Farmer, C. B., & Norton, R. H. 1991, A&A, 242, 488
- Griffith & Yelle (1999) Griffith, C. & Yelle, R. 1999, ApJ, 519, L85
- Hawley, Reid & Tourtellot (1999) Hawley, S. L., Reid, I. N. & Tourtellot, J. G. 1999, in Very Low Mass Stars and Brown Dwarfs, ed. R. Rebolo & M. R. Zapatero-Osorio (Cambridge: Cambridge Univ. Press), 109
- Kobayashi et al. (2000) Kobayashi, N. et al. 2000, Proc. SPIE, 4008, 1056
- Lawrence et al. (2007) Lawrence A. et al. 2007, MNRAS, 379, 1599
- Leggett (1992) Leggett, S. K., 1992, ApJS, 82, 351
- Leggett et al. (1999) Leggett, S. K., Toomey, D. W., Geballe, T. R., & Brown, R. H. 1999, ApJ, 517, L139
- Leggett et al. (2002) Leggett, S. K., Hauschildt, P. H., Allard, F., Geballe, T. R., & Baron, E. 2002, MNRAS, 332, 78
- Mace et al. (2013) Mace, G. N. et al. 2013, ApJS, 205, 6
- Marley et al. (1996) Marley, M. S., Saumon, D., Guillot, T., Freeman, R. S., Hubbard, W. B., Burrows, A., & Lunine, J. I. 1996, Science, 272, 1919
- Matthews et al. (1996) Matthews, K., Nakajima, T., Kulkarni, S. R., & Oppenheimer, B. R. 1996, AJ, 112, 1678
- Mould (1978) Mould, J. R. 1978, ApJ, 226, 923
- Nakajima et al. (1995) Nakajima, T., Oppenheimer, B. R., Kulkarni, S. R., Golimowski, D. A., Matthews, K., & Durrance, S. T. 1995, Nature, 378, 463
- Noll, Geballe, & Marley (1997) Noll, K. S., Geballe, T. R., & Marley, M. S. 1997, ApJ, 489, L87
- Oppenheimer et al. (1995) Oppenheimer, B. R., Kulkarni, S. R., Matthews, K. & Nakajima, T. 1995, Science, 270, 1478
- Oppenheimer et al. (1998) Oppenheimer, B. R., Kulkarni, S. R., Matthews, K., & van Kerkwijk, M. H. 1998, ApJ, 502, 932
- Partridge & Schwenke (1997) Partridge, H., & Schwenke, D. W., 1997, J. Chem. Phys., 106, 4681
- Rothman et al. (2010) Rothman, L. S. et al. 2010, JQSRT, 111,2139
- Saumon et al. (2000) Saumon, D., Geballe, T. R., Leggett, S. K., Marley, M. S., Freeman, R. S., Lodders, K., Fegley, B. Jr., & Sengupta, S. K. 2000, 541, 374
- Schiavon, Barbuy, & Singh (1997) Schiavon, R. P., Barbuy, B., & Singh, P. D. 1997, ApJ, 484, 499
- Schultz et al. (1998) Schultz, A. B. et al. 1998, ApJ, 492, L181
- Skrutskie et al. (2006) Skrutsukie, M. F. et al. 2006, AJ, 131, 1163
- Strauss et al. (1999) Strauss, M. A., et al. 1999, ApJ, 522, L61
- Tsuji (2002) Tsuji, T. 2002, ApJ, 575, 264
- Tsuji (2005) Tsuji, T. 2005, ApJ, 621, 1033
- Tsuji et al. (1996) Tsuji, T., Ohnaka, K., Aoki, W., & Nakajima, T. 1996, A&A, 308, L29
- Tsuji & Nakajima (2014) Tsuji, T., & Nakajima, T. 2014, PASJ, 66, 98
- Tsuji, Nakajima, & Takeda (2015) Tsuji, T., Nakajima, T., & Takeda, Y. 2015, PASJ, 67, 26
- Visscher & Moses (2011) Visscher, C. & Moses, J. I., 2011, ApJ, 738, 72
- Warren et al. (2007) Warren, S. J. et al. 2007, MNRAS, 381, 1400
- Wright et al. (2010) Wright, E. L. et al. 2010, AJ, 140, 1868
- York et al. (2000) York, D. G. et al. 2000, AJ, 120, 1579
- Zahnle & Marley (2014) Zahnle, K. J. & Marley, M. S. 2014, ApJ, 797, 41
| aaRelative reduced | GOFbbRanking of goodness of fit based on relative reduced . A(0.07), B(0.070.075), and C(0.075). | ||||||
|---|---|---|---|---|---|---|---|
| K | Gyr | ||||||
| 750 | 4.50 | 0.136 | 0.021 | 0.70 | 0.0764 | Y | C |
| 4.75 | 0.137 | 0.038 | 2.5 | 0.0716 | Y | B | |
| 5.00 | 0.137 | 0.068 | 10 | 0.0738 | N | B | |
| 5.25 | 0.137 | 0.122 | — | 0.0781 | N | C | |
| 5.50 | 0.137 | 0.216 | — | 0.0903 | N | C | |
| 800 | 4.50 | 0.116 | 0.016 | 0.47 | 0.0752 | Y | C |
| 4.75 | 0.117 | 0.028 | 1.1 | 0.0696 | Y | A | |
| 5.00 | 0.118 | 0.051 | 4.3 | 0.0673 | N | A | |
| 5.25 | 0.118 | 0.090 | — | 0.0685 | N | A | |
| 5.50 | 0.118 | 0.161 | — | 0.0748 | N | B | |
| 850 | 4.50 | 0.099 | 0.011 | 0.20 | 0.0802 | N | C |
| 4.75 | 0.100 | 0.021 | 0.70 | 0.0730 | Y | B | |
| 5.00 | 0.101 | 0.037 | 2.3 | 0.0682 | Y | A | |
| 5.25 | 0.101 | 0.066 | 10 | 0.0667 | N | A | |
| 5.50 | 0.102 | 0.120 | — | 0.0705 | N | B | |
| 900 | 4.50 | 0.086 | 0.009 | 0.10 | 0.0889 | N | C |
| 4.75 | 0.087 | 0.016 | 0.47 | 0.0796 | Y | C | |
| 5.00 | 0.088 | 0.028 | 1.1 | 0.0732 | Y | B | |
| 5.25 | 0.088 | 0.050 | 4.3 | 0.0692 | N | A | |
| 5.50 | 0.089 | 0.091 | — | 0.0691 | N | A | |
| 950 | 4.50 | 0.075 | 0.006 | 0.06 | 0.1010 | N | C |
| 4.75 | 0.076 | 0.012 | 0.24 | 0.0900 | N | C | |
| 5.00 | 0.077 | 0.022 | 0.75 | 0.0817 | Y | C | |
| 5.25 | 0.077 | 0.038 | 2.5 | 0.0764 | Y | C | |
| 5.50 | 0.078 | 0.070 | 10 | 0.0739 | N | C | |
| 1000 | 4.50 | 0.066 | 0.005 | 0.04 | 0.1145 | N | C |
| 4.75 | 0.067 | 0.009 | 0.13 | 0.1019 | N | C | |
| 5.00 | 0.067 | 0.016 | 0.48 | 0.0935 | Y | C | |
| 5.25 | 0.068 | 0.030 | 1.5 | 0.0846 | Y | C | |
| 5.50 | 0.069 | 0.055 | 4.9 | 0.0803 | N | C |
| aa is the fraction of stars whose velocities generated by a stochastic process are smaller than The probability that a star is younger than the age is given by . | ||
|---|---|---|
| Gyr | kms-1 | |
| 0.5 | 21 | 0.312 |
| 1.0 | 27 | 0.172 |
| 1.5 | 31 | 0.121 |
| 2.0 | 35 | 0.088 |
| 3.0 | 41 | 0.057 |
| average disk | 43 | 0.050 |