Formation and growth of shear bands in glasses: existence of an underlying directed percolation transition
Abstract
The response of glasses to mechanical loading often leads to the formation of inhomogeneous flow patterns. Among them, shear bands, associated with strain localization in form of band-like structures, are ubiquitous in a wide variety of materials, ranging from soft matter systems to metallic alloys. They can be precursors to catastrophic failure, implying that a better understanding of the underlying mechanisms of shear banding could lead to the design of smarter materials. Here, molecular dynamics simulations are used to reveal the formation of shear bands in a binary Lennard-Jones glass, subject to a constant strain rate. At a critical strain, this system exhibits for all considered strain rates a transition towards the formation of a percolating cluster of mobile regions. We give evidence that this transition belongs to the universality class of directed percolation. Only at low shear rates, the percolating cluster evolves into a transient (but long-lived) shear band with a diffusive growth of its width.
Introduction. An external shear field leads in general to a rejuvenation of the glass state, transforming the amorphous solid into a flowing fluid rodneyrev2011 ; barratlemaitrerev . Under a constant strain rate, the transition to plastic flow can be located via the dependence of the shear stress on the applied strain. It is marked by a maximum in the stress-strain relation which for a simple planar Couette flow geometry occurs typically at a strain of the order of 0.1 barratlemaitrerev ; zausch08 ; falk-maloney-2010 ; knowlton . Beyond this maximum, the system evolves into a steady-state regime where the system displays a homogeneous flow pattern, e.g. in the case of planar Couette flow manifested as a linear velocity profile. However, the strain necessary to reach this steady-state regime depends on many factors such as the history of the initial undeformed glass state and the applied strain rate moorcroft-cates-fielding-11 ; varnik04 . In the transient regime before the steady state is reached, the occurrence of spatially inhomogeneous flow patterns is very common. Often, such inhomogeneous response leads to the formation of shear bands, with co-existing regions of contrasting mobilities spanning large scales schuhrev . Even when the mechanical loading is switched off, the shear-band regions can be imprinted as frozen-in structures in the resulting solid and thus strongly affect its material properties wilde11 ; zhang-wang-greer-06 . Therefore, the microscopic understanding of the formation and growth of shear bands in glassy solids is a highly-debated issue in material science.
Despite the fact that shear banding is ubiquitous in amorphous materials mb08 ; schuhrev ; fs14 ; gm13 ; divouxrev15 , the microscopic processes that lead to the formation of such complex structures still remain ill understood. Unlike the case of micellar systems or granular materials, where shear bands mainly form in the regime of large applied shear rates, driven by a coupling between structures and external shear sh10 ; ir14 ; fs14 ; mb12 , the scenario in glasses seems to be different. The inhomogeneous response in the case of amorphous solids tends to be observed at small shear rates, with the spatio-temporal extent becoming more prominent as one approaches the yielding threshold rodneyrev2011 ; barratlemaitrerev ; chboc12 ; mb11 . And, so far, there is no indication of any underlying macroscopic mechanical instability driving the formation of shear bands. While there have been several observations in experiments vp11 ; bp10 , numerical simulations vb03 ; sf06 ; bailey06 ; ch13 ; ratul-procaccia-12 and phenomenological models moorcroft-fielding-13 ; damienroux2011 , a quantitative analysis that allows to predict the conditions under which shear bands form in glasses is lacking.
The question about the origin of shear bands is intimately related to the question how flow is initiated in an amorphous solid under applied shear. Recent studies suggest that the response of the glass to the applied strain is governed by local heterogeneities that are either already present in the undeformed solid or form during the initial application of the shear field rodneyrev2011 ; barratlemaitrerev ; falk-maloney-2010 . These heterogenities are associated with “hot spots” of higher mobility that grow while the strain of the system increases clement12 ; sentja15 . For athermal amorphous systems, evidence has been given that the transition towards plastic flow is provided by an avalanching of the mobile hot spots lemaitrecaroli09 ; bl07 ; smarajit-procaccia-10 . Imprints of that have also been reported in thermal systems chattoraj2010 ; hentschel10 . In fact, such avalanching is well-known in the context of self-organized criticality btw88 . A prominent example is the sandpile model btw88 . Recently, it has been shown that a driven version of this model belongs to the directed percolation (DP) universality class basu14 . In fact, as put forward by the DP conjecture janssen81 ; grassberger82 , DP universality is believed to be very robust, applying to a broad class of non-equilibrium phase transitions hh00 .
Thus – although not addressed so far – it is a natural question whether the onset of flow in a sheared glass is linked to a DP transition. In this work, we show that this indeed the case and thereby we elucidate the microscopic mechanism that leads to the formation and growth of shear bands in glassy systems.
Using a model glass forming system, we use large-scale molecular dynamics simulations to study the mechanical response of a quiescent amorphous solid when an external shear rate is imposed on it. We track the locations of regions of large mobilities and thereby we reveal the existence of the DP transition driven in the direction of applied shear. While the DP transition is seen for all shear-rates, visible shearbanding only only for small shear rates near the yielding threshold. We demonstrate that the glass eventually fluidizes by the long-time diffusive invasion of the shear band into the rest of the system, with the diffusion timescales dependent on the imposed shear rates. Thus, we provide a quantitative description of how initial local mobilities build up to the eventual macroscopic flow of the material.
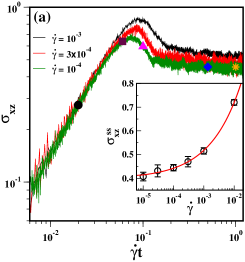
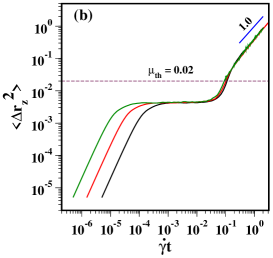
Results. When the shear is applied to the quiescent glass at , the material deforms exhibiting the typical stress () vs. strain () response [shown in Fig. 1(a) for different imposed shear rates ] with the height of the overshoot depending on varnik04 . The measured steady-state stress as a function of the imposed shear rate is shown in the inset of Fig. 1(a); it has the typical Herschel-Bulkley form varnik04 . The corresponding single particle dynamics, during this onset of flow, can be quantified by measuring the non-affine mean-squared displacement (MSD), , in the direction transverse to the applied shear; the data is shown in Fig. 1(b). The particles undergo ballistic motion at early times and are then caged, before the occurrence of a super-diffusive regime, prior to diffusion. The onset of super-diffusion occurs around the stress overshoot in the stress-strain curve, when the built-up stress is released via the particles breaking their local cages to subsequently diffuse zausch08 .
 |
 |
 |
 |
 |
 |
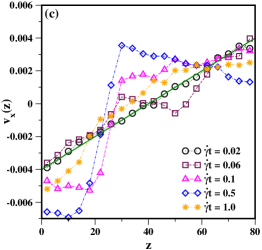
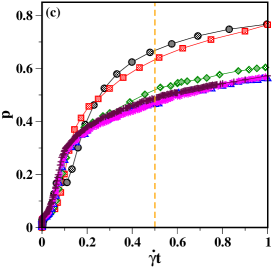
In experiments, flow heterogeneities are often diagnosed via the spatial profiles of local velocities bp10 ; divouxprl10 . Similarly, we measure the spatial profiles of the local flow velocities (averaged over strain intervals of ), , for an imposed shear rate of , at different times after the imposition of shear (marked on the corresponding stress-strain curve in Fig. 1(a)). The spatial profiles are shown in Fig. 1(c) for one of the initial states in our ensemble. In the elastic regime, at , the velocity profile is linear, but starts deviating from this shape as the stress overshoot is approached at . This deviation becomes stronger in the transient regime (at , shown in blue diamonds). Interestingly, the velocity profile regains its linear shape as plastic flow sets in (at , shown in orange stars). The observation of increased heterogeneity, after the stress-overshoot, is consistent with experimental observations divouxprl10 .
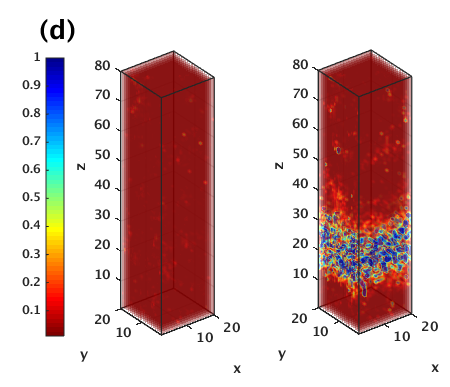
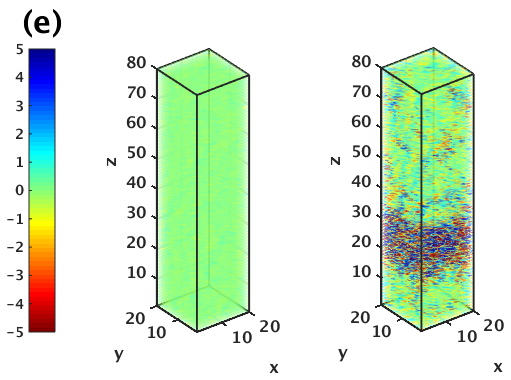
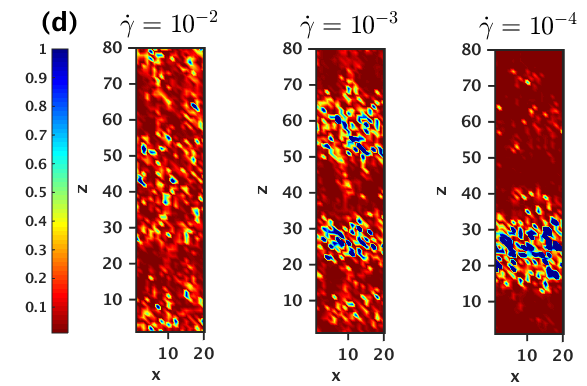
However, local velocity profiles only capture the short-time heterogeneities in dynamics. In order to obtain a more cumulative picture from , we look at the spatially resolved maps of ch13 ; ch14 , by dividing the system into small cells (see Methods for more details). In Fig. 1(d), we show the time-evolution of such a map, for an initial state under the imposed shear rate of . At a strain of , the local dynamics is nearly homogeneous on this scale. However, at , spatially heterogeneous dynamics is observed, with the more mobile particles localised in a shear-band-like structure spanning the plane. We can also construct similar maps of local strain (), which exhibit a localisation behaviour similar to the MSD maps; see Fig. 1(e). Thus, large local MSDs are also regions of large strains. Henceforth, we use to analyse local dynamical properties.
 |
 |
 |
 |
In order to quantify and characterise the spatio-temporal evolution of the mobile regions, we define a region to be mobile or not, by setting a threshold on the local . As marked by the dashed line in Fig. 1(c), such a choice of is larger than the plateau value in the MSD and thus corresponds to motions beyond cage-breaking note . We then define the local mobility as
| (1) |
where is the average MSD of particles in a sub-box. Following this convention, we digitize the whole system into mobile and immobile regions. The mobility maps corresponding to Fig. 1(d) are shown in Fig. 1(f).
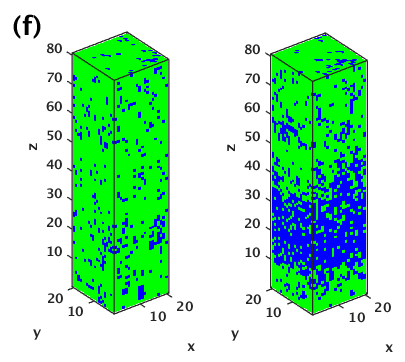
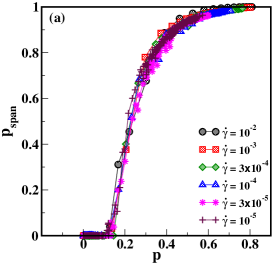
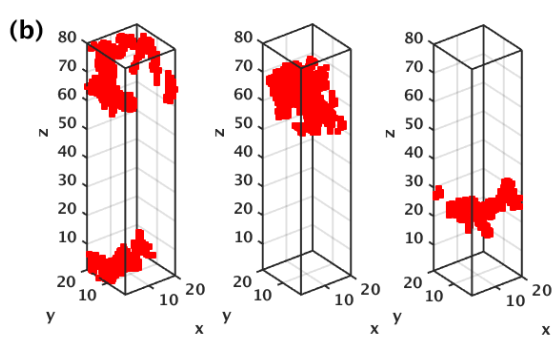
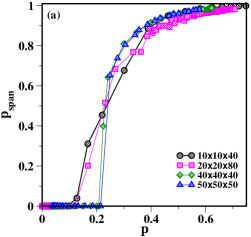
We now demonstrate that a percolation transition occurs with increasing strain, involving these mobile regions. As the system evolves under the applied shear rate, we monitor the fraction of mobile cells, , at any given instant. Figure 1(d) suggests that such mobile regions do form clusters. Thus, we compute what fraction of these mobile regions, , is part of a cluster that spans the system, recalling that such an observable is the order parameter for determining the occurrence of a percolation transition. In Fig. 2(a), we plot as a function of , which shows that beyond a critical fraction , all the mobile cells are part of such a spanning cluster. This indicates the occurrence of a percolation transition of these mobile cells. Furthermore, we observe that the variation of is nearly independent of the imposed shear-rate, as seen in Fig. 2(a) for a wide range of . Thus, the percolation process is generic to the system’s response under shear. In Fig. 2(b), we visualise the spanning clusters for three different shear rates, at the corresponding to each , starting from the same initial state. Here, we note that the spanning across the system-size occurs in the direction of flow, which we discuss further later.
Next, for different imposed , if we monitor the numerical growth of mobile cells with increasing strain, a distinct variation is revealed; see Fig. 2(c). For example, at a strain of (marked by orange dotted line), we see that around of the sites are mobile at low strain rates while the same is close to at high strain rates. This implies that subsequent to the percolation transition (at the critical strain corresponding to , which is around for ), the spatial heterogeneity of activity is more long-lived for smaller strain rates, as is shown in Fig. 2(c), via cuts in the plane of the local MSD maps corresponding to the evolving trajectories of the states shown in Fig. 2(b). While for the largest shear-rate, mobile regions proliferate in the system, for the smaller shear-rate it is more localised and takes the form of a well-structured shear band. Thus, one can infer that the local dynamics, post-percolation, changes with decreasing shear-rate.
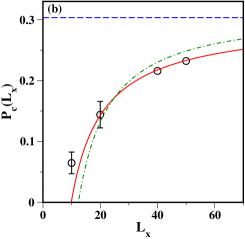
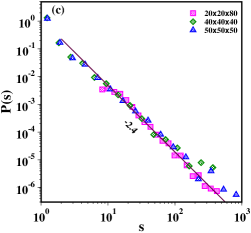
To clarify the nature of the percolation transition, we determine the critical point for the percolation process, , using finite size scaling. In Fig. 3(a), we show how varies with for four different system sizes - we observe that the onset of percolation shifts to larger values of with increasing system size. By fitting the obtained threshold for different system sizes, using the finite size scaling function (see Fig. 3(b), red line), we obtain an estimate of and the exponent , which corresponds to a DP transition wd13 . To compare, the corresponding numbers for standard percolation are () and (); the finite-size scaling function using these parameters does not fit our data (see Fig. 3(b), green line). Furthermore, we compute the size distribution of clusters of mobile cells in the vicinity of the percolation transition (Fig. 3(c)). As expected, the distribution has a power-law shape, with the corresponding DP exponent of well characterising the distribution carvalho88 ; mz99 . Thus, the percolation of the active regions, in this regime of flow, is a directed process, driven in the direction of the external shear.
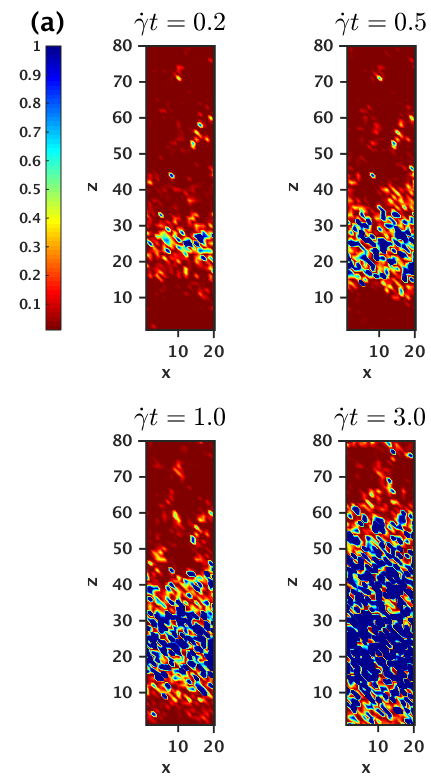
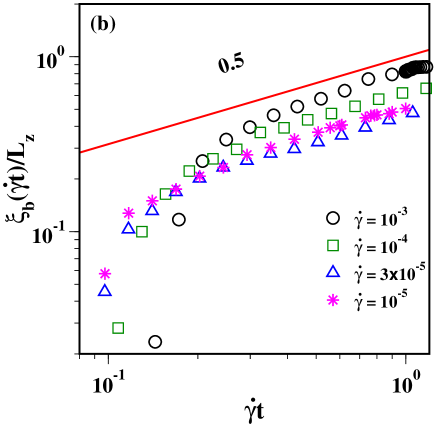
Thus far, we have discussed the existence of an underlying percolation process of the mobile regions, which occurs for the entire range of that we have studied. Now, we will focus on how the dynamics proceeds once the percolating cluster has formed. In order to quantify that, we construct two-dimensional projections of the MSD maps. In Fig. 4(a), we show the time evolution of the local mobility, via such maps, for . We observe that the -width of the shear band increases with time and eventually the entire system becomes mobilised. By locating contiguous layers of mobility, we identify the shear band and, thereafter, by marking the interfaces of this band, we measure how the band-width, , evolves with time. For different imposed shear rates, this time evolution is shown in Fig. 4(b). We see that initially grows quickly and then eventually it reaches a regime where the data can be fitted with , implying that the propagating interface of the shear band has a diffusive motion. The diffusion constant is dependent on the imposed shear rate. The smaller the shear rate , the slower is the diffusion, which leads to more long-lived heterogeneities, as discussed earlier. For the largest shear rate shown, , the diffusive regime is very short-lived as the band quickly spans the entire system. For even larger shear rates, beyond percolation, mobile regions quickly appear everywhere and fluidizes the whole system, and, as a consequence, a shear band is not clearly discernible.
Conclusions. In this work, we have explored how a model glass, subject to a constant strain rate, evolves from a quiescent state to plastic flow. We have shown that this process is initiated by a DP transition. Under shear, hot spots form in the amorphous solid, i.e. local regions in the system where particles have undergone large non-affine displacements. These are local structural changes transforming the initial quiescent glassy state which thus cannot be regained via thermal fluctuations. Unlike liquids, this is an essential feature of the glassy state, where a strong non-linear response to the external shear over-rides thermal fluctuations. Under continuing deformation, such hot spots percolate in the direction of the applied drive. Such a scenario conforms to the DP conjecture janssen81 ; grassberger82 , whereby a system, with no quenched disorders, transforms from a fluctuating state into an absorbing state. In our case, the dominance of the external shear leads to the system getting irreversibly trapped in an absorbed state of the percolating cluster of hot spots.
The subsequent growth of the active regions after the DP transition depends strongly on the applied shear rate. At larger shear rates, we observe a quick proliferation of mobile spots leading to a fluidisation. On the other hand, the process is asymptotically much slower at smaller shear-rates, with the mobile front slowly diffusing into the rest of the material. Thus, the existence of an initial fast timescale for the burst in mobility in the flow direction along the neutral plane and the subsequent slow timescale for the spread in the shear-gradient direction, leads to the sustenance of shear bands with long timescales for small shear rates.
I Methods
We consider a binary mixture of Lennard-Jones (LJ) particles (say A and B) with 80:20 ratio. This is a well-studied glass former. Particles interact via LJ potential which is defined as:
| (2) |
where . Interaction among particles is defined as , , . Range of interactions is given as , , and . Masses of both type of particles are equal, i.e., . All quantities are expressed in LJ units in which the unit of length is , energy is expressed in the units of and the unit of time is . More details about the model and parameters can be found in Ref. ka94 .
We perform molecular dynamics (MD) simulation in the ensemble using the package LAMMPS (“Large-scale Atomic/Molecular Massively Parallel Simulator”) plimpton95 . Different geometries are considered, placing the particles in boxes of dimensions , , and . Temperature is maintained via dissipative particle dynamics (DPD) thermostat sk03 .
Our method for the preparation of glass is as follows: First we equilibrate high temperature initial configuration at a temperature in the super-cooled regime and then quench it to a temperature below the mode coupling transition temperature ka94 . We wait until and apply shear on - plane in the direction of with different constant strain rates and . To simulate a sheared bulk glass, we use Lees-Edwards periodic boundary conditions le72 .
Maps of local MSD. To get the MSD maps, we divide the simulation box into small cubic sub-boxes having linear size of . At any time , we calculate the average MSD of the particles populating each sub-box at (unsheared glassy state). As discussed earlier, we measure the -component of MSD of each particle. The corresponding three-dimensional map, thus constructed, is shown in the different plots.
Maps of local strain. To plot the strain maps, again we divide the simulation box into small cubic sub-boxes, as in the case of MSD maps. The numerical derivative of -component of displacement with respect to , i.e. is calculated. This derivative, which gives strain , is plotted for each sub-box to construct the map.
Identifying the interface of shear-band. To characterize shear bands, we choose a slightly higher threshold on MSD. In the present work, it is taken as . We divide the simulation box into - layers of thickness one particle diameter and calculate , which is the -component of MSD, for each layer. We assign each layer a value 1/0 depending on whether is greater/lower than . To get the size of shear band we count the number of adjoining layers for which .
References
- (1) Rodney, D., Tanguy, A., and Vandembroucq, D. Modeling the mechanics of amorphous solids at different length scale and time scale. Modelling Simul. Mater. Sci. Eng. 19, 083001 (2011).
- (2) Barrat, J.-L. and Lemaitre, A. Dynamical Heterogeneities in Glasses, Colloids, and Granular Materials, Chap. 8, edited by L. Berthier, G. Biroli, J.-P. Bouchaud, L. Cipelletti, and W. van Saarloos (Oxford University Press, Oxford, 2011).
- (3) Zausch, J., Horbach, J., Laurati, M., Egelhaaf, S. U., Brader, J. M., Voigtmann, T., and Fuchs, M. From Equilibrium to Steady State: The Transient Dynamics of Colloidal Liquids under Shear. J. Phys.: Condens. Matter 20, 404210 (2008).
- (4) Falk, M. L. and Maloney,C. E. Simulating the mechanical response of amorphous solids using atomistic methods. Eur. Phys. J. B 75, 405 (2010).
- (5) Knowlton, E.D. , Pine, D.J., and Cipelletti, L., A microscopic view of the yielding transition in concentrated emulsions, Soft Matter, 10, 6931 (2014).
- (6) Varnik, F., Bocquet, L., and Barrat, J.-L. A study of the static yield stress in a binary Lennard-Jones glass. J. Chem. Phys. 120, 2788 (2004).
- (7) Moorcroft, R. L., Cates, M. E., and Fielding, S. M. Age-Dependent Transient Shear Banding in Soft Glasses. Phys. Rev. Lett. 106, 055502 (2011).
- (8) Schuh, C. A., Hufnagel, T. C., Ramamurty, U. Mechanical behavior of amorphous alloys. Acta Mater. 55, 4067 (2007).
- (9) Zhang, Y., Wang, W. H., and Greer, A. L. Making metallic glasses plastic by control of residual stress. Nature Mater. 5, 857 (2006).
- (10) Bokeloh, J., Divinski, S. V., Reglitz, G., and Wilde, G. Tracer Measurements of Atomic Diffusion inside Shear Bands of a Bulk Metallic Glass. Phys. Rev. Lett. 107, 235503 (2011).
- (11) Møller, P. C. F., Rodts, S., Michels, M. A. J., and Bonn, D. Shear banding and yield stress in soft glassy materials. Phys. Rev. E 77, 041507 (2008).
- (12) Greer, A. L., Cheng, Y. Q., and Ma, E. Shear bands in metallic glasses. Mater. Sci. Eng. R 74, 71 (2013).
- (13) Divoux, T., Fardin, M. A., Manneville, S., and Lerouge, S. Shear Banding of Complex Fluids. arXiv:1503.04130.
- (14) Fielding, S. M., Shear banding in soft glassy materials. Rep. Prog. Phys. 77, 102601 (2014).
- (15) Schall, P. and van Hecke, M. Shear Bands in Matter with Granularity. Annu. Rev. Fluid Mech. 42, 67 (2010).
- (16) Martens, K., Bocquet, L., and Barrat, J.-L. Spontaneous formation of permanent shear bands in a mesoscopic model of flowing disordered matter. Soft Matter 8, 4197 (2012).
- (17) Irani, E., Chaudhuri, P., and Heussinger, C., Impact of attractive interactions on the rheology of dense athermal particles. Phys. Rev. Lett. 112, 188303 (2014).
- (18) Chaudhuri, P., Berthier, L., and Bocquet, L. Inhomogeneous shear flows in soft jammed materials with tunable attractive forces. Phys. Rev. E 85 021503 (2012).
- (19) Martens, K., Bocquet, L., and Barrat, J.-L. Connecting Diffusion and Dynamical Heterogeneities in Actively Deformed Amorphous Systems. Phys. Rev. Lett. 106, 156001 (2011).
- (20) Chikkadi, V., Wegdam, G., Bonn, D., Nienhuis, B., and Schall, P. Long-Range Strain Correlations in Sheared Colloidal Glasses. Phys. Rev. Lett. 107, 198303 (2011).
- (21) Besseling, R., Isa, L., Ballesta, P., Petekidis, G., Cates, M. E., and Poon, W. C. K. Shear Banding and Flow-Concentration Coupling in Colloidal Glasses. Phys. Rev. Lett. 105, 268301 (2010).
- (22) Varnik, F., Bocquet, L., Barrat, J.-L., and Berthier, L. Shear Localization in a Model Glass. Phys. Rev. Lett. 90, 095702 (2003).
- (23) Chaudhuri, P. and Horbach, J. Onset of flow in a confined colloidal glass under an imposed shear stress. Phys. Rev. E 88, 040301(R) (2013).
- (24) Shi, Y. and Falk, M. L. Atomic-scale simulations of strain localization in three-dimensional model amorphous solids. Phys. Rev. B 73, 214201 (2006).
- (25) Bailey, N. P., Schiotz, J., and Jacobsen, K. W. Atomistic simulation study of the shear-band deformation mechanism in Mg-Cu metallic glasses. Phys. Rev. B 73, 064108 (2006).
- (26) Dasgupta, R., Hentschel, H. G. E., and Procaccia, I. Microscopic Mechanism of Shear Bands in Amorphous Solids. Phys. Rev. Lett. 109 255502 (2012).
- (27) Vandembroucq, D. and Roux, S. Mechanical noise dependent aging and shear banding behavior of a mesoscopic model of amorphous plasticity. Phys. Rev. B 84, 134210 (2011).
- (28) Moorcroft, R. L. and Fielding, S. M. Criteria for Shear Banding in Time-Dependent Flows of Complex Fluids. Phys. Rev. Lett. 110, 086001 (2013).
- (29) Amon, A., Bruand, A., Crassous, J., and Clément, J. Hot spots in an athermal system. Phys. Rev. Lett. 108, 135502 (2012).
- (30) Sentjabrskaja, T., Chaudhuri, P., Hermes, M., Poon, W. C. K., Horbach, J., Egelhaaf, S. U., and Laurati, M. Microscopic dynamics during creep in colloidal glasses. Sci. Rep., accepted for publication (2015).
- (31) Lemaitre, A. and Caroli, C. Rate-Dependent Avalanche Size in Athermally Sheared Amorphous Solids. Phys. Rev. Lett. 103, 065501 (2009).
- (32) Bailey, N. P., Schiøtz, J., Lemaître, A., and Jacobsen, K. W. Avalanche Size Scaling in Sheared Three-Dimensional Amorphous Solid. Phys. Rev. Lett. 98, 095501 (2007).
- (33) Karmakar, S., Lerner, E., and Procaccia, I. Statistical physics of the yielding transition in amorphous solids. Phys. Rev. E 82, 055103(R) (2010).
- (34) H. G. E. Hentschel, Karmakar, S., Lerner, E., and Procaccia, I. Size of Plastic Events in Strained Amorphous Solids at Finite Temperatures. Phys. Rev. Lett. 104, 025501 (2010).
- (35) Chattoraj, J., Caroli, C., and Lemaitre, A. Universal Additive Effect of Temperature on the Rheology of Amorphous Solids. Phys. Rev. Lett. 105, 266001 (2010).
- (36) Bak, P., Tang, C., and Wiesenfeld, K. Self-Organized Criticality. Phys. Rev. A 38, 364 (1988).
- (37) Basu, U. and Mohanty, P. K. Self-organised criticality in stochastic sandpiles: Connection to directed percolation. EPL 108, 60002 (2014).
- (38) Janssen, H. K. On the nonequilibrium phase transition in reaction-diffusion systems with an adsorbing stationary state. Z. Phys. B 42, 151 (1981).
- (39) Grassberger, P. On phase transitions in Schlögl’s second model. Z. Phys. B 47, 365 (1982).
- (40) Hinrichsen, H. Non-equilibrium critical phenomena and phase transitions into absorbing states. Adv. Phys. 49, 815 (2000).
- (41) Chaudhuri, P. and Horbach, J. Poiseuille flow of soft glasses in narrow channels: From quiescence to steady state. Phys. Rev. E 90, 040301(R) (2014).
- (42) Divoux, T., Tamarii, D., Barentin, C., and Manneville, S. Transient Shear Banding in a Simple Yield Stress Fluid. Phys. Rev. Lett. 104, 208301 (2010).
- (43) Wang, J., Zhou, Z., Liu, Q., Garoni, T. M., and Deng, Y. High-precision Monte Carlo study of directed percolation in dimensions. Phys. Rev. E 88, 042102 (2013).
- (44) Carvalho, M. C. T. P. and Duarte, J. A. M. S. Directed-Site Percolation Clusters: The Scaling Function in Dimensions Two to Six. Z. Phys. B 70, 203 (1988).
- (45) Munõz, M. A., Dickman, R., Vespignani, A., and Zapperi, S. Avalanche and spreading exponents in systems with absorbing states. Phys. Rev. E 59, 6175 (1999).
- (46) Kob, W. and Andersen, H. C. Scaling Behavior in the -Relaxation Regime of a Supercooled Lennard-Jones Mixture. Phys. Rev. Lett. 73, 1376 (1994).
- (47) Plimpton, S. Fast Parallel Algorithms for Short-Range Molecular Dynamics. J. Comp. Phys. 117, 1 (1995).
- (48) Soddemann, T., Dünweg, B., and Kremer, K. Dissipative particle dynamics: A useful thermostat for equilibrium and nonequilibrium molecular dynamics simulations. Phys. Rev. E 68, 046702 (2003).
- (49) Lees, A. W. and Edwards, S. F. The computer study of transport processes under extreme conditions. J. Phys. C: Solid State Phys. 5, 1921 (1972).
- (50) There is a slight dependence of results on the choice of threshold but the qualitative behaviour does not change.
II Acknowledgement
We acknowledge financial support by the Deutsche Forschungsgemeinschaft (DFG) in the framework of the priority programme SPP 1594 (Grant No. HO 2231/8-1).
III Author Contributions
All authors contributed to designing and performing the simulations, analysing the data and writing the manuscript.