The Local Group Galaxy IC 1613 and its Asymptotic Giant Branch Variables
Abstract
photometry is presented from a three-year survey of the central regions of the Local Group dwarf irregular galaxy IC 1613. The morphologies of the colour-magnitude and colour-colour diagrams are discussed with particular reference to the supergiants and M- and C-type asymptotic giant branch (AGB) stars. Mean magnitudes, amplitudes and periods are given for five O-rich and nine C-rich Mira variables for which bolometric magnitudes are also estimated. A distance of 750 kpc ( mag) is derived for IC 1613 by fitting a period-luminosity relation to the C-rich Miras. This is in agreement with values from the literature. The AGB stars exhibit a range of ages. A comparison with theoretical isochrones suggests that four luminous O-rich Miras are as young as yrs. One of these has a lithium absorption line in its spectrum, demonstrating that it is undergoing hot bottom burning (HBB). This supports the idea that HBB is the cause of the high luminosity of these AGB stars, which puts them above the fundamental period-luminosity (PL) relation. Further studies of similar stars, selected from their positions in the PL diagram, could provide insight into HBB. A much fainter, presumed O-rich, Mira is similar to those found in Galactic globular clusters. The C Miras are of intermediate age. The O-rich variables are not all recognized as O-rich, or even as AGB stars, on the basis of their colour. It is important to appreciate this when using near-infrared surveys to classify AGB stars in more distant galaxies.
keywords:
stars: variables: AGB; stars: carbon; galaxies: distances and redshifts; galaxies: individual: IC 1613; (galaxies:) Local Group; infrared: stars1 Introduction
IC 1613 is a Local Group dwarf irregular galaxy. Its proximity (0.72 Mpc Scowcroft et al. 2013) and isolation, together with its low foreground extinction (e.g. foreground mag; Schlegel et al. 1998) have made it an attractive target for various programmes. Studies of young stars show a metallicity similar to that of the SMC, but with a low oxygen abundance (Garcia et al. 2014; Bouret et al. 2015), while older stars appear to be more metal-deficient (e.g. Skillman et al. 2014). A recent investigation of the star formation history (Skillman et al. 2014) supports earlier suggestions that it has been constant over time, without any dominant phase of star formation.
Borissova et al. (2000) studied the distribution of luminous cool stars from and -band imaging and found AGB stars covering a wide range in age. Albert, Demers & Kunkel (2000) conducted a narrow-band wide field survey of IC 1613 for C and M stars, and found the (intermediate age) C stars extended out to 15 arcmin, well beyond the regions where star formation is currently active. Bernard et al. (2007) conducted a wide field optical survey of IC 1613, and traced red giant branch (RGB) stars out to a radius of 16.5 arcmin (3.6 kpc), showing the galaxy to be more extended than previously thought. Sibbons et al. (2015) use photometry to identify the tip of the RGB (TRGB) at mag and to discuss the relative numbers of O- and C-rich AGB stars. Jackson et al. (2007) and Boyer et al. (2009; 2015) use Spitzer mid-infrared photometry to discuss dust production and demonstrate that there are AGB stars in IC 1613 that are too red to be found by surveys at shorter wavelengths.
Various supergiants, including Cepheids and other variables, were identified by Sandage (1971). Spectra were taken of some by Humphreys (1980) and infrared photometry obtained by Elias & Frogel (1985). More recently surveys for variables have been made by Saha et al. (1992), Antonello et al. (1999, 2000), Mantegazza et al. (2001), Bernard et al. (2007, 2010) and OGLE II (Soszyński et al. 2009).
The present work forms part of a broad study of AGB variables in Local Group Galaxies which so far has covered the dwarf spheroidals: Leo I (Menzies et al. 2002; 2010), Phoenix (Menzies et al. 2008), Fornax (Whitelock et al. 2009) and Sculptor (Menzies et al. 2011), as well as NGC 6822 (Whitelock et al. 2013), another dwarf irregular.
| RA | Dec | G | |||||||||
|---|---|---|---|---|---|---|---|---|---|---|---|
| (equinox 2000) | (mag) | ||||||||||
| 16.21004 | 2.17447 | 1001 | 12.512 | 0.025 | 12.171 | 0.016 | 12.140 | 0.032 | 0.341 | 0.031 | 0.372 |
| 16.31182 | 2.23713 | 1002 | 13.536 | 0.018 | 12.954 | 0.032 | 12.729 | 0.039 | 0.582 | 0.225 | 0.807 |
| 16.25696 | 2.14422 | 1003 | 13.934 | 0.044 | 13.234 | 0.045 | 13.013 | 0.056 | 0.699 | 0.221 | 0.921 |
| 16.24328 | 2.15233 | 1004 | 14.096 | 0.032 | 13.427 | 0.036 | 13.191 | 0.034 | 0.669 | 0.236 | 0.905 |
2 Observations
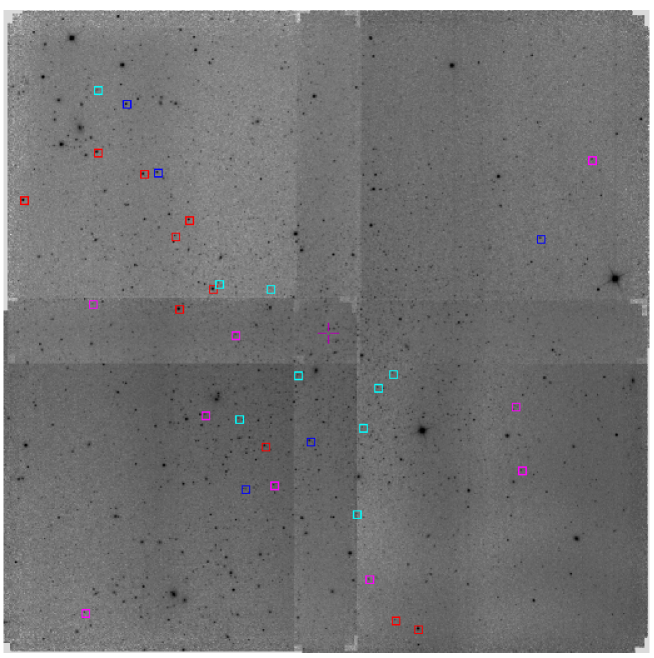
We used the Japanese-South African IRSF equipped with the SIRIUS camera, which permits simultaneous imaging in the and bands (see Nagayama et al. (2003) for details). We defined 4 overlapping fields, each approximately 7.8 arcmin square, with field 1 centred at (2000.0) = 01:05:01.3 and (2000.0) = 02:11:43.8. Field 2 is 7 arcmin W of field 1, fields 3 and 4 are 7 arcmin south of fields 2 and 1, respectively. Fields 1 and 2 were observed in at 11 epochs, and the other two at 10 epochs, over a period of 3 years. Typically 30 dithered exposures of 30 s each were combined at each epoch, though occasionally, depending on sky brightness at , exposure times were reduced to 20 s.
The basic data for stars with standard errors less than 0.1 mag in each band are provided on-line, and the first few lines of the catalogue are illustrated in Table 1 (The Mira variables, discussed in section 8, are not in this table).
Observations were obtained with the Robert Stobie Spectrograph on the Southern African Large Telescope (SALT). An 1800 line/mm grating was used to cover the wavelength region from 6000 to 7200 with a resolving power of about 4000. Two spectra with exposure times of 2400 s each were obtained at GJD 2456980.3903 and 2456981.3737, respectively and reduced with the SALT pipeline (Crawford et al. 2010).
-band photometry was obtained with the Las Cumbres Observatory Global Telescope (LCOGT) Network. This was primarily for the purpose of establishing when the M-type Mira, G3011, was sufficiently bright to obtain spectroscopy with SALT (see section 4), but it also served to give us some variability information on all four of the bright M-type Miras.
The reddening to IC 1613 is small and no corrections are applied for the various diagrams. For the bolometric magnitudes a small correction is applied as discussed in section 9.
A mosaiced image is shown in Fig. 1.
3 UKIRT data
Infrared photometry of IC 1613 has been obtained with UKIRT and published by Lawrence et al. (2007), as part of the UKIDSS survey, and by Sibbons et al. (2015). It is potentially useful to combine these data with our IRSF measurements in order to determine periods for the large amplitude variables.
The Sibbons et al. (2015) photometry () was re-reddened assuming so that are 0.015, 0.009, 0.005 mag, respectively, then corrected to the Two Micron All Sky Survey (2MASS) system () using:
| (1) |
| (2) |
| (3) |
which are derived from Hodgkin et al. (2009).
The UKIDSS data from Lawrence et al. had not been reddening corrected and were therefore simply transformed using the above equations.
As discussed in our paper on NGC 6822 (Whitelock et al. 2013) IRSF and UKIRT photometry for non-variables shows good agreement for and , but a colour term for of the order of 0.1 mag for stars with , in the sense that the transformed Sibbons et al. mag is fainter than our values.
We assume that the above transformation applies to the large amplitude variables, while noting that this may not be the case because of their unusual energy distributions.
4 Spectrum of G3011, the luminous M giant
The SALT spectrum of G3011 is shown in Fig. 2 together with one of HV11329, a super-lithium-rich star in the SMC (Smith, Plez & Lambert 1995), taken with the same set up, for comparison. The region around the lithium line is shown at higher magnification.
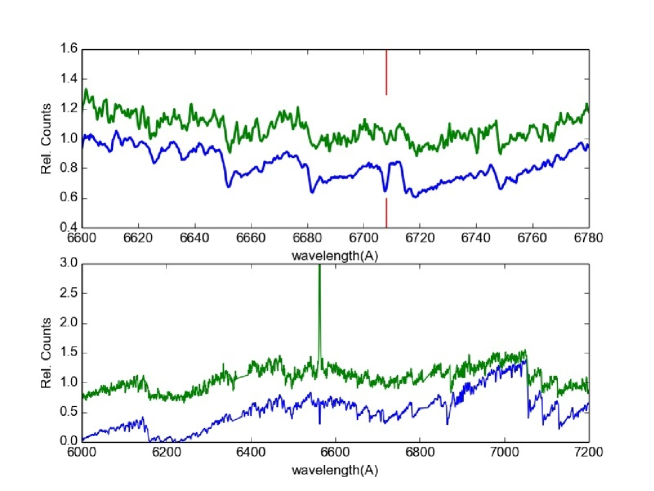
The presence of the lithium doublet at 6708 is quite clear as is the ZrO band head at 6474. As an indication of the strength of the lithium line, we find an equivalent width of about 350 m, using a pseudo-continuum defined by the fluxes at 6704 and 6712. With the same procedure, the equivalent width in our HV11329 spectrum is about 480m (compared with 767m given by Smith et al. (1995), using a ’local flux maximum’ as continuum). The presence of s-process elements leads us to classify this as an AGB star while the lithium clearly indicates hot bottom processing.
The heliocentric radial velocity of G3011 based on the position of H is Kms-1, which is very similar to that of other stars in IC 1613 (Kirby et al. 2014) as well as to the HI velocity (Hoffman et al. 1996). What is perhaps quite surprising is the strength of the metal lines in the same region, note in particular the line just to the red of lithium with a rest wavelength of 6710.5 which must be mostly iron (Davis 1947), and which is not seen at all in the SMC star spectrum. This might reasonably lead us to question the assumption that IC 1613 is a very metal weak galaxy. In that context it is interesting to note that Garcia et al. (2014) in looking at the spectra of young hot stars recorded “An unexpected finding is that when comparing analogue stars in the Fe V and Fe IV pseudo-continua, the line strength of the Fe forest in IC 1613 stars is similar to that in SMC stars, or even stronger. We expected a significant difference given IC 1613’s poorer metal content. ”
The metallicity of IC 1613 requires a proper abundance analysis of stars with atmospheres that can be properly modelled.
| G | RA | Dec | |||||||
|---|---|---|---|---|---|---|---|---|---|
| equinox 2000 | (mag) | ||||||||
| 1027 | 16.25295 | 2.18007 | 16.03 | 15.63 | 15.52 | 0.70 | 0.77 | 0.78 | |
| 4013 | 16.22231 | 2.08931 | 15.464 | 14.757 | 14.597 | 0.052 | 0.072 | 0.088 | |
| 1004 | 16.24328 | 2.15233 | 14.096 | 13.427 | 13.191 | 0.032 | 0.036 | 0.034 | |
| 1003 | 16.25696 | 2.14422 | 13.934 | 13.234 | 13.013 | 0.044 | 0.045 | 0.056 | |
| 1009 | 16.27144 | 2.19849 | 15.140 | 14.479 | 14.315 | 0.023 | 0.022 | 0.035 | |
| 1010 | 16.29004 | 2.20715 | 14.900 | 14.175 | 13.985 | 0.045 | 0.039 | 0.040 | |
| 1008 | 16.31963 | 2.18765 | 14.834 | 14.117 | 13.923 | 0.037 | 0.056 | 0.036 | |
| 3003 | 16.16047 | 2.01605 | 14.161 | 13.512 | 13.342 | 0.025 | 0.086 | 0.029 | |
| 3188 | 16.16983 | 2.01953 | 18.16 | 17.73 | 16.78 | 0.16 | 0.09 | 0.08 | |
| 1025 | 16.25852 | 2.17354 | 16.693 | 15.944 | 15.702 | 0.084 | 0.062 | 0.066 | |
The values for the Cepheid, G1027, are the peak-to-peak amplitudes.
| G | Sandage | OGLE | GCVS | Sp | Sibbons | Other | Ref | ||
|---|---|---|---|---|---|---|---|---|---|
| (mag) | |||||||||
| 1027 | V22 | V0045 DCEP | K2I | P=146.35 | |||||
| 4013 | V23 | 11437 | 18.359 | 1.844 | V0038 Lc | 10977 | V2946 P=645 | 1 | |
| 1004 | V32 | 13677 | 17.409 | 2.056 | V0042 Lc | M1a | 15855 | 2 | |
| 1003 | V38 | 13675 | 17.324 | 1.987 | V0046 Lc | M0Ia | 15299 | 2 | |
| 1009 | V43 | 18839 | 17.662 | 1.538 | V0053 Lc | M1I | 18518 | 2 | |
| 1010 | V58 | 18838 | 17.666 | 1.677 | V0056 Lc | 18909 | |||
| 1008 | V45 | 17879 | 17.672 | 1.740 | V0060 SRc | 17962 | P=529 | GCVS | |
| 3003 | M2-4I | 7542 | 3 | ||||||
| 3188 | 3692 | 19.326 | 0.186 | M0-2I | V0037D | 3, 4, 5 | |||
| 1025 | V39 | 13682 | 18.851 | 1.234 | sg B[e]/LBV? | 17209 | OGLE P=14.33 | 6 | |
Ref: 1 period Antonello et al. (2000);
2 Sp type Humphreys (1980); 3 Britavsky et al. (2014); 4 Mantegazza et al.
(2001);
5 see text;
6 Herrero et al. (2010)
5 Colour-Magnitude Diagram
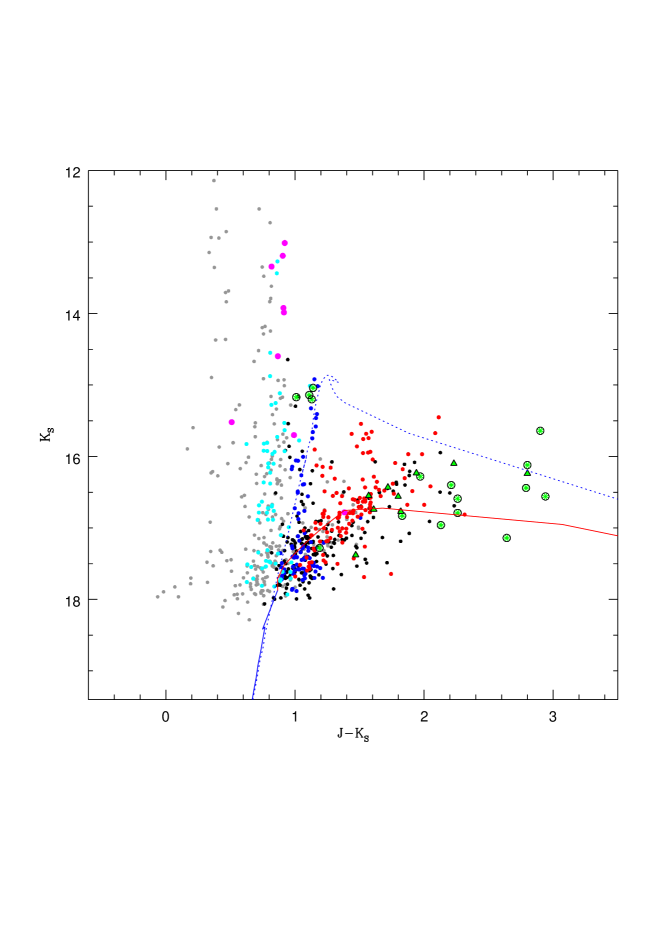
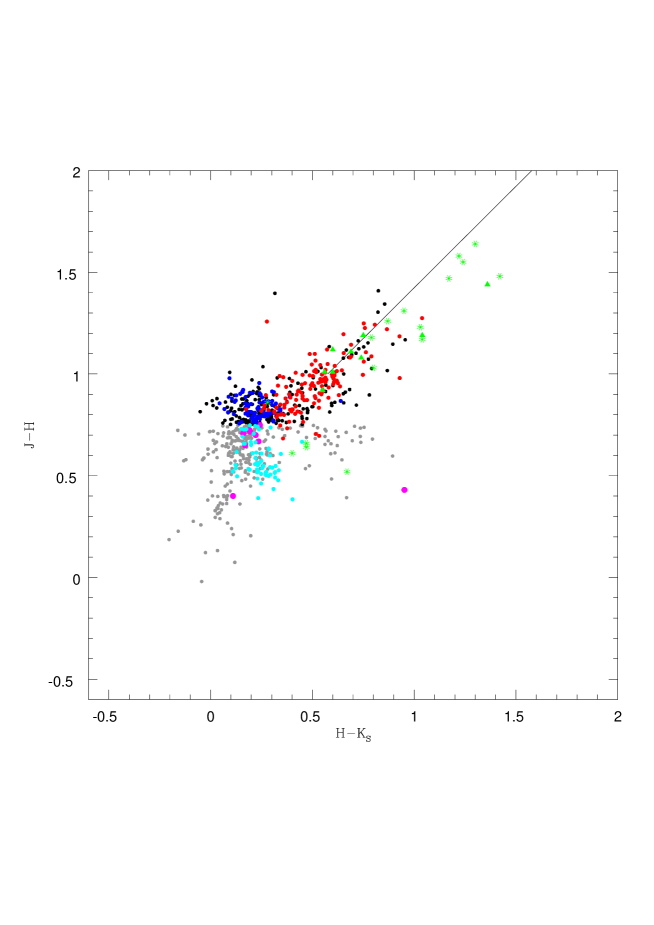
The colour-magnitude and two-colour diagrams for stars from Table 1 plus the variables discussed in section 8, are illustrated in Fig. 3 and Fig. 4. Sibbons et al. (2015) found the TRGB to be at mag. Our limiting magnitude is , so all of the objects in our sample that are in IC 1613 (i.e. not foreground stars or background galaxies) are either supergiants or AGB stars.
Following the same procedure as for NGC 6822 (Whitelock et al. 2013) we assume that stars with are dwarfs. Note that Sibbons et al. used a somewhat bluer colour to make the same division. The identification of dwarfs is helpful for an interpretation of the colour-magnitude diagram, but it is not a factor in our identification of AGB variables. However, both the supergiants (section 7) and the O-rich AGB variables (section 8) have similar colours to dwarfs, so any we have not specifically identified may be misrepresented as dwarfs in the figures.
The colour-magnitude and two-colour diagrams (Figs. 3 and 4) are very similar to those of NGC 6822 (figs. 1 and 2 Whitelock et al. 2013), when we take into account the observational limits and the different distances to the two galaxies.
In IC 1613 Fig. 4 there are rather more points with and than in NGC 6822. The faint (presumed M-type) AGB variable (G4237) falls in this area as do two stars that are tentatively identified as C-rich (G2143, G2075) from the narrow-band photometry (see section 6). It is certainly possible that these particular stars suffer some weak contamination in the band. In Fig. 3 most of the rest of the points fall among the bluer C stars, but have not been identified as such. It is likely that these sources are unresolved distant galaxies. Note also that G3188, discussed in section 7, has the most extreme colours of this group and is probably a background source.
6 Distinguishing C- and M-type AGB stars
Narrow band CN and TiO photometry for IC 1613 by Albert et al. (2000) was used to identify M and C stars in our sample. We considered only stars for which the uncertainty on is mag and used the colour criteria of Albert et al. (see their fig. 5). These stars are identified in the colour-magnitude (Fig. 3) and two-colour (Fig. 4) diagrams.
Sibbons et al. examined stars brighter than the TRGB. They divided their sample into C and M stars on the basis of the colour, such that stars with 2MASS mag are probably M stars and those with 2MASS mag, are probably C stars. They also noted that there was some overlap at the dividing line. In Fig. 5 we show a colour-magnitude diagram based on photometry from Sibbons et al., in the area surveyed by us (except for the variable stars which are IRSF measurements). The Sibbons photometry has been put on the 2MASS system (section 3), so this diagram can be compared directly with Fig. 3. The two diagrams are similar except for the fainter limits of the UKIRT data, so they see stars which are both fainter and redder than we do. There is no major systematic difference between the Sibbons et al. and the Albert et al. divisions into C and M stars, and the Albert et al. results indeed indicate that there is no strict separation at , but a good deal of overlap.

7 Supergiants
It is important to recognize the M supergiants in IC 1613, particularly the variables, for the purpose of comparison with the luminous AGB stars discussed below.
We also clearly identify the long period Cepheid (G1027) which was discovered by Sandage (1971), as V22, with a period of 146.35 days, and who noted that it did not repeat well. Antonello et al. (1999) call the same star V2396 and find P=145.6 days, but do not have enough data to cover the full cycle. Our period of 147 days from the IRSF data alone, or 145 days including the two UKIRT observations (see Fig. 6), is consistent with both these values. The same star (V22) in Scowcroft et al. (2013) was assigned a period of 123.88 days taken from an earlier paper where they had insufficient data to determine the period. This period does not fit any of the available data. There are of course many more, shorter period Cepheids in IC 1613 (e.g. Udalski et al. 2001 - henceforth OGLE II; Scowcroft et al. 2013) which are too faint to show up in this survey.
In addition to the bright Cepheid, Table 2 contains mean values of the IRSF and LCOGT -band photometry of the stars which are identified as supergiants in the literature (see Table 3). The mean photometry is based on at least 10 observations at and 15 LCOGT observations for the magnitudes. For these bright stars the standard deviation, , gives an indication of the level of variability, which is small in all cases (other than for the Cepheid). It is certainly too small to look for periodicities, although most of these stars have been identified as variables, e.g. by Sandage (1971), as indicated in the second column of Table 3. The OGLE II identity, magnitude and colour are given in columns 3, 4 and 5, respectively; the General Catalogue of Variable Stars (GCVS - Samus et al. 2013) identity and variability class is given in column 6, the spectral type in column 7 and the Sibbons et al. catalogue number in column 8. Column 9 contains any other variability information while column 10 contains the reference to this information and/or to the spectral type.
With the exception of the Cepheid, G1027, and G3188 the supergiants have very similar colours and in Fig. 4 appear on the border between the M giants and the dwarfs, but distinct from the luminous M giant variables discussed below.
Herrero et al. (2010) investigated G1025, which they describe as a Luminous Blue Variable (LBV). Its colours in Fig. 4 are similar to the late-type supergiants, but is even fainter in Fig. 3 than the bright M-type variables. It is possibly a binary or a confused image.
G3188 is included in the tables because it was identified as IC1613-1 by Britavsky et al. (2014) with a spectral type of M0-2I. However, Mantegazza et al. (2001) identify the same object as a blue variable, V0037D, with a period of 62.71 days. The OGLE II data confirm its blue colour, as does the Sloan Digital Sky Survey ( mag; Ahn et al. 2012). Our infrared images show it as extended and the UKIDSS catalogue (Lawrence et al. 2007) indicates that it has a high probability of being a galaxy. The UKIDSS infrared magnitudes are similar to ours. Inspection of the Spitzer catalogs and images from Boyer et al. (2015) show multiple sources within a three arcsec radius at these coordinates. In Fig. 3 it appears among the C stars. On the basis of its radio and X-ray emission Flesch (2010) finds there is a 97 percent chance that the object is a QSO. He gives 0 and 1 percent chances of its being a galaxy or a star, respectively. It is not clear what this is, but it is certainly not an M-type supergiant and it is probably more than one source!
8 Variables
In the following, in addition to our IRSF photometry, we make use of the infrared photometry from UKIRT described by Lawrence et al. (2007) and by Sibbons et al. (2015), converting it to the 2MASS system as described in Section 3. These observations were taken between three and seven years after our measurements. This cadence is not ideal and long term changes in the mean magnitude, which are common among C-rich stars, can make determining periods more difficult. There also remain possibilities of differences in the photometric systems for stars with extreme colours. Nevertheless, as the light curves illustrated later demonstrate, the extra observations do help with many of the period determinations.
The bright Cepheid variable was discussed in section 7 and its photometry is listed in Table 2.
We examined the light curves of all stars with mag for which we had at least 10 observations and which showed a standard deviation in , or of mag, going to lower standard deviations for brighter magnitudes. Given that our primary objective was to find large amplitude AGB variables we also examined stars with mag, finding them all to be variable at some level.
Variables with mag are defined as probable C-type stars, while the bluer ones are assumed to be M-type, i.e. O-rich stars (see section 6). Many of these M- and C-type classifications are confirmed from their narrow-band colours (Albert et al. 2001) or from spectroscopy in the case of G3011.
Where possible, periods were determined by Fourier analysis of the and/or data. For the large amplitude, Mira variables for which periods could be determined the Fourier mean magnitudes and peak-to-peak amplitudes, were also measured. These are listed in Tables 4 and 6 for the probable O-rich and C-rich stars, respectively. We followed the same practice as in our earlier papers (e.g. Whitelock et al. 2006) of classifying any star with a measurable period and an amplitude at of mag as a Mira, and anything with a smaller amplitude as a semi-regular (SR) variable. The Sibbons et al. identification is given and where they identify the source as an AGB star a type of M or C is also given. If no M or C is given then Sibbons et al. did not recognize the star as being on the AGB. The ID and type from Albert et al. is also listed where the uncertainty of their was mag.
Note that G3083 is listed twice with two possible periods, 147 and 280 days, as it was impossible to distinguish between these with the available data. The one year alias of 280 days is 158 days, i.e. not exactly 147, and possibly this is a case of aliasing in rather noisy data. Spitzer data (Whitelock et al. in preparation) favours a longer period and we therefore adopt 280 days in the following discussion.
Table 7 contains the photometry for the stars for which we could not determine periods. Some of these will be Miras with erratic variations or insufficient data, others will be SR variables. Most of them are C-rich as determined by Albert et al. (2001). The tabulated provides the approximate range of the variability. No attempt is made to list stars with amplitudes mag, of which there are many.


Figure 7 shows the light curves for the stars in Table 6 together with their best fit first-order sinusoid at the period noted on the figure. The UKIRT observations (open circles) are in reasonably good agreement with our data, given that they were obtained at a different time and converted to the 2MASS system as described in section 3. This is important because Whitelock et al. (2013) noted significant differences between their mean mags and those by Battinelli & Demers (2011) for the stars in common (see their fig. 6), and there was a possibility that this was due to transformation problems with the colours of these very red stars.
In the colour-magnitude (Fig. 3) and two-colour (Fig. 4) diagrams the C-rich Miras are seen to be the reddest of the stars we observe and we would anticipate that they have large mass-loss rates, as the Spitzer photometry (Boyer et al. 2015) also suggests. The other variables overlap in colour with the Miras, supporting our expectation that some of them are Miras. The light curve of G4200, which is the reddest of these, is shown in Fig. 8. There is no sign of periodicity, although it is highly variable over a timescale of about 3000 days.

The luminous M variables are discussed separately below. G4237 (at and mag) is significantly fainter than these objects; it can be seen about 2 mag below them in the colour-magnitude diagram (Fig. 3. Its light curve is shown in Fig. 9. It was not recognized as an AGB star by Sibbons et al. because they would have classified it as a dwarf from its colour. Our mean value was mag, so we too would class it as a dwarf on the basis of colour. It is difficult to be certain without a spectrum, but the light curve and luminosity are most simply explained if it is a Mira and it is discussed further in section 9.
It is notable that the four bright Miras have similar luminosities and periods to each other, and are therefore of very similar age. It is therefore significant that there are no Miras, and rather few AGB stars, in the two magnitude interval fainter than these stars and none brighter. These four stars are discussed further below (section 9).


8.1 Completeness of survey for large-amplitude variables
As in our analysis of NGC 6822 (Feast et al. 2012; Whitelock et al. 2013) we use a reference frame in the band to provide positions at which “fixed-position” DoPHOT photometry was performed. It is therefore possible that extremely red stars or stars with a very large amplitude of variation might have been missed. If the star was not measurable on the reference frame, then it would not have been retained in the catalogue even if found in any other band or on any other frame. The limiting magnitudes at and for this survey are approximately 20.3, 18.3 and 18.0 mag, respectively. This means that we would have missed red variables with mag that were fainter than about mag or mag at the time the reference frame was obtained, even though these latter values are significantly above the relevant limiting magnitudes.
Furthermore, it is important to recognize that we do not have as good temporal coverage or cadence as we did for NGC 6822 (Whitelock et al. 2013), IC 1613 is more distant than NGC 6822 (by between 0.7 and 0.8 mag), and it is therefore clear that we do not expect our sample of large amplitude variables in IC 1613 to be complete.
Table 8 lists the stars from Sibbons et al. (2015) with mag that are not in our catalogue. All except the three faintest ones (20671, 8310 and 20772) are visible on our reference frames, but too faint to measure. Several of them have UKIDSS measurements that are a few tenths of a magnitude different from the Sibbons et al. values. All but one of them, 16335, have Spitzer measurements from Boyer et al. (2015) and 16 of those (all except 8310) have mag, making them extreme AGB stars according to the definition of Blum at al. (2006) and therefore very good candidates for large amplitude C-rich variables.
| G | RA | Dec | P | ||||||||
|---|---|---|---|---|---|---|---|---|---|---|---|
| equinox 2000 | (d) | (mag) | |||||||||
| 1017 | 16.27831 | 2.22648 | 580 | 16.25 | 15.61 | 15.14 | 1.11 | 0.89 | 1.04 | 0.95 | 18.332 |
| 3011 | 16.20428 | 2.09140 | 550 | 16.18 | 15.57 | 15.17 | 1.01 | 0.64 | 0.90 | 0.82 | 18.261 |
| 2035 | 16.11180 | 2.17299 | 530 | 16.33 | 15.67 | 15.20 | 1.13 | 0.75 | 0.74 | 0.75 | 18.402 |
| 1016 | 16.26576 | 2.19903 | 464 | 16.18 | 15.32 | 15.04 | 1.14 | 0.43 | 0.49 | 0.50 | 18.085 |
| 4237 | 16.23002 | 2.07187 | 178 | 18.47 | 17.95 | 17.28 | 1.19 | 0.79 | 0.74 | 1.07 | 20.595 |
| G | Sibbons+ | Albert+ | OGLE II | SP/Var | ref | ||
|---|---|---|---|---|---|---|---|
| (mag) | |||||||
| 1017 | 19757 - | 3391 M | 18862 | 19.584 | 2.989 | ||
| 3011 | 11122 - | 4725 | 18.932 | M3III | Kurtev+2001 | ||
| 2035 | 17180 M | 1966 | 17.729 | 2.887 | VC208 | Bernard+2010 | |
| 1016 | 18536 C | 529 M | 15569 | 17.312 | 2.292 | V40,V1872,V51 | 1,2, GCVS |
| 4237 | 9825 - | 10360 | 19.942 | ||||
Ref: 1 Sandage (1971), 2 Antonello et al. (1999).
| G | RA | Dec | P | Sibbons+ | Albert+ | |||||||||
|---|---|---|---|---|---|---|---|---|---|---|---|---|---|---|
| equinox 2000 | (day) | (mag) | ||||||||||||
| 1147 | 16.28988 | 2.23202 | 879 | 18.54 | 17.06 | 15.64 | 2.90 | 1.34 | 1.36 | 1.04 | 18.729 | 19976 C | ||
| 3235 | 16.18318 | 2.09688 | 425 | 18.92 | 17.34 | 16.12 | 2.80 | 0.92 | 0.78 | 0.52 | 19.363 | 11555 C | ||
| 4183 | 16.20909 | 2.11792 | 410 | 18.25 | 17.07 | 16.28 | 1.97 | 0.92 | 0.76 | 0.56 | 19.761 | 13233 - | 1201 C | |
| 3198 | 16.18212 | 2.05673 | 370 | 19.23 | 17.68 | 16.44 | 2.79 | 0.75 | 0.70 | 0.69 | 19.675 | 9057 C | ||
| 3144 | 16.17702 | 2.11280 | 364 | 18.61 | 17.44 | 16.40 | 2.21 | 0.88 | 0.74 | 0.48 | 19.831 | 12808 C | ||
| 1186 | 16.22006 | 2.15270 | 310 | 19.78 | 18.31 | 17.14 | 2.64 | 1.12 | 1.04 | 0.78 | 20.448 | 15883 - | ||
| 1093 | 16.24090 | 2.15469 | 305 | 19.50 | 17.86 | 16.56 | 2.94 | 2.23 | 1.34 | 0.92 | 19.718 | 15999 C | ||
| 3083* | 16.18528 | 2.06219 | 280 | 19.05 | 17.82 | 16.79 | 2.26 | 0.71 | 0.45 | 0.54 | 20.219 | 9328 - | ||
| 3083* | 16.18528 | 2.06219 | 147 | 19.05 | 17.83 | 16.96 | 2.09 | 0.64 | 0.40 | 0.86 | 20.433 | 9328 - | ||
| 4251 | 16.23290 | 2.10034 | 263 | 18.85 | 17.54 | 16.59 | 2.26 | 1.22 | 1.07 | 0.96 | 20.040 | 11806 C | ||
*There are two entries for G3083 with different periods as discussed in section 8.
| G | RA | Dec | Sibbons+ | Albert+ | ||||
|---|---|---|---|---|---|---|---|---|
| equinox 2000 | (mag) | |||||||
| 4098 | 16.29459 | 2.02230 | 19.04 | 17.60 | 16.24 | 1.0 | 7773 C | |
| 4165 | 16.24627 | 2.10189 | 18.17 | 16.98 | 16.23 | 0.4 | 11937 C | 2671 C |
| 1183 | 16.29165 | 2.14605 | 18.59 | 17.51 | 16.77 | 0.4 | 15435 C | 5994 C |
| 4051 | 16.21875 | 2.07353 | 18.15 | 17.03 | 16.43 | 0.8 | 9922 C | 2173 C |
| 3100 | 16.11923 | 2.07968 | 18.12 | 17.11 | 16.55 | 0.5 | 10310 C | 3047 C |
| 3068 | 16.18036 | 2.03580 | 18.35 | 17.34 | 16.74 | 0.4 | 8218 C | 1037 C |
| 3247 | 16.12183 | 2.10549 | 18.85 | 17.93 | 17.38 | 0.43 | 12218 C | 1892 C |
| 4200 | 16.23416 | 2.13410 | 18.36 | 17.25 | 16.56 | 0.7 | 14536 C | 2843 C |
| 2111 | 16.09110 | 2.20471 | 18.33 | 17.14 | 16.1 | 0.40 | 18795 C | |
8.2 Luminous O-rich variables
The first four presumed O-rich AGB stars listed in Table 4 are well separated from the other variables in the colour-magnitude diagram (Fig. 3). Their light curves are illustrated in Fig. 10, while Fig. 11 shows their LCOGT -band observations, phased on the periods determined from the infrared photometry. These periods fit reasonably well and in all cases show that the peak at occurs earlier than at , as might be expected. The amplitudes will be significantly larger than the amplitudes. Soszyński et al. (2009) use an amplitude of mag to define Miras within the very extensive OGLE data and we would expect the amplitude to be slightly greater than that at . Thus all of these stars would be classed as Miras from their photometry. Our knowledge of the individual stars is summarized briefly in Table 5 and the details are discussed below.
The data summarized in Table 5 show that two of these stars, G1017 and G1016, are O-rich from their narrow-band colours, while a third, G3011, is O-rich from its published spectral type, M3III (see also section 4). All four are large amplitude variables with mag and we therefore assume that all four are O-rich Miras. Sibbons et al., working only with colours and no variability information, found only one O-rich AGB star, G2035, two of the others were not classed as AGB stars at all while the fourth, G1016, was classed as a C-rich AGB star. Because photometry has become an important method for identifying AGB stars in other galaxies it is vital to appreciate that it does not work for these important luminous AGB variables (nor even for the fainter presumed O-rich Mira G4237 discussed above). Some notes on three of the variables follow:
G1017: There is a variable in the Catalina survey (Drake et al. 2014), J010506.6+021333, that is 2.7 arcsec away from G1017 but which is almost certainly the same source. It is described as an LPV with , mag (measurements in white light) and P=533.618 days.
G3011: Kurtev et al. (2001) found what they described as the first Mira variable in IC 1613, determined a period of 640.7 days for it and assigned a spectral type of M3e. This is the source we call G3011 with the lithium-rich spectrum described in section 4. Note that the period of 640.7 days does not fit our or our data We determined a period of 550 days, with an estimated error of about 30 days. It is not clear at this stage if the period has changed or if the earlier data could be consistent with a somewhat shorter period. It is also listed as an LPV, V2950, by Antonello et al. (2000) with a period of about 645 days and a white light amplitude of 1.7 mag. It will be important to establish if the period is changing as this could indicate that we are observing it at a time that is close to a helium shell flash.
G1016: This was identified as V40, an irregular red variable, by Sandage (1971), and by Antonello et al. (1999), where it is V1872. It is listed as an Lc variable, I1613 V51, in the GCVS.
On the basis of their variability these stars could be supergiants or AGB variables, but the spectrum discussed above (section 4) proves that G3011, and by implication the others, must be an AGB star undergoing hot bottom burning. It seems likely that our survey is complete for these luminous O-rich Mira variables, even though it is very incomplete for the faint M-type Miras and for the redder fainter C Miras. We would also not have detected highly reddened OH/IR sources, if such stars were present.
9 Comparison with theoretical isochrones
Observations suggest that AGB stars end their AGB evolution as Miras, i.e. large-amplitude variables pulsating in the fundamental mode (Feast & Whitelock 1987, Whitelock & Feast 2000, Feast, Whitelock & Menzies 2002). Theory, (e.g., Marigo et al. 2008), suggests that there will be some evolution of the period and colour once fundamental pulsation has started. However, the existence of the Mira period luminosity relation (Whitelock et al. 2008; Whitelock et al. 2013) together with kinematic evidence (e.g. Feast et al. 2006) suggests that the evolution with period is very limited and/or very rapid at least among older populations, which also have low envelope masses. It is therefore our assumption that the Miras observed in IC 1613 are very close to the end of their AGB evolution. The situation with HBB stars is less clear and it is at least possible that they are overtone pulsators (Feast 2009), which will evolve into very long period, possibly OH/IR, stars when they become fundamental pulsators.
Marigo et al. (2008) discuss the theoretical evolution of AGB stars with a wide range of ages, and they provide colours on the 2MASS system via a web interface111stev.oapd.inaf.it/cgi-bin/cmd. Fig. 3 illustrates two representative isochrones from their work. The brighter of these passes close to the luminous M giants and represents a relatively young population of just yrs with Z=0.004. Stars on the upper part of this isochrone are indeed undergoing HBB. Increasing the metallicity moves the curve to the right, fitting lower luminosity M stars rather better, but missing the large amplitude variables. Decreasing the age moves it to higher luminosity. Assuming these M giant variables are the most luminous AGB stars then the AGB is observed down to yrs. Note that for the purpose of illustrating these isochrones in Fig. 3 we omit the last few points where the colours vary dramatically over a very small range of initial mass.
Marigo et al (2008) note that the bell-shaped profile in some of their theoretical isochrones (their fig. 1) is due to a combination of HBB and high mass loss. Their isochrone for z=0.004 and an age of years clearly shows such a profile with the four luminous Miras lying near the brightness peak of the isochrone (see our Fig. 1). Their older isochrones do not show such a structure. This is consistent with the fact that we do not find any older (i.e. less luminous with shorter period) Miras showing evidence for HBB by being above the PL relation. This is despite the fact that the galaxy contains such older stars. The Marigo et al. results for the isochrone in our Fig. 1 indicate that these four luminous Miras have an initial mass of 3.5 and a current mass of 3.4. They also indicate that slightly more advanced stars on the isochrone are evolving rapidly with high mass-loss rates and are thus less likely to be found. These conclusions are not significantly changed if the metallicity is somewhat greater than z=004. This is shown by the z=0.008 and z=0.019 isochrones in fig. 1 of Marigo et al. The initial (current) masses at the same age would be 3.6 (3.5) for z=0.008 and 3.8(3.7) for z=0.019. The presence of these four HBB stars indicates a significant population of age near years. We might therefore expect a population of short period (1-2 day) Cepheids at this metallicity (see the Cepheid period-age relation of Bono et al. (2005)). Unfortunately such stars are at, or just below, the magnitude limit of the OGLE survey for Cepheids in IC1613 (Udalski et al. 2001). However, a deeper survey of a small region of the galaxy (Bernard et al. 2010) shows a significant population of Cepheids with periods in the 1 to 2 day range. We conclude that our HBB stars are restricted to small regions in the colour-magnitude and period-luminosity spaces because there is a lower limit to the age at which HBB can occur, coupled with the fact that there is only a sparse population of younger stars.
The second, fainter isochrone represents a population with an age of 1 Gyr with Z=0.001 (the mean for IC 1613 according to Skillman et al. 2014). It goes through the bulk of the AGB stars although it predicts a change from O-rich to C-rich at , bluer than the seen observationally. The pulsation periods predicted by the models do not bear any relationship to those actually measured. Nevertheless, the models have improved in recent years and seem to provide a plausible qualitative fit to many aspects of the data.
The one low luminosity (presumed) O-rich star, G4237, with , must be significantly older than those discussed above and more like the Miras found in metal-rich Galactic globular clusters. If it is comparable to the AGB variables in 47 Tuc it is about 10 Gyr or possibly older (Garía-Berro et al. 2014 and references therein). The most luminous point on an isochrone of 10 Gyr and Z=0.004 (not illustrated) falls very close to this star in the colour-magnitude diagram. We anticipate that there would be significant numbers of such variables in IC 1613, with (see Feast et al. 2002, fig. 3) and therefore with . These stars will be fainter than our limiting magnitude during much of their pulsation cycle and it is not surprising that we do not actually identify others.
| Sibbons+ | RA | Dec | |||
|---|---|---|---|---|---|
| 8310 | 16.203081 | 2.037964 | 20.581 | 19.587 | 18.368 |
| 9409 | 16.214640 | 2.063861 | 19.932 | 18.087 | 16.640 |
| 10697 | 16.304150 | 2.085250 | 19.618 | 18.161 | 16.531 |
| 10922 | 16.181959 | 2.088694 | 19.484 | 17.841 | 16.743 |
| 11103 | 16.091618 | 2.091228 | 19.025 | 17.380 | 16.291 |
| 12772 | 16.299379 | 2.112383 | 19.660 | 18.030 | 16.915 |
| 13031 | 16.219521 | 2.115672 | 19.007 | 17.468 | 16.088 |
| 13166 | 16.177704 | 2.117122 | 19.484 | 17.792 | 16.489 |
| 13343 | 16.252777 | 2.119403 | 19.201 | 17.622 | 16.759 |
| 14597 | 16.187973 | 2.134992 | 19.105 | 17.662 | 16.668 |
| 16335 | 16.108934 | 2.159931 | 17.915 | 16.540 | 15.543 |
| 17381 | 16.294380 | 2.176472 | 19.623 | 18.531 | 17.483 |
| 18237 | 16.172691 | 2.192831 | 19.464 | 18.054 | 17.015 |
| 18859 | 16.176949 | 2.205914 | 19.883 | 18.500 | 17.612 |
| 18925 | 16.248026 | 2.207578 | 19.240 | 17.369 | 16.524 |
| 19795 | 16.235384 | 2.227403 | 19.298 | 17.805 | 16.513 |
| 20671 | 16.235109 | 2.252667 | 20.377 | 19.610 | 18.194 |
| 20772 | 16.242823 | 2.255681 | 20.803 | 19.089 | 18.652 |
10 Bolometric Magnitudes and Distances
In the discussion of distances below we follow the same procedure for determining bolometric magnitudes as in our previous papers because this will give us consistent values that are useful, at least, for estimating distances via the period luminosity (PL) relation. Note that the caveats outlined at the start of section 7 of Whitelock et al. (2013) apply as much to the present work on IC 1613 as they did to NGC 6822.
The photometry was reddening corrected assuming mag, which makes some allowance for reddening internal to IC 1613 (e.g. Georgiev et al. 1999).
Bolometric magnitudes for presumed C stars were calculated by applying a colour-dependent bolometric correction to the reddening-corrected magnitudes on the SAAO photometric system (Whitelock et al. 2009).
The Carpenter (2001; web page update222www.astro.caltech.edu/jmc/2mass/v3/transformations/) formulation is used to transform from the 2MASS system (Table 6) to the SAAO system. The resulting bolometric magnitudes are listed in the same table. Fig.12 shows the PL relation. Nine stars is insufficient to determine both a slope and a zero-point for the PL relation, so we assume that the slope of the PL-relation derived for the Large Magellanic Cloud (LMC) will apply to IC 1613 and use the expression:
| (4) |
This enables us to determine the distance modulus of IC 1613 with respect to the LMC, assuming that the LMC has mag (Feast 2013). The fact that the slope of the PL relation determined for 50 stars in NCC 6822 (Whitelock et a. 2013) was identical, within the uncertainties, to that of the LMC gives us confidence that this is a valid assumption.
The distance modulus derived for IC 1613 is mag, where the error is statistical and does not take into account any additional uncertainty in the slope of the PL relation or distance to the LMC. If we leave G3083 out of the solution, because of the uncertainty in its period, we derive mag.
Whilst this is the first estimate of the IC 1613 distance from Mira variables, there have been many attempts to derive it in other ways, e.g., Classical Cepheids, RR Lyrae variables, TRGB, Red Clump. Summaries have been given by, among others, Bernard et al. (2010) and Scowcroft et al. (2013). Bernard et al. (their fig. 16) standardize previous results to an adopted LMC modulus of and a reddening of . They find a mean of various estimates to be , where we have converted their value to our adopted LMC distance modulus (18.50 mag). The quoted error is internal only. Two recent multicolour studies of Classical Cepheids in IC 1613 (Pietrzyński et al. 2006, Scowcroft et al. 2013), when adopting an LMC modulus of 18.50, lead to and (internal errors only), respectively, and and , respectively. Uncertainty in the reddening, illustrated by the three estimates given above, will obviously affect optical observations more severely than those in the near- or mid-infrared. Some modulus derivations, including those obtained from optical observations of RR Lyrae variables, rely on an adopted metallicity. Others, including the Classical Cepheid determinations just mentioned, assume metallicity effects are negligible There is some evidence (Majaess et al. 2014) that the Cepheids in the central region of IC 1613 are affected by crowding. Their results indicate that, allowing for such an effect by excluding Cepheids in the crowded centre, would increase the Cepheid distances just mentioned by mag. Finally, although a common LMC modulus is adopted, there is no guarantee that all the LMC calibrators are at the same mean distance (see for instance Feast et al. 2012). Given the above our current estimate of from Miras is well within the uncertainties of other estimates. As in our previous work on other local group galaxies, this confirms the reliability of these objects as distance indicators.
The PL() diagram is shown in Fig. 13, where the line uses the distance modulus derived above in the relation for O-rich stars in the Galaxy (Whitelock et al. 2008):
| (5) |
In comparison to the PL() relation in NGC 6822 (Whitelock et al. 2013 fig 8) the absence of C stars below the PL relation is very noticeable. This is almost certainly a selection effect caused by the limited depth of our survey; many of the redder sources we found in NGC 6822 would not have been detected had they been at the distance of IC 1613 and mag fainter.
The fact that the luminous O-rich stars lie above the PL relationship in Figs.13 and 12 is another indication that these stars are undergoing HBB, supporting the conclusions from the presence of lithium (section 4) and the isochrone fits (section 9). The implications of this are discussed further in the conclusion (section 11) below.


11 conclusions
It has already been established that star formation in IC 1613 took place over a very long period (Skillman et al. 2014). Our observations support this and indicate a clear young (few yrs) AGB population, a significant population with ages up to a few yrs as well as indications of a much older ( Gyr) population. A deeper survey is required to say more about the older AGB variables and to identify post-HBB stars with thick shells.
It seems that IC 1613 offers a potentially very interesting environment in which to test AGB evolution and in particular the lifetimes and flux contributions from HBB and stars with high mass-loss rates. Deeper and more detailed observations in the near-infrared and at longer wavelengths will be needed to provide an effective test of the models. This type of work could go some way to resolving the controversy associated with the fraction of light from intermediate age AGB stars that is contributed to the integrated infrared flux of galaxies at moderate redshift (e.g., Maraston et al. 2006; Zibetti et al. 2013).
Selecting stars by colour rather than by their variability provides a distinctly different sample of AGB stars and in particular misses some of the most luminous large amplitude O-rich AGB stars. It will be important to recognize this in future.
Whitelock et al. (2003) suggested that the luminous O-rich Miras that lie above the PL relation in the LMC are hot bottom burning. The discovery of lithium in the spectrum of G3011, a luminous Mira in IC 1613, together with the ages implied from the isochrone fits to this and similar variables, provides strong support for this idea. It also leads us to suggest that more attention should be given to stars with large amplitude pulsations that lie above the fundamental PL relation. These may be pulsating in the first overtone (Feast 2009) and, unlike fundamental pulsators, are not at the end of their AGB evolution. The Marigo et al. (2008) isochrones indicate that they have a great deal of mass to loose before becoming white dwarfs. It seem possible that they evolve into OH/IR stars, or possibly extreme C-stars, at a later stage after HBB terminates. As OH/IR stars they would have much longer periods, be enshrouded in dust, and presumably pulsate in the fundamental mode.
This work demonstrates that a small (1.4m) telescope can be used to make a very reasonable estimate of the distances to Mira variables at around 750kpc. It will obviously be possible to use larger telescopes to get a bigger sample of AGB variables in IC 1613 and make a more accurate distance measurement.
Acknowledgements
This paper is based on observations made with the Southern African Large Telescope (SALT) and the IRSF and makes use of observations from the LCOGT network. The IRSF project is a collaboration between Nagoya University and the South African Astronomical Observatory (SAAO) supported by the Grants-in-Aid for Scientific Research on Priority Areas (A) (No. 10147207 and No. 10147214) and Optical & Near-Infrared Astronomy Inter-University Cooperation Program, from the Ministry of Education, Culture, Sports, Science and Technology (MEXT) of Japan and the National Research Foundation (NRF) of South Africa. This publication makes extensive use of the various databases operated by CDS, Strasbourg, France and specifically makes use of UKIDSS data as defined in Lawrence et al (2007). We thank Martha Boyer for discussion on the nature of the object we named G3188 and for providing access to her DUSTiNGS data ahead of its publication. MWF, JWM and PAW gratefully acknowledge the receipt of research grants from the National Research Foundation (NRF) of South Africa. We are grateful to Steve Crawford for assistance with the SALT spectrum. We would also like to thank Serge Demers for sending us data from his publication with L. Albert and W. E. Kunkel, and to thank Victoria Scowcroft for her communication about the Cepheid.
References
- [] Albert L., Demers S., Kunkel W. E. 2000, ApJ, 119, 2780
- [] Ahn C. P., et al. 2012, ApJS, 203, 21
- [] Antonello E., Mantegazza L., Fugazza D., Bossi M., Covino S. 1999, A&A, 349, 55
- [] Antonello E., Fugazza D., Mantegazza L., Bossi M., Covino S. 2000, A&A, 363, 29
- [] Battinelli P., Demers S. 2011, A&A, 525, 69
- [] Bernard E. J., Aparicio A., Gallart C., Padilla-Torres C. P., Panniello M. 2007, AJ, 134, 1124
- [] Bernard E. J., et al. 2010, ApJ 712, 1259
- [] Blum R. D. 2006, AJ, 132, 2034
- [] Bono G., Marconi M., Cassisi, S., Caputo F., Gieren W., Pietrzynski G. 2005, Ap.J., 621, 966
- [] Borissova J., Georgiev L., Kurtev R., Rosado M., Ivanov V. D., Richer M., Valdez-Gutiérrez M. 2000, RMxAA, 36, 151
- [] Bouret J.-C., Lanz T., Hillier D. J., Martins F., Marcolino W. L. F., Depagne, E. 2015, MNRAS in press
- [] Boyer M. L., Skillman E. D., van Loon J. Th., Gehrz R. D., Woodward C. E. 2009, ApJ, 697, 1993
- [] Boyer M. L. et al. 2015, ApJS, 216, 10
- [1] Britavsky N. E., Bonanos A. Z., Mehner A., García-Álvarez D, Prieto J. L., Morrell N. I. 2014, A&A, 562, A75
- [] Carpenter J. M. 2001, AJ, 121, 2851
- [] Crawford S. M. et al. 2010, SPIE, 7737, 25
- [] Davis D. 1947, ApJ, 106, 28
- [] Drake A. J., et al. 2014, ApJS, 213, 9
- [] Elias J. H., Frogel J. A. 1985, ApJ, 289, 141
- [] Feast M. W. 2009, in: Ueta, Matsunaga, Ita, (eds.) AGB Stars and Related Phenomena, a conference in honour of Y. Nakada, p. 48
- [] Feast M. W. 2013, In: Planets, Stars and Stellar Systems Vol. 5, (eds.) Oswalt T. D., Gilmore G., ISBN 978-94-007-5611-3. Springer, Dordrecht, p. 829
- [] Feast M. W., Whitelock P. A. 1987, in Kwok S., Pottasch S. R., (eds.) Late Stages of Stellar Evolution, Reidel, Dordrecht, p.33
- [] Feast M. W., Whitelock P. A., Menzies J. W. 2006, MNRAS, 369, 791
- [] Feast M. W., Whitelock P. A., Menzies J. W. 2002, MNRAS, 329, L7
- [] Feast M. W., Whitelock P. A., Menzies J. W., Matsunaga N. 2012, MNRAS, 421, 2998
- [] Flesch E. 2010, PASA, 27 , 283
- [] Garcia M., Herrero A., Najarro F., Lennon D. J., Alejandro U. M. 2014, ApJ, 788, 64
- [] García-Berro E., Torres S., Althaus, L. G., Miller Bertolami M. M. 2014, A&A, 571, 56
- [] Georgiev L., Borissova J., Rosado M., Kurtev R., Ivanov G., Koenigsberger, G. 1999 A&AS, 134, 21
- [] Herrero A., Garcia M., Uytterhoeven K., Najarro F., Lennon D.J., Vink J. S., Castro N. 2010, A&A 513, A70
- [] Hodgkin S. T., Irwin M. J., Hewett P. C., Warren S. J. 2009, MNRAS, 394, 675
- [] Humphreys R. M. 1980, ApJ, 238, 65
- [] Jackson D. C., Skillman E. D., Gehrz R. D.. Polomski E., Woodward C. E. 2007, ApJ, 667, 891
- [] Kirby E.N., Bullock J.S., Boylan-Kolchin M., Kaplinghat M., Cohen J.G. 2014, MNRAS ,439, 1015
- [] Kurtev R., Georgiev L., Borissova J., Li W.D., Filippenko A. V., Treffers R. R. 2001, A.&A, 378, 449
- [] Lawrence A. et al. 2007, MNRAS, 379, 1599
- [] Majaess D., Turner D. G., Gieren W., Ngeow C. 2014, A&A, 572, 64
- [] Mantegazza L., Antonello E., Fugazza D., Bossi M., Covino S. 2001, A&A 367, 769
- [] Maraston C., et al. 2006, ApJ, 652, 85
- [] Marigo P., Girardi L., Bressan A., Groenewegen M. A. T., Silva L., Granato G. L. 2008, A&A, 482, 883
- [] Menzies J., Feast M., Tanabé T., Whitelock P., Nakada Y., MNRAS 2002, 335, 923
- [] Menzies J., Feast M., Whitelock P., Olivier E., Matsunaga N., da Costa G. 2008, MNRAS, 385, 1045
- [] Menzies J., Whitelock P., Feast M., Matsunaga N. 2010, MNRAS, 406, 86
- [] Menzies J., Feast M., Whitelock P., Matsunaga N. 2011, MNRAS, 414, 3492
- [] Nagayama T., et al. 2003, SPIE, 4841, 459
- [] Pietrzyński G., Gieren W., Soszyński I., et al. 2006, ApJ, 642, 216
- [] Saha A., Freedman W. L., Hoessel J. G., Mossman A. E. 1992, AJ, 104, 1072
- [] Samus N. N., et al. 2013, General Catalogue of Variable Stars, Institute of Astronomy of Russian Academy of Sciences and Sternberg State Astronomical Institute of the Moscow State University (GCVS)
- [] Sandage A. 1971, ApJ, 166, 13
- [] Schlegel D. J., Finkbeiner D. P., Davis M. 1998, ApJ, 500, 525
- [] Sibbons L. F., Ryan S. G., Irwin, M., Napiwotzki R. 2015, A&A, 573, 84
- [] Skillman E. D., Hidalgo S. L., Weisz D. R., Monelli M., Gallart C., Aparicio A., Bernard E. J., Boylan-Kolchin M., Cassisi S., Cole A. A., Dolphin A. E., Ferguson H. C., Mayer L., Navarro J. F., Stetson P. B., Tolstoy E. 2014, ApJ, 786, 44
- [] Soszyński I. 2009, AcA, 59, 239
- [] Scowcroft V., Freedman W. L.., Madore B. F., Monson A. J., Persson S. E., Seibert M., Rigby J. R., Melbourne J. 2013, ApJ, 773, 106
- [] Udalski A. et al. 2001, AcA, 51, 221 (OGLE II)
- [] Whitelock P. A., Feast M. W. 2002, Mem. Soc. Ast. It., 71, 601
- [] Whitelock P. A., Feast M. W., van Loon J. Th., Zijlstra A. A., 2003, MNRAS, 342, 86
- [] Whitelock P. A., Feast M. W., Marang F., Groenewegen M. A. T. 2006, MNRAS, 369, 751
- [] Whitelock P. A., Feast M. W., van Leeuwen F. 2008, MNRAS, 386, 313
- [] Whitelock P. A., Menzies J. W., Feast M. W., Matsunaga N., Tanabé T., Ita Y. 2009, MNRAS, 394, 795
- [] Whitelock P. A., Menzies J. W., Feast, M. W., Nsengiyumva F., Matsunaga N. 2013, MNRAS, 428, 2216
- [] Zibetti S., Gallazzi A., Charlot S., Pierini D., Pasquali A. 2013, MNRAS, 428, 1479