The Limits of Leverage
Paolo Guasoni†
Boston University and Dublin City University
Eberhard Mayerhofer ‡
University of Limerick
When trading incurs proportional costs, leverage can scale an asset’s return only up to a maximum multiple, which is sensitive to its volatility and liquidity. In a model with one safe and one risky asset, with constant investment opportunities and proportional costs, we find strategies that maximize long term returns given average volatility. As leverage increases, rising rebalancing costs imply declining Sharpe ratios. Beyond a critical level, even returns decline. Holding the Sharpe ratio constant, higher asset volatility leads to superior returns through lower costs.
Keywords: leverage, transaction costs, portfolio choice.
Mathematics Subject Classification (2010): 91G10, 91G80
JEL Classification: G11, G12
1. Introduction
If trading is costless, leverage can scale returns without limits. Using the words of Sharpe (2011):
“If an investor can borrow or lend as desired, any portfolio can be leveraged up or down. A combination with a proportion invested in a risky portfolio and in the riskless asset will have an expected excess return of [times the excess return of the risky portfolio] and a standard deviation equal to times the standard deviation of the risky portfolio. Importantly, the Sharpe Ratio of the combination will be the same as that of the risky portfolio.”
In theory, this insight implies that the efficient frontier is linear, that efficient portfolios are identified by their common maximum Sharpe ratio, and that any of them spans all the other ones. Also, if leverage can deliver any expected return, then risk-neutral portfolio choice is meaningless, as it leads to infinite leverage.
In practice, hedge funds and high-frequency trading firms employ leverage to obtain high returns from small relative mispricing of assets. A famous example is Long Term Capital Management, which used leverage of up to 40 times to increase returns from convergence trades between on-the-run and off-the-run treasury bonds (for example, see Edwards (1999)).
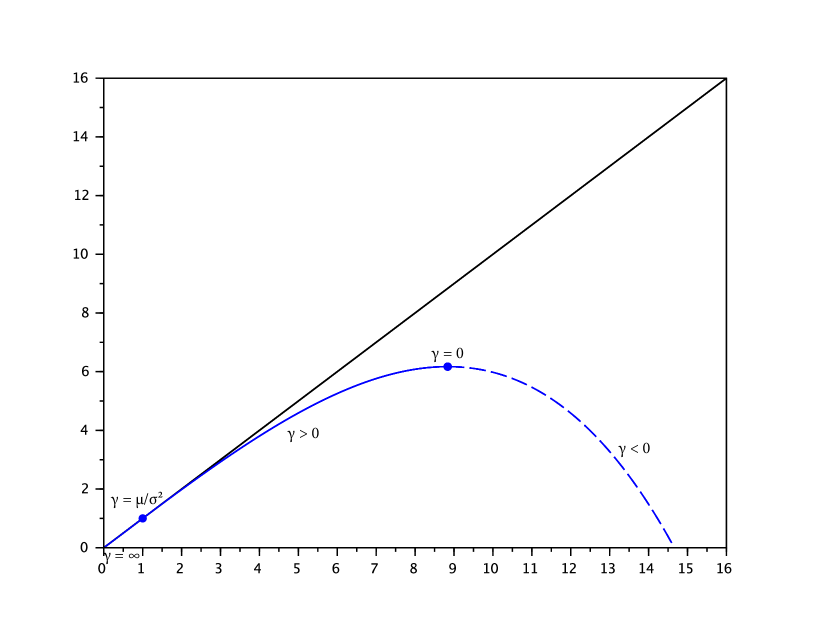
This paper shows that trading costs undermine these classical properties of leverage and set sharp theoretical limits to its applications. We start by characterizing the set of portfolios that maximize long term expected returns for given average volatility, extending the familiar efficient frontier to a market with one safe and one risky asset, where both investment opportunities and relative bid-ask spreads are constant. Figure 1 plots this frontier: expectedly, trading costs decrease returns, with the exception of a fully safe investment (the axes origin) or a fully risky investment (the attachment point with unit coordinates), which lead to static portfolios without trading, and hence earn their frictionless returns.111As we focus on long term investments, we neglect the one-off costs of set up and liquidation, which are negligible over a long holding period.
But trading costs do not merely reduce expected returns below their frictionless benchmarks. Unexpectedly, in the leverage regime (to the right of the full-investment point) rebalancing costs rise so quickly with volatility that returns cannot increase beyond a critical factor, the leverage multiplier. This multiplier depends on the relative bid-ask spread , the expected excess return and volatility , and approximately equals
| (1.1) |
Table 1 shows that even a modest bid-ask spread of 0.10% implies a multiplier of 23 for an asset with 10% volatility and 5% expected return (similar to a long-term bond), while the multiplier declines to 10 for an asset with equal Sharpe ratio, but volatility of 50% (similar to an individual stock). Leverage opportunities are much more limited for more illiquid assets with a spread of 1%: the multiplier declines from less than 8 for 10% volatility to less than 4 for 50% volatility. Importantly, these limits on leverage hold even allowing for continuous trading, infinite market depth (any quantity trades at the bid or ask price), and zero capital requirements.
| Bid-Ask Spread () | |||
|---|---|---|---|
| Volatility () | 0.01% | 0.10% | 1.00% |
| 10% | 71.85 (71.22) | 23.15 (22.58) | 7.72 (7.12) |
| 20% | 50.88 (50.36) | 16.45 (15.92) | 5.56 (5.04) |
| 50% | 32.30 (31.85) | 10.54 (10.07) | 3.66 (3.18) |
Our results have two broad implications. First, with a positive bid-ask spread even a risk-neutral investor who seeks to maximize expected long-run returns takes finite leverage, and in fact a rather low leverage ratio in an illiquid market – risk-neutral portfolio choice is meaningful. The resulting multiplier sets an endogenous level of risk that the investor chooses not to exceed regardless of risk aversion, simply to avoid reducing returns with trading costs. In this context, margin requirements based on volatility (such as value at risk and its variations) are binding only when they reduce leverage below the multiplier, and are otherwise redundant. In addition, the multiplier shows that an exogenous increase in trading costs, such as a proportional Tobin tax on financial transactions, implicitly reduces the maximum leverage that any investor who seeks return is willing to take, regardless of risk attitudes.
Second, two assets with the same Sharpe ratio do not generate the same efficient frontier with trading costs, and more volatility leads to a superior frontier. For example (Table 1) with a 1% spread, the maximum leveraged return on an asset with 10% volatility and 5% return is . By contrast, an asset with 50% volatility and 25% return (equivalent to the previous one from a classical viewpoint, as it has the same Sharpe ratio 0.5), leads to a maximum leveraged return of . The reason is that a more volatile asset requires a lower leverage ratio (hence lower rebalancing costs) to reach a certain return. Thus, an asset with higher volatility spans an efficient frontier that achieves higher returns through lower costs.
This paper bears on the established literature on portfolio choice with frictions. The effect of transaction costs on portfolio choice is first studied by Magill and Constantinides (1976), Constantinides (1986), and Davis and Norman (1990), who identify a wide no-trade region, and derive the optimal trading boundaries through numerical procedures. While these papers focus on the maximization of expected utility from intertemporal consumption on an infinite horizon, Taksar, Klass and Assaf (1988), and Dumas and Luciano (1991) show that similar strategies are obtained in a model with terminal wealth and a long horizon – time preference has negligible effects on trading policies. This paper adopts the same approach of a long horizon, both for the sake of tractability, and because it focuses on the trade-off between return, risk, and costs, rather than consumption.
Our asymptotic results for positive risk aversion are similar in spirit to the ones derived by Shreve and Soner (1994), Rogers (2004), Gerhold, Guasoni, Muhle-Karbe and Schachermayer (2014), and Kallsen and Muhle-Karbe (2015), whereby transaction costs imply a no-trade region with width of order and welfare costs of order . We also find that the trading boundaries obtained from a local mean-variance criterion are equivalent at the first order to the ones obtained from power utility.
The risk-neutral expansions and the limits of leverage of order are new, and are qualitatively different from the risk-averse case. These results are not regular perturbations of a frictionless analogue, which is ill-posed. They are rather singular perturbations, which display the speed at which the frictionless problem becomes ill-posed as the crucial friction parameter vanishes.
Finally, this paper connects to the recent work of Frazzini and Pedersen (2012) on embedded leverage. If different investors face different leverage constraints, they find that in equilibrium assets with higher factor exposures trade at a premium, thereby earning a lower return. Frazzini and Pedersen (2014) confirm this prediction across a range of markets and asset classes, and Asness et al. (2012) use it to explain the performance risk-parity strategies. With exogenous asset prices, we find that assets with higher volatility generate a superior efficient frontier by requiring lower rebalancing costs for the same return. This observation suggests that the embedded leverage premium may be induced by rebalancing costs in addition to leverage constraints, and should be higher for more illiquid assets.
The paper is organized as follows: section 2 introduces the model and the optimization problem. Section 3 contains the main results, which characterize the efficient frontier in the risk-averse (Theorem 3.1) and risk-neutral (Theorem 3.2) cases. Section 4 discusses the implications of these results for the efficient frontier, the trading boundaries of optimal policies and the embedded leverage effect. The section includes two supporting results, which show that the risk-neutral solutions arise as limits of their risk-averse counterparts for low risk-aversion (Theorem 4.1), and that the risk-neutral solutions are not constrained by the solvency condition (section 4.2). Section 5 offers a derivation of the main free-boundary problems from heuristic control arguments, and concluding remarks are in section 6. All proofs are in the appendix.
2. Model
The market includes one safe asset earning a constant interest rate of and a risky asset with ask (buying) price that follows
where is a standard Brownian motion. The risky asset’s bid (selling) price is , which implies a constant relative bid-ask spread of , or, equivalently, constant proportional transaction costs.
We investigate the trade-off between a portfolio’s average return against its realized variance. Denoting by the portfolio value at time , for an investor who observes returns with frequency in the time-interval , the average return and its continuous-time approximation are222All discrete statistics on this section converge in probability to their continuous-time counterparts. The budget equation and the definition of admissible strategies are in appendix A below.
In the familiar setting of no trading costs, , where is the portfolio weight of the risky asset, hence the average return equals the average risky exposure times its excess return, plus the safe rate.
Likewise, the average squared volatility on is obtained by the usual variance estimator applied to returns, and has the continuous-time approximation
reducing to in the absence of trading costs.
With these definitions, the mean-variance trade-off is captured by maximizing
| (2.1) |
where the parameter is interpreted as a proxy for risk-aversion.
This objective nests several familiar problems. Without trading costs it reduces to
| (2.2) |
which is maximized by the optimal constant-proportion portfolio dating back to Markowitz and Merton, and confirms that in a geometric Brownian motion market with costless trading, the objective considered here is equivalent to utility-maximization with constant relative risk aversion. With or without transaction costs, the risk-neutral objective boils down to the average annualized return over a long horizon, while reduces to logarithmic utility.
Trading costs make (2.1) lower than (2.2), as they hinder continuous portfolio rebalancing and make constant-proportion strategies unfeasible. The reason is that it is costly to keep the exposure to the risky asset high enough to achieve the desired return, and low enough to limit the level of risk – trading costs reduce returns and increase risk.
To neglect the spurious, non-recurring effects of portfolio set-up and liquidation, we focus on the Equivalent Safe Rate333In this equation the is used merely to guarantee a good definition a priori. A posteriori, optimal strategies exist in which the limit superior is a limit, hence the similar problem defined in terms of leads to the same solution.
| (2.3) |
which is akin to the one used by Dumas and Luciano (1991) in the context of utility maximization.
3. Main Results
3.1. Risk aversion and efficient frontier
The first result characterizes the optimal solution to the main objective in (2.3) in the usual case of a positive aversion to risk (). In this setting, the next theorem shows that trading costs create a no-trade region around the frictionless portfolio , and states the asymptotic expansions of the resulting average return and standard deviation444The exact formulae for average return, standard deviation, and average trading costs are in Appendix C., thereby extending the familiar efficient frontier to account for trading costs.
Theorem 3.1.
Let .
-
(i)
For any there exists such that for all , there is a unique solution , with , for the free boundary problem
(3.1) (3.2) (3.3) (3.4) (3.5) -
(ii)
The trading strategy that buys at and sells at as little as to keep the risky weight within the interval is optimal.
-
(iii)
The maximum performance is
(3.6) where is the set of admissible strategies in Definition A.1 below, is the number of shares held at time , and is the cumulative number of shares sold up to time .
-
(iv)
The trading boundaries and have the asymptotic expansions
(3.7) The long-run mean (), standard deviation (), Sharpe ratio (), average trading costs () and equivalent safe rate () have expansions555We are using the convention for any and odd integer , and .
(3.8) (3.9) SR (3.10) (3.11) (3.12)
3.2. Risk neutrality and limits of leverage
In contrast to the risk-averse objective considered above, the risk-neutral objective leads to a solution which does not have a frictionless analogue: for small trading costs, both the optimal policy and its performance become unbounded as the optimal leverage increases arbitrarily. The next result describes the solution to the risk-neutral problem, identifying the approximate dependence of the leverage multiplier and its performance on the asset’s risk, return and liquidity.
Theorem 3.2.
Let .
- (i)
-
(ii)
The trading strategy that buys at and sells at as little as to keep the risky weight within the interval is optimal.
-
(iii)
The maximum expected return is
(3.13) -
(iv)
The trading boundaries have the series expansions
(3.14) (3.15) where is the unique solution to
(3.16)
Proof.
See Appendix D below. ∎
The next section discusses how these results modify the familiar intuition about risk, return, and performance evaluation in the context of trading costs.
4. Implications and Applications
4.1. Efficient frontier
Theorem 3.1 extends the familiar efficient frontier to account for trading costs. Compared to the linear frictionless frontier, average returns decline because of rebalancing losses. Average volatility increases because more risk becomes necessary to obtain a given return net of trading costs.
To better understand the effect of trading costs on return and volatility, consider the dynamics of the portfolio weight in the absence of trading, which is
| (4.1) |
The central quantity here is the portfolio weight volatility , which vanishes for the single-asset portfolios or , remains bounded above by in the long-only case , and rises quickly with leverage (). This quantity is important because it measures the extent to which a portfolio, left to itself, strays from its initial composition in response to market shocks and, by reflection, the quantity of trading that is necessary to keep it within some region. In the long-only case, the portfolio weight volatility decreases as the no-trade region widens to span , which means that a portfolio tends to spend more time near the boundaries. By contrast, with leverage portfolio weight volatility increases, which means that a wider boundary does not necessarily mitigate trading costs.
Consistent with this intuition, equation (3.8) shows that the impact of trading costs is small on long-only portfolios, but rises quickly with leverage, reducing returns at the order of for . Of course, this expansion is valid for small while holding the value of fixed. As declines to zero, both the expected return and volatility diverge, but so does the impact of trading costs, making the asymptotics for uninformative for the risk-neutral limit .
The performance (3.12) coincides at the first order with the equivalent safe rate from utility maximization with constant relative risk aversion (Gerhold et al., 2014, Equation (2.4)), supporting the interpretation of as a risk-aversion parameter, and confirming that, for asymptotically small costs, the efficient frontier captures the risk-return trade-off faced by a utility maximizer.
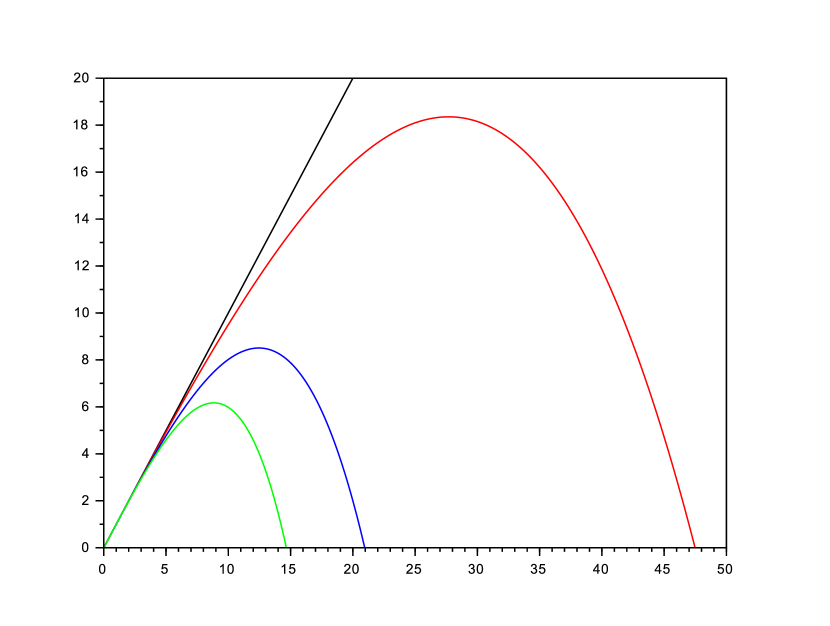
Figure 2 displays the effect of trading costs on the efficient frontier. As the bid-ask spread declines, the frontier increases to the linear frictionless frontier, and the asymptotic results in the theorem become more accurate. However, if the spread is held constant as leverage (hence volatility) increases, the asymptotic expansions become inaccurate, and in fact the efficient frontier ceases to increase at all after the leverage multiplier is reached.
4.2. Trading boundaries
Each point in the efficient frontier corresponds to a rebalancing strategy that is optimal for some value of the risk-aversion parameter . For small trading costs, equation (3.7) implies that the trading boundaries corresponding to the efficient frontier depart from the ones arising in utility maximization, which are (Gerhold et al., 2014)
| (4.2) |
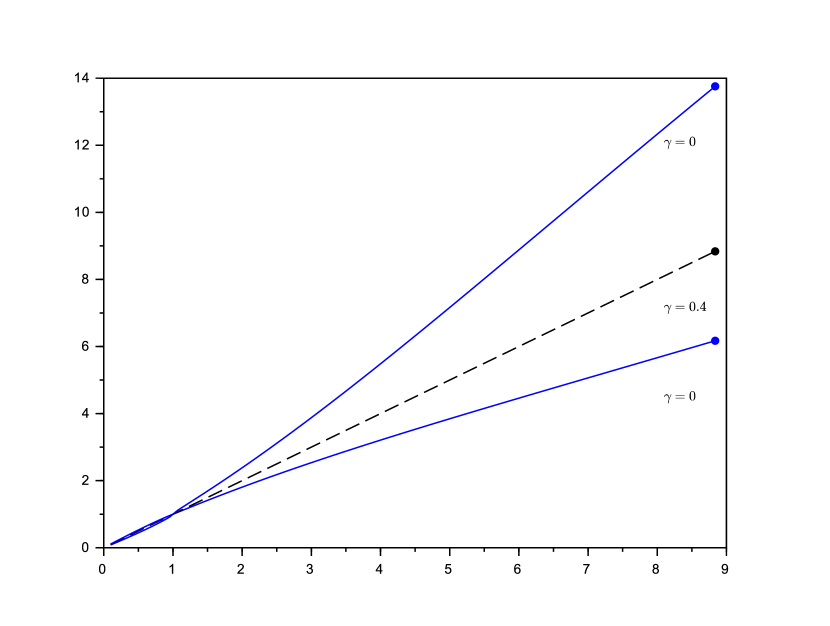
The term of order vanishes for because this case coincides with the maximization of logarithmic utility. For high levels of leverage ( and ), this term implies that the trading boundaries that generate the efficient frontier are lower than the trading boundaries that maximize utility. In Figure 3, corresponds to the safe portfolio in the origin (0,0), while to the risky investment (1,1), which has by definition the same volatility and return as the risky asset. As declines to zero, the trading boundaries converge to the right endpoints, which correspond to the strategy that maximizes average return with no regard for risk, thereby achieving the multiplier.
As leverage increases, the sell boundary rises more quickly than the buy boundary (Figure 3). For example, the risk-neutral portfolio tolerates leverage fluctuations from approximately to . The locations of these boundaries trade off the need to keep exposure to the risky asset high to maximize return while also keeping rebalancing costs low. Risk aversion makes boundaries closer to each other by penalizing the high realized variance generated by the wide risk-neutral boundaries.
Importantly, these boundaries remain finite even as the frictionless Merton portfolio diverges to infinity with declining to zero. Thus the no-trade region is not symmetric around the frictionless portfolio, in contrast to the boundaries arising from utility maximization (Gerhold et al., 2014), which are always symmetric, and hence diverge when is low. The difference is that here the risk-neutral objective is to maximize the expected return of the portfolio, while a risk-neutral utility maximizer focuses on expected wealth. In a frictionless setting this distinction is irrelevant, and an investor can use a return-maximizing policy to maximize wealth instead. But trading costs drive a wedge between these two ostensibly equivalent risk-neutral criteria – maximizing expected return is not the same as maximizing expected wealth.
In the risk-neutral case (Theorem 3.2 (iv)) the optimal trading boundaries satisfy the approximate relation
| (4.3) |
which is universal in that it holds for any asset, regardless of risk, return and liquidity. This relation means that an optimal risk-neutral rebalancing strategy should always tolerate wide variations in leverage over time, and that the maximum allowed leverage should be approximately 2.5 times the minimum. More frequent rebalancing cannot achieve the maximum return: it can be explained either by risk aversion or by elements that lie outside the model, such as price jumps.
Finally, note that the solvency constraint that wealth remain positive at all times implies that666 Any potentially optimal strategy has positive exposure (), as the asset price has a positive risk premium (Remark A.4 below). Denoting by the safe position at time , where is total portfolio wealth, the liquidation value is , which implies and thus the claim. for every admissible trading strategy. As for the optimal trading strategy in Theorem 3.1 and Theorem 3.2, the upper bound is never binding for realistic bid-ask-spreads.
4.3. Embedded leverage
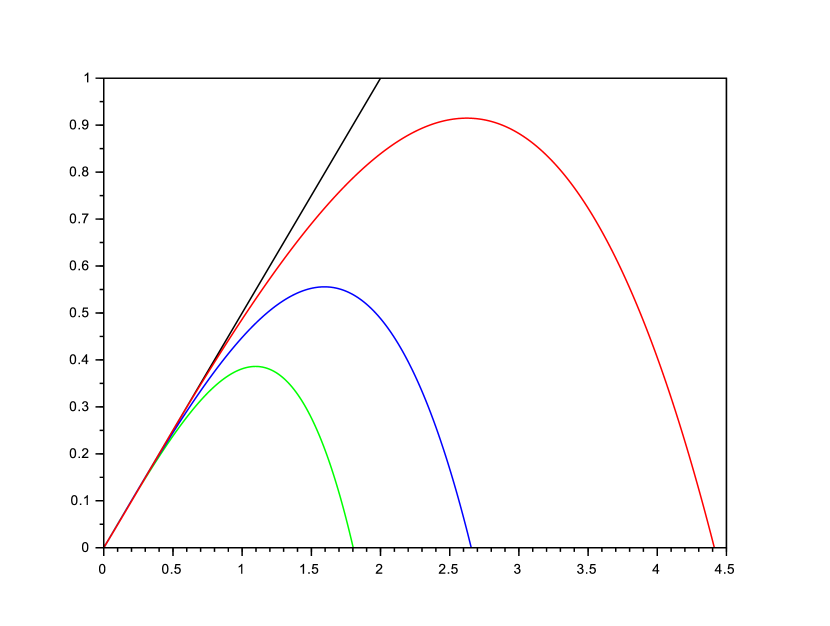
In frictionless markets, two perfectly correlated assets with equal Sharpe ratio generate the same efficient frontier, and in fact the same payoff space. This equivalence fails in the presence of trading costs: as the more volatile asset has a proportionally higher return, it can be traded to generate higher returns with lower leverage ratios, resulting in an efficient frontier that dominates (for high returns) the one generated by the less volatile asset. Figure 4 (top of the three curves) displays this phenomenon: for example, a portfolio with an average return of 50% net of trading costs is obtained from an asset with 25% return and 50% volatility at a small cost, as an average leverage factor of 2 entails moderate rebalancing.
Achieving the same 50% return from an asset with 20% volatility (and 10% return) is more onerous: trading costs require leverage higher than 5, which in turn increases trading costs. Overall, the resulting portfolio needs about 120% rather than 100% volatility to achieve the desired 50% average return (middle curve in Figure 4).
From an asset with 10% volatility (and 5% return), obtaining a 50% return net of trading costs is impossible (bottom curve in Figure 4), because the leverage multiplier is less than 8 (Table 1, top right), and therefore the return can be scaled to less than 40%. The intuition is clear: increasing leverage also increases trading costs, which in turn call for more leverage to increase return, but also increase costs. At some point, the marginal net return from more leverage becomes zero, and further increases are detrimental.
Because an asset with higher volatility is superior to another one, with equal Sharpe ratio and perfectly correlated, but with lower volatility, the model suggests that in equilibrium they cannot coexist, and that the asset with lower volatility should offer a higher return to be held by investors. Indeed, Frazzini and Pedersen (2012, 2014) document significant negative excess returns in assets with embedded leverage (higher volatility), and offer a theoretical explanation based on heterogeneous leverage constraints, which lead more constrained investors to bid up prices (and hence lower returns) of more volatile assets. Our results hint that the same phenomenon may arise even in the absence of constraints, as a result of rebalancing costs. In contrast to constraints-based explanations, our model suggests that the premium for embedded leverage should be higher for more illiquid assets.
4.4. From risk aversion to risk neutrality
Theorems 3.1 and 3.2 are qualitatively different: while Theorem 3.1 with positive risk aversion leads to a regular perturbation of the Markowitz-Merton solution, Theorem 3.2 with risk-neutrality leads to a novel result with no meaningful analogue in the frictionless setting – a singular perturbation. Furthermore, a close reading of the statement of Theorem 3.1 shows that the existence of a solution to the free-boundary problem, and the asymptotic expansions, hold for less than some threshold that depends on the risk aversion . In particular, if approaches zero while is held constant, Theorem 3.1 does not offer any conclusions on the convergence of the risk-averse to the risk-neutral solution. Still, if the risk-neutral result is to be accepted as a genuine phenomenon rather than an artifact, it should be clarified whether the risk averse trading policy and its performance converge to their risk neutral counterparts as risk aversion vanishes. The next result resolves this point under some parametric restrictions. Denote by
and associate to any solution of the free boundary problem (3.1) the function
which naturally extends to the left and right of the free-boundaries.
Theorem 4.1.
Let , , and , and assume that for any the free boundary problem (3.1) has a unique solution satisfying and that the function satisfies, for each , the HJB equation
| (4.4) |
Then, (4.4) is satisfied also for , and for each , the trading strategy that buys at and sells at to keep the risky weight within the interval is optimal. Furthermore, and as , each .
5. Heuristic Solution
This section offers a heuristic derivation of the HJB equation. Let and denote the cumulative number of shares bought and sold, respectively. The finite-horizon objective (2.1) reduces to the expression (compare eq. (A.8) in Lemma A.2 below)
| (5.1) |
From the outset, this objective is scale-invariant: doubling the initial number of risky shares and safe units, and also doubling the number of shares held at time results in doubling also the number of safe units at time (through the self-financing condition), thereby leaving , , and hence the objective, unchanged. Thus, we conjecture that the residual value function depends on the calendar time and on the variable , which denotes the number of shares held for each unit of the safe asset. In terms of this variable, the conditional value of the above objective at time becomes:
| (5.2) |
By Itô’s formula, the dynamics of is (henceforth the arguments of are omitted for brevity)
where the subscripts of denote partial derivatives. Recall now the self-financing condition for the safe position and the risky position :
which implies the dynamics for the risky-safe ratio
whence the dynamics of simplifies to
| (5.3) | ||||
| (5.4) |
Now, by the martingale principle of optimal control (Davis and Varaiya, 1973) the process above needs to be a supermartingale for any trading policy and a martingale for the optimal policy. As and are increasing processes, the supermartingale condition implies777In particular, the coefficients of and need to be negative. As short positions are never optimal (cf. Remark A.3 and footnote 6), it follows that , whence only two cases arise: (a) , or (b) . In both cases and , whence (5.5) follows. the inequalities
| (5.5) |
and the martingale condition prescribes that the left (respectively, right) inequality becomes an equality at the points of increase of (resp. ). Likewise, it follows that
with the inequality holding as an equality whenever both inequalities in (5.5) are strict. To achieve a stationary (that is, time-homogeneous) system, suppose that the residual value function is of the form for some to be determined, which represents the average optimal performance over a long period of time. Replacing this parametric form of the solution, the above inequalities become
| (5.6) | |||
| (5.7) |
Assuming further that the first inequality holds over some interval , with each inequality reducing to an equality at the respective endpoint, the optimality conditions become
| (5.8) | ||||
| , | (5.9) |
which lead to a family of candidate value functions, each of them corresponding to a pair or boundaries (). The optimal boundaries are identified by the smooth-pasting conditions, formally derived by differentiating eqs. (5.9) with respect to their boundaries
| (5.10) |
These conditions identify the value function. The four unknowns are the free parameter in the general solution to the ordinary differential equation (5.8), the free boundaries and , and the optimal rate . These quantities are identified by the boundary and smooth-pasting conditions (5.9)–(5.10).
6. Conclusion
The costs of rebalancing a leveraged portfolio are substantial, and detract from its ostensible frictionless return. As leverage increases, such costs rise faster than the return, making it impossible for an investor to lever an asset’s return beyond a certain multiple, net of trading costs.
In contrast to the frictionless theory, trading costs make the risk-return trade-off nonlinear. An investor who seeks high return prefers an asset with high volatility to another one with equal Sharpe ratio but lower volatility, because higher volatility makes leverage cheaper to realize. A risk-neutral, return-maximizing investor does not take infinite leverage, but rather keeps it within a band that balances high exposure with low rebalancing costs.
Appendix A Admissible Strategies
In view of transaction costs, only finite-variation trading strategies are consistent with solvency. Denote by and the wealth in the safe and risky positions respectively, and by and the cumulative number of shares bought and sold, respectively. The self-financing condition prescribes that satisfy the dynamics
| (A.1) |
A strategy is admissible if it is nonanticipative and solvent, up to a small increase in the spread:
Definition A.1.
Let (the initial capital) and let and be continuous, increasing processes, adapted to the augmented natural filtration of . Then is an admissible trading strategy if
-
(i)
its liquidation value is strictly positive at all times: There exists such that the discounted asset satisfies
(A.2) -
(ii)
The following integrability conditions hold888 Note that , therefore on the set the quantity is well-defined.
(A.3) where denotes the total variation of on .
The family of admissible trading strategies is denoted by .
The following lemma describes the dynamics of the wealth process , the risky weight , and the risky-safe ratio .
Lemma A.2.
For any admissible trading strategy , 999The notation means , hence the SDEs are well defined even for null .
| (A.4) | ||||
| (A.5) | ||||
| (A.6) |
For any such strategy, the functional
| (A.7) |
equals to
| (A.8) |
Proof.
The self-financing conditions (A.1) imply that
| (A.9) | ||||
| (A.10) | ||||
| (A.11) |
Equation (A.4) follows from the last equation, and (A.5) holds in view of equations (A.9) and (A.10). Equation (A.6) follows from the identity and (A.4). The expression in (A.8) for the objective functional follows from equation (A.5). ∎
The following lemma shows that, without loss of generality, it is enough to consider trading strategies which do not take short positions in the risky asset.
Lemma A.3.
If is optimal for (2.3), then also the strategy is optimal.
Proof.
Remark A.4.
In view of this Lemma and admissibility, it suffices to consider trading strategies which satisfy , or, in terms of the risky-safe ratio, or .
Appendix B Risk Aversion and Efficient Frontier
This section contains a series of propositions that lead to the proof of Theorem 3.1 (i)–(iii). Part (iv) of the theorem is postponed to Appendix C. Set
| (B.1) |
Defining , the free boundary problem (3.1)–(3.5) reduces to
| (B.2) | ||||
| (B.3) | ||||
| (B.4) | ||||
| (B.5) | ||||
| (B.6) |
Proposition B.1.
Proof of Proposition B.1.
Note that (B.2) is equivalent to the ODE
and thus, the initial conditions (B.3), (B.4) imply that satisfies
By the variation of constants method, and as , any solution of the initial value problem (B.2)–(B.4) is thus of the form
| (B.8) |
Suppose is a solution of (B.2)–(B.6). In view of (B.8), . Let
| (B.9) |
By the terminal conditions (B.5)–(B.6) at , and setting , satisfy the following system of algebraic equations,
| (B.10) | ||||
| (B.11) |
Conversely, if solve (B.10)–(B.11), then the triplet provides a solution to the free boundary problem (B.2)–(B.6). Therefore, to provide a unique solution of the free boundary problem, it suffices to provide a unique solution of (B.10)–(B.11).
To obtain a guess for the asymptotic expansions of the prospective solutions , expand around
| (B.12) |
which yields
| (B.13) | ||||
| (B.14) |
Equating the coefficients of the leading order terms to zero yields101010The coefficient in (B.14) vanishes also for , but (B.13) does not, excluding such a case.
| (B.15) | ||||
| (B.16) |
whence and solves , and thus
| (B.17) |
With the change of variables
| (B.18) |
and the notation
| (B.19) |
the system (B.10)–(B.11) for reduces to
| (B.20) |
in the unknowns . Because of (B.17), the guess (B.12) takes the explicit form
| (B.21) |
which suggests that the solution is around . Proposition B.2 below indeed guarantees the existence a unique solution around around for sufficiently small , which is analytic in . Hence, also the original system has a unique solution for small , with the first order proxies (B.21). This implies that the free boundary problem (B.2)–(B.6) has a unique solution for sufficiently small .
To derive the higher order terms of (B.7), it is useful to rewrite the integral (B.9) as111111For , and .
| (B.22) |
The derivative of with respect to equals
| (B.23) |
Now, expanding the right-hand side as a power series in , and integrating with respect to yields an asymptotic expansion of .
To obtain these expansions, guess a solution of equations (B.10)–(B.11) of the form
for some unkowns , and substitute it into equations (B.10)–(B.11), thereby using (B.22) and (B.23). Comparing the coefficients in the asymptotic expansion of the two equations reveals that
and therefore (B.7) holds. ∎
Proposition B.2.
Proof.
Consider first the “general” case : Introduce the rescaled functions and defined as
| (B.24) |
where and . By scaling, the function depends on three arguments, and for the sake of clarity henceforth it is denoted by
Let be the Frechet differential of . As shown next, the Jacobian satisfies,
| (B.25) |
hence the implicit function theorem for analytic functions (Gunning and Rossi, 2009, Theorem I.B.4) ensures that for sufficiently small there exists a unique solution of around which is analytic in .
Definition B.3.
A solution of the HJB equation is a pair , where is a twice continuously differentiable function, which satisfies
| (B.26) |
where is the differential operator
Note that the restriction is motivated by Remark A.4.
Proposition B.4.
Proof of Proposition B.4.
To check that solves the HJB equation (B.26), consider separately the domains , and . From the decompositions
note first that on , by construction it holds that
Furthermore, in view of the initial conditions (B.3)–(B.4),
whence
To see that on all of , observe that
| (B.28) |
Note that for , where , . It is shown that also on all of . This is equivalent to showing non-negativity of
| (B.29) |
Now if and only if . Hence, either or , where
By the first-order asymptotics of (B.7), one obtains for sufficiently small . Therefore on , and by (B.29) it follows that on all of . To conclude the validity of the HJB equation on , it only remains to show the inequality . To this end, notice that , (this is the function defined in (B.10), with fixed ) satisfies
hence for sufficiently small , on some interval , and . Therefore, . As by construction, it suffices to show that to prove non-negativity of on . Suppose, by contradiction, that there exists a sequence such that for each , , and that . Now, change variable to , and introduce the notation , . Up to a subsequence, without loss of generality assume that converges, whence it satisfies
where is defined in (B.17), and . The calculations leading to (B.17) therefore entail that must satisfy (B.15) in place of , i.e.
| (B.30) |
With from (B.17) and the change of variable implies which has the only solutions and . Therefore, (B.30) has the only relevant solution
By intertwining and , one can introduce
Hence satisfies near , for sufficiently small . By Proposition B.2, , which contradicts our assumption .
Consider now . solves the HJB equation, if
As for , it suffices to show that is non-negative to obtain the first inequality. To this end, the explicit formula (B.28) for the derivative is used. Now for small clearly , hence for (B.28) is indeed strictly positive, hence, upon integration, one obtains the first inequality for any . To settle the second inequality, recall that either or . On these domains, is clearly a strictly positive function. Hence it is proved that satisfies the HJB equation for .
Finally, consider . As , it suffices to show
| (B.31) |
As is strictly positive, the second inequality holds. For the first inequality in (B.31), note that
and , because of (B.2), (B.5) and (B.6). Therefore it suffices to show has no zeros on , besides .
Consider first, . Using the transformation one can rewrite in terms of , denoting it by . As , polynomial division by yields
| (B.32) |
and , where
Therefore, the following asymptotic expansions hold
It follows that has no zeros on , for sufficiently small . Hence for .
Next, consider . Using the transformation one can rewrite, similar to the case , in terms of , obtaining the function . It is proved next that has no zeros on .
As , polynomial division by yields (B.32), where the third order polynomial has derivative
where the coefficients and are complex, yet explicit, functions of the parameters and the relative bid-ask spread .
In view of (B.32), it is enough to show that has no zeros on . First, note the following asymptotic expansions,
| (B.33) |
Therefore, for sufficiently small , on both endpoints of . It remains to show that any local minimum of in is non-negative. The local extrema , where , have asymptotic expansions Obviously, there are no local extrema in whenever . Therefore on all of , and thus on . The non-trivial case remains:
For it holds that , hence . It follows that has no zeros in this interval and thus on .
Next, consider : The local minimum of a third order polynomial with negative leading coefficient satisfies and . In view of (B.33), it remains to show . It holds that , whence for sufficiently small . Hence on is shown. ∎
Lemma B.5.
Let be such that either or . Then there exists an admissible trading strategy such that the risky-safe ratio satisfies SDE (A.4). Moreover, is a reflected diffusion on the interval . In particular, has stationary density equals
| (B.34) |
when , and otherwise equals
| (B.35) |
Proof.
By the solution of the Skorohod problem for two reflecting boundaries (Kruk et al., 2007), there exists a well-defined reflected diffusion satisfying , where is a standard Brownian motion. If , (resp. ) is a non-decreasing processes which increases only on the set (resp. )121212If , the terms “decreasing” and “increasing” are exchanged.. Also, or implies that or for all , almost surely. Hence for each the coefficients and are invertible, almost surely. Define the increasing processes by , . The associated measures are supported on and , respectively. Hence is a trading strategy, which by Lemma A.2 yields a risky-safe satisfying precisely the stochastic differential equation (A.4). The admissibility of the trading strategy is clear, as is a continuous, finite variation trading strategy, and it satisfies , which implies that there exists such that , for all , a.s..
The following constitutes the verification of optimality of the trading strategy of Lemma B.5 with the trading boundaries in Proposition B.1:
Proposition B.6.
Let be the free boundaries as derived in Proposition B.1, and set Denote by the trading strategy of Lemma B.5 associated with these free boundaries. Then for all , the fraction of wealth invested in the risky asset lies in the interval , almost surely, entails no trading whenever (the no-trade region) and engages in trading only at the boundaries . For sufficiently small , is optimal, and the value function is
| (B.37) |
Proof of Proposition B.6.
Recall from Proposition B.4 that and , defined from the unique solution of the free boundary problem, is a solution of the HJB equation (B.26). For the verification, the proportion of wealth in the risky asset is used instead of the risky-safe ratio . The change of variable amounts to a compactification of the real line, such that the two intervals and are mapped onto the connected interval . Denote by the differential operator
Set . The function satisfies the HJB equation
| (B.38) |
First, note that for any admissible trading strategy : By Lemma A.3 and Remark A.4, without loss of generality assume almost surely for all . An application of Itô’s formula to the stochastic process , where is the solution of the HJB equation (B.38), yields
| (B.39) | ||||
| (B.40) | ||||
| (B.41) | ||||
| (B.42) | ||||
| (B.43) |
The first term in line (B.40) is non-negative, in view of (B.38). Furthermore, (A.2) implies the existence of such that , for all , a.s. Using (B.38) one thus obtains
| (B.44) |
Hence (B.41) is a martingale with zero expectation. Again, (B.38) implies that
whence (B.42) satisfies
Taking the expectation of (B.39) yields the estimate
| (B.45) |
By eq. (B.44)
therefore . Hence letting in (B.45) implies that for any admissible strategy one has . Finally, this bound is attained by the admissible trading strategy defined by Lemma (B.5) in terms of the free boundaries : Let be the corresponding risky-safe ratio. Using Itô’s formula, one has . Division by yields, in view of (A.8),
Letting , one obtains . ∎
B.1. Proof of Theorem 3.1 (i)–(iii)
Appendix C Performance and Asymptotics
In this section, ergodicity arguments are used to derive closed-form expressions for average trading costs () and long-run mean and long-run variance of the optimal trading strategy. These formulae in turn yield the asymptotic expansions of Theorem 3.1 (iv).
C.1. The frictionless contribution
Let be the free boundaries obtained in Proposition B.1. In view of Remark A.4, assume that either (leveraged case) or throughout (non-leveraged case), and define the integral
| (C.1) |
where the normalizing constant is
| (C.2) |
Lemma C.1.
| (C.3) |
C.2. Transaction costs
For the optimal trading policy, the risky-safe ratio is a geometric Brownian motion with parameters , reflected at respectively, see Lemma B.5. Hence the following ergodic result (Gerhold et al., 2014, Lemma C.1) applies:
Lemma C.2.
Let be a diffusion on an interval , , reflected at the boundaries, i.e.
where the mappings and are both continuous, and the continuous, non-decreasing processes and satisfy and increase only on and , respectively. Denoting by the invariant density of , the following almost sure limits hold:
The next formula evaluates trading costs.
Lemma C.3.
The average trading costs for the optimal trading policy are
| (C.4) |
Proof.
C.3. Long-run mean and variance
Set
In view of the ergodic theorem (Borodin and Salminen, 2002, II.35 and II.36), the long-run mean and long-run variance satisfy
whence the following decomposition holds:
| (C.5) |
Integration by parts yields
| (C.6) |
Plugging (C.6) into (C.5) yields . Except for the singular case , one can extract , and thus (C.6) and (C.4) yield a formula for . Therefore, the right side of equation (C.5) gives a formula for in terms of :
Lemma C.5.
When , the following identities hold:
| (C.7) | ||||
| (C.8) |
C.4. Proof of Theorem 3.1 (iv)
Proof.
The asymptotic expansion (3.7) for the trading boundaries is derived by expanding into a power series, thereby using the asymptotic expansions (B.7) of .
The long-run mean , variance , Sharpe ratio (), average trading costs , and value function have closed form expressions in terms of the free boundaries (see equations (C.8), (C.7), and equations (C.4) and (B.37)). Using these formulas in combination with the asymptotic expansions (B.7) of the free boundaries, the assertion follows. ∎
Appendix D From Risk Aversion to Risk Neutrality
In this section the free boundary problem (3.1)–(3.5) for is solved for sufficiently small , it is shown that the solution allows to construct a solution of the corresponding HJB equation and, similarly to the case , a verification argument yields the strategy’s optimality.
Numerical experiments using indicate that the trading boundaries (hence the leverage multiplier) satisfy for two constants . This entails that the free boundaries have the approximation , thereby suggesting that are analytic in . The system (B.10)–(B.11) is rewritten by using the new parameter and by multiplying the second equation by :
| (D.1) | ||||
| (D.2) |
Using the transformation and noting that , it follows that
Accordingly, the system (D.1)–(D.2) transforms into
| (D.3) | ||||
| (D.4) |
Letting in (D.3)–(D.4), one obtains a system of equations for ,
| (D.5) |
Proof.
The second equation in (D.5) gives
| (D.7) |
Hence substituting (D.7) into the first equation of (D.5) gives the well-posed problem
| (D.8) |
Therefore it is enough to establish that the unique solution of (D.8) is as in the second equation in line (D.6); the formula for then follows from (D.7). To this end, substitute into (D.8) to obtain equation (3.16). Note that , on and on , while as . This implies that has a single zero on and thus the claim concerning is proved. ∎
Proposition D.2.
Proof.
Denote the left sides of (D.3)–(D.4), by , and . By Lemma D.1, . As
one obtains at , , and
where the last equality follows from the second equation in (D.5). Therefore, as , the Jacobian satisfies . By the implicit function theorem for analytic functions (Gunning and Rossi, 2009, Theorem I.B.4) the assertion follows. ∎
Lemma D.3.
Proof.
Clearly and also . There is a single local extremum of , in , namely, . Because and , must be the global maximum. Hence on , whence , as claimed. ∎
Lemma D.4.
Proof.
D.1. Proof of Theorem 3.2
Proof.
Arguing similarly as in the Proof of Proposition B.1 for the case , the solvability of the free boundary problem (3.1)–(3.5) for is equivalent to solvability of the non-linear system (D.1)–(D.2). This, in turn, is equivalent to solving the system (D.3)–(D.4) for . A unique solutions of the transformed system (D.3)–(D.4) near is provided by Proposition D.2, and one has . In particular, one obtains
| (D.11) |
The solution of (3.1)–(3.5) is
| (D.12) |
One defines exactly as in (B.27) a candidate solution of the HJB equation (B.26). Next it is shown that solves the HJB equation (B.26) (for the intervals , and finally for ). In fact, the interval is excluded.
On ,
by construction. Because of the initial conditions (3.2)–(3.3), , and thus for . Next it is shown that on all of . As is strictly positive, for . From the explicit formula (D.12) it then follows that for . It remains to show . As , and , it suffices to rule out any zero of on , for sufficiently small . This is equivalent to ruling out any zeros of
where , for sufficiently small . Recall that is implicitly defined by , . Suppose, by contradiction, that there exists and a sequence satisfying which is a solution of for each . By taking a subsequence, if necessary, one may without loss of generality assume as . Suppose first that and define the map by intertwining and as follows:
Then for sufficiently small , the pair solves (D.3)–(D.4) near , hence by Proposition D.2, , in contradiction to our previous assumption . Second, consider the case : By equation (D.3)
Lemma D.4 states , which is also impossible. Hence has no zeroes on , and thus solves the HJB equation on .
Consider now . solves the HJB equation, if
The first inequality is clearly fulfilled. Also, as or , is a strictly positive function on [, which finishes the proof for .
Finally, consider . As , it suffices to show that
| (D.13) |
The second inequality has now been proved, and it remains to establish the first inequality in (D.13). As it follows that
Therefore, by the boundary conditions at , and as solves the free boundary problem on ,
To show that for all , it suffices to show that there are no solutions of the equation on except . The transformation introduces . As , polynomial division by yields (B.32), where the third order polynomial has derivative with certain, relatively complex but explicit coefficients . By the second formula of (D.6)
| (D.14) |
is strictly positive for sufficiently small because . The zeros of are , . For sufficiently small the first one is negative, and the second solution is larger than , hence both are irrelevant. Also, and thus on all of . Together with (D.14), it follows that on . Hence for all which proves that solves the HJB equation (B.26).
Using the proof of Proposition B.6, one can obtain assertion (ii) and (iii). Finally, the expansions of the trading boundaries claimed in (iv) follow from the asymptotic expansions of the free boundaries in (D.11).
∎
Appendix E Convergence
Lemma E.1.
Let . There exists such that for all and for all , the objective functional for a trading strategy which only engages in buying at and selling at outperforms a buy and hold strategy. More precisely, for all and for all
Proof.
As and , there exists such that for all and .
Let , where is the stationary density of a reflected diffusion on (Lemma B.5). As , also holds for all . Thus,
| (E.1) |
where Lemma C.3 has been invoked to calculate and estimate the average trading costs . The asymptotic expansion holds for sufficiently small and , as , the exponent in the asymptotic formula (E) satisfies . ∎
E.1. Proof of Theorem 4.1
Proof.
As , the curves range in a relatively compact set, namely . Consider therefore a sequence , which satisfies . Set , for , and note that . For each , , by assumption the HJB equation (B.26) is satisfied with . The verification arguments in the proof of Proposition B.6 yield that the trading strategies associated with the intervals are optimal.
Next, three facts are proved. First , which is equivalent to . Suppose, by contradiction, that . Then and thus , as . Hence, the objective functional eventually minorizes the uniform bound provided by Lemma E.1, a mere impossibility to optimality. Hence . Second, : This holds due to the fact that, by observing limits for the initial and terminal conditions of zero order in (3.1), . Third, . Suppose, by contradiction, that . Then , as , and, as , the average trading costs corresponding to satisfy (by Lemma C.3)
as . Denote by the trading strategy which only buys (resp. sells) ath (resp. ). By the results of Appendix C the value function satisfies
as . In particular, for sufficiently large , a buy-and-hold strategy satisfies , which contradicts optimality of the trading strategy . Hence .
As the sequence converges, by (Keller-Ressel et al., 2010, Lemma 9) the solutions of the initial value problem associated with (3.1) and , namely , converge to the solution of the initial value problem (3.1) (for ),
The terminal conditions are met by , because is continuous on . Also, for each , , by assumption the HJB equation (B.26) is satisfied. Non-negativity is preserved by taking limits, hence, satisfies the HJB equation as well. The verification arguments in the proof of Proposition B.6 imply that the trading strategies associated with the intervals are not only optimal for risk-aversion levels , but also is optimal for a risk-neutral investor.
can have only one accumulation point for , because is the value function. Uniqueness of is therefore clear and it follows that . By assumption, the free boundary problem has a unique solution, hence it follows that . In particular, the curves each have a unique limit as , which equals , the solution of the free boundary problem. ∎
References
- (1)
- Asness et al. (2012) Asness, C., Frazzini, A. and Pedersen, L. H. (2012), ‘Leverage aversion and risk parity’, Financial Analysts Journal 68(1), 47–59.
- Borodin and Salminen (2002) Borodin, A. N. and Salminen, P. (2002), Handbook of Brownian motion: facts and formulae, Springer.
- Constantinides (1986) Constantinides, G. (1986), ‘Capital market equilibrium with transaction costs’, J. Polit. Economy 94(4), 842–862.
- Davis and Norman (1990) Davis, M. H. A. and Norman, A. R. (1990), ‘Portfolio selection with transaction costs’, Math. Oper. Res. 15(4), 676–713.
- Davis and Varaiya (1973) Davis, M. and Varaiya, P. (1973), ‘Dynamic programming conditions for partially observable stochastic systems’, SIAM Journal on Control 11(2), 226–261.
- Dumas and Luciano (1991) Dumas, B. and Luciano, E. (1991), ‘An exact solution to a dynamic portfolio choice problem under transactions costs’, J. Finance 46(2), 577–595.
- Edwards (1999) Edwards, F. R. (1999), ‘Hedge funds and the collapse of long-term capital management’, The Journal of Economic Perspectives 13(2), 189–210.
- Frazzini and Pedersen (2012) Frazzini, A. and Pedersen, L. H. (2012), Embedded leverage, Technical report, National Bureau of Economic Research.
- Frazzini and Pedersen (2014) Frazzini, A. and Pedersen, L. H. (2014), ‘Betting against beta’, Journal of Financial Economics 111(1), 1–25.
- Gerhold et al. (2014) Gerhold, S., Guasoni, P., Muhle-Karbe, J. and Schachermayer, W. (2014), ‘Transaction costs, trading volume, and the liquidity premium’, Finance Stoch. 18(1), 1–37.
- Gunning and Rossi (2009) Gunning, R. C. and Rossi, H. (2009), Analytic functions of several complex variables, Vol. 368, American Mathematical Soc.
- Kallsen and Muhle-Karbe (2015) Kallsen, J. and Muhle-Karbe, J. (2015), ‘The general structure of optimal investment and consumption with small transaction costs’, Mathematical Finance, Wiley Online Library .
- Keller-Ressel et al. (2010) Keller-Ressel, M., Mayerhofer, E. and Smirnov, A. G. (2010), ‘On convexity of solutions of ordinary differential equations’, Journal of Mathematical Analysis and Applications 368(1), 247–253.
- Kruk et al. (2007) Kruk, L., Lehoczky, J., Ramanan, K. and Shreve, S. (2007), ‘An explicit formula for the Skorokhod map on [0, a]’, The Annals of Probability pp. 1740–1768.
- Magill and Constantinides (1976) Magill, M. J. P. and Constantinides, G. M. (1976), ‘Portfolio selection with transactions costs’, J. Econom. Theory 13(2), 245–263.
- Rogers (2004) Rogers, L. C. G. (2004), Why is the effect of proportional transaction costs ?, in ‘Mathematics of Finance’, Vol. 351 of Contemp. Math., Amer. Math. Soc., Providence, RI, pp. 303–308.
- Sharpe (2011) Sharpe, W. F. (2011), Investors and markets: portfolio choices, asset prices, and investment advice, Princeton University Press.
- Shreve and Soner (1994) Shreve, S. E. and Soner, H. M. (1994), ‘Optimal investment and consumption with transaction costs’, Ann. Appl. Probab. 4(3), 609–692.
- Taksar et al. (1988) Taksar, M., Klass, M. J. and Assaf, D. (1988), ‘A diffusion model for optimal portfolio selection in the presence of brokerage fees’, Math. Oper. Res. 13(2), 277–294.