Magnesium-rich Ejecta in the SNR G284.31.8 Around the High-Mass Gamma-Ray Binary 1FGL J1018.65856
Abstract
We present results from two Chandra observations of the 16.6 d X-ray/-ray high-mass binary 1FGL J1018.65856 located at the center of the supernova remnant G284.31.8. The binary spectra, separated by 0.25 in binary phase, are fit with an absorbed power-law model with for both observations (the flux during the second observation is a factor of 1.7 smaller). In the high-resolution ACIS-I image we found a hint of extended emission – southeast of the binary, significant at the level. Binary evolution codes reproduce the system’s observed properties with two massive stars with an initial 18-day period, undergoing mass transfer and leaving behind a heavy neutron star. The initial mass of the progenitor star in this scenario is 27 . Chandra and XMM-Newton images of the remnant show it has a relatively low X-ray surface brightness. The two brightest regions of extended X-ray emission, with luminosities erg s-1 for kpc, lie in the northern and western portions and show significantly different spectra. The northern patch is consistent with shocked ISM, with a low temperature and long ionization timescale. However, the western patch is dominated by ejecta, and shows significantly enhanced Mg content relative to other ejecta products. The abundance ratios inferred resemble those from the Large Magellanic Cloud remnant N49B. To our knowledge, this is only the second case of such Mg-rich ejecta found in an SNR. Nucleosynthesis models for core-collapse SNe predict Mg-rich ejecta from very massive progenitors of .
1 Introduction
The ejecta from supernova (SN) explosions enrich the interstellar medium of the Galaxy with heavy elements over thousands of cubic parsecs. Identification of the ejecta products of SNe is most easily done via analysis of the X-ray emission from young to middle-aged supernova remnants (SNRs), after the reverse shock has propagated back into the ejecta and heated it to X-ray emitting temperatures. One of the biggest open questions in SN research is what types of stellar progenitor systems lead to what types of SNe and SNRs. In only a handful of cases have astronomers directly observed the pre-SN star in archival images, and this situation is unlikely to change in the near future. The fundamental problem is that SNe are plentiful but distant and point-like, while SNRs are local and resolvable but limited in number.
SNR G284.31.8 (also known as MSH 10-53; hereafter G284) has been identified through radio (Milne et al., 1989), optical (Ruiz & May, 1986), and X-ray (Abramowski et al., 2012) observations, and is perhaps years old (Ruiz & May, 1986) with a distance of 5.4 kpc (Napoli et al., 2011). It is interacting with a molecular cloud in the north. An analysis of the extended X-ray emission seen in G284 was first reported by Abramowski et al. (2012), who noted that X-ray emission was present in the northern portion of the remnant, just behind a filament identifiable in the radio and optical images.
At the center of the remnant lies the bright X-ray point source 1FGL J1018.65856 (hereafter J1018). Identified as a high-mass binary by Corbet et al. (2011), J1018 reveals a 16.6 d periodic modulation in the Fermi LAT observations (Ackermann et al., 2012). This is one of the few binaries seen in -rays (Kargaltsev et al., 2014). Pavlov et al. (2011) reported results from the first Chandra and XMM-Newton observations of J1018 around binary phases and , respectively (zero phase corresponds to the maximum of the GeV flux, MJD ), and also found the high-mass companion in 2MASS data. Suzaku (Tanaka et al., 2014) and Swift (An et al., 2013, 2015) observed J1018 covering the entire orbital period, confirming the periodicity seen in -rays. The most recent period measurement, d, was provided by An et al. (2015), who found a large X-ray flux increase at and an additional maximum at . J1018 exhibits a correlation between X-ray flux and photon index, common to several -ray binaries.
J1018 is one of two high-mass -ray binaries seen inside of an SNR (along with SS 433 in W50), offering a rare opportunity to study the remains of the explosion that would produce such a system. The spectral type of the companion star places tighter constraints on the exploded star than would otherwise be possible. Ground-based observations revealed a massive star of spectral type O6V((f)) (; Napoli et al. 2011) and mass of , very similar to that of the -ray binary LS 5039. J1018 was observed with the H.E.S.S. observatory by Abramowski et al. (2015), who report a detection of the source HESS J1018589A (spatially coincident with J1018). The detected -ray variability, both in GeV and TeV, confirms the association between the H.E.S.S. source and J1018. Abramowski et al. (2015), based on the shape of the TeV phaseogram and source spectrum, suggest that J1018 is a low-inclination, low-eccentricity system.
In this Letter, we report our analysis of the X-ray emission from J1018 and G284. We use newly-obtained Chandra data, supplemented with archival XMM-Newton data, to examine the extended X-ray emission from the SNR and do spectral and spatial analysis of the binary.
2 Observations and Data Reduction
We use two sets of Chandra observations (Table 1), totaling 72 ks, taken with the ACIS-I instrument in timed exposure mode and telemetered in “very faint” format. We processed the data using the Chandra Interactive Analysis of Observations (CIAO111http://cxc.harvard.edu/ciao/index.html) software (ver. 4.6) and Chandra Calibration Data Base (CALDB), ver. 4.6.3. Spectra were analyzed using XSPEC (ver. 12.8.2), which contains the latest atomic data from AtomDB 3.0.
We simulate the Chandra PSF using ChaRT222http://cxc.harvard.edu/chart/ (Chandra Ray Trace) to study the morphology of the emission in the immediate vicinity of J1018. The ChaRT output was supplied to MARX v.5.1333http://space.mit.edu/CXC/marx/ software to obtain the final image. We used a blurring (AspectBlur parameter in MARX) value of , as recommended by the Chandra Help Desk.
| ObsId | Date | aaOrbital phase of the middle of the observational interval. Zero phase corresponds to the -ray peak, MJD ; the binary period is d (An et al., 2015) | ExpbbExposure in units of ks, and the corresponding phase interval (in parentheses). |
|---|---|---|---|
| 14657 | 2013-12-24 | 44.40(0.031) | |
| 16560 | 2013-12-29 | 27.68(0.019) |
.
For our analysis of the G284 emission, discussed below in Section 3.2, we supplement our Chandra observations with archival XMM-Newton observations to increase the signal-to-noise ratio. G284 was observed by XMM-Newton on 2013 Jan 9 for a total of 105 ks (ObsID 0694390101; PI: De Luca). EPIC-MOS observations were taken in Full Frame mode with a medium filter, while EPIC-pn data were taken in Small Window mode with a thin filter. The pn data captures only emission from the binary (analyzed by An et al. 2015), not the extended emission. We processed the MOS data with XMM Science Analysis Software (SAS) ver. 13.5. To filter the data for flares, we used the mos-filter routine as part of the ESAS software, available within SAS. After time filtering, approximately 79 and 91 ks of “good” data remained for the MOS 1 and 2 detectors, respectively.
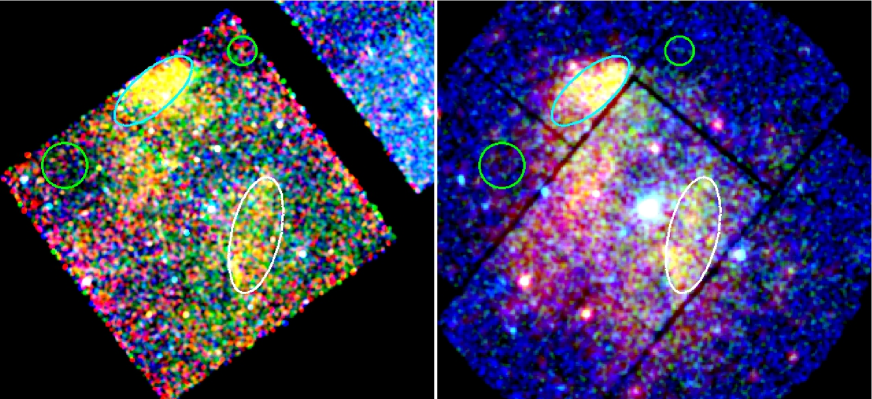
Guided by the Chandra images, we selected two regions of extended emission to analyze, labeled “north” and “west.” Both are shown in Figure 2. These regions have areas of and arcmin2, respectively. Background subtraction for these two regions is difficult due to the large size of the remnant compared with the Chandra field of view. However, based on a comparison of the Chandra and XMM images, we found off-source regions that appear on both the ACIS-I and MOS arrays and do not appear to have any associated emission from the SNR.
3 Results & Discussion
3.1 1FGL J1018.65856
3.1.1 Spectral and Imaging Analysis
We extracted spectra for J1018 from the two Chandra observations. The spectra suffer from moderate pile-up (3,294 and 1,498 counts in the aperture correspond to 0.24 and 0.17 counts per frame in ObsID 14657 and 16560, respectively). To correct for pile-up, we used the Davis (2001) model with the grade migration parameter . Fits with an absorbed power-law model (with the XSPEC phabs model) give hydrogen column densities and ( cm-2; photon indices and ; absorbed (unabsorbed) fluxes () and erg s-1 cm-2; and reduced and 0.75 for ObsIDs 14657 and 16560, respectively. All uncertainties are . The derived and do not change significantly between the individual fits. The flux in the second observation is a factor of 1.7 smaller than the first one, in accordance with the orbital phase dependance of the flux.
Comparing our fit for the first Chandra observation with the An et al. (2015) fit for the XMM-Newton observation taken at a close binary phase (, ), we find that our is somewhat larger and the slope is somewhat steeper, but the values are consistent at the level. Because of the lack of pile-up, the XMM-Newton measurements are probably more accurate.
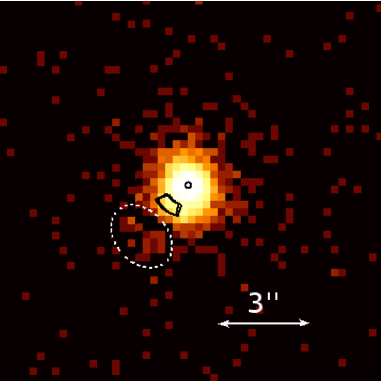
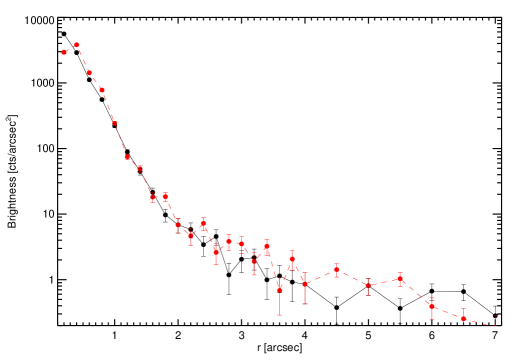
We also investigate the spatial morphology of J1018 in the ACIS-I images and compare the surface brightness radial profile with a modeled PSF444We used MARX 5.1 with and pile-up parameter . (Figure 1). Overall, the observed profile matches the simulated PSF. There appears to be a mismatch between the simulated profile and the observed profile at , but this is likely due to an inacurate pile-up modeling in MARX555http://space.mit.edu/ASC/MARX/indetail/pileup.html. In addition, the PSF model is not very reliable at small distances due to the presence of the asymmetric PSF anomaly666http://cxc.harvard.edu/proposer/POG/html/chap4.html around , which is not simulated by MARX. Including the pile-up correction in the MARX 5.1 simulation does not change the profile substantially beyond , which is expected for moderate pileup.
Analyzing the high-resolution images of J1018, we found an enhancement (24 photons in 0.5–8 keV within the ellipse shown in Figure 1, for the merged image) located away from the best-fit centroid of the source at a position angle (PA) of (counted East of North). The enhancement, visible in both observations, has significance estimated from comparison with the background (which includes PSF wings) measured in the annulus for the merged image. The expected enhancement due to the known mirror artifact777http://cxc.harvard.edu/ciao/caveats/psf_artifact.html has a very similar PA, but is located significantly closer to the source center () and is unlikely the cause of the enhancement. Its appearance is similar to the fast-moving extended feature we recently discovered in the vicinity of B1259–63 -ray binary (Pavlov et al. 2015). Deeper followup Chandra observations are needed to study this extended emission and its tentative connection to J1018.
3.1.2 Modeling of Binary Evolution
Although the optical counterpart of J1018 has been found and the binary nature of this system is firmly established, it remains unknown whether the compact object is a neutron star (NS) or a black hole (BH). We use the known binary properties (orbital period and mass of the donor star) to place constraints on the compact object. While there is still some uncertainty about the exact range of masses of progenitors that end their lives as NSs and those that become BHs, most models predict that, for solar or lower metallicities, the transition between NSs and BHs occurs for stars with initial masses somewhere in the range of M⊙ (e.g., Fryer 1999; Heger et al. 2003). For metallicities much larger than solar, stellar evolution models predict that massive stars develop substantial winds, which cause enough mass loss that the end product is a NS rather than a BH (Heger et al., 2003). For our simulation we assume solar metallicity as the system is in the Galactic disk. We first use the single star evolution (SSE) code (Hurley et al., 2000) to study the evolution of stars with solar metallicity. We find that stars with initial mass of 20 M⊙ and higher would end up as BHs, in agreement with the above. If J1018 started and evolved as a detached system (no mass transfer ever happens), the progenitor star must have burned its hydrogen faster than the star and hence it should have been even more massive. Therefore, in this scenario the compact object should be a BH. However, the lack of mass transfer would require a much larger than the currently observed ( d) initial orbital period, which could only increase (since the binary is assumed wide and there is no interaction to cause spiraling in) after the progenitor explodes as supernova. Thus we conclude that the system must have started as a tight binary and undergone mass transfer.
However, evolution of massive stars in tight binaries is more complicated because mass transfer can proceed from one star to the other, rendering the SSE code inapplicable. Therefore, we used binary stellar evolution (BSE) models (Hurley et al., 2002). We ran a grid of 80,000 simulations with the following parameters: M⊙ (current donor star), M⊙ (SN/compact object progenitor with initial mass always greater than M1), binary period d, eccentricity . We find 115 systems that end up with d, and M⊙ right after the SN explosion of star 2. A large fraction of these simulated binaries are disrupted immediately after the SN, but we are not interested in such systems. Our findings show that in order to reproduce the observed binary parameters we need the following initial conditions: M⊙, M⊙, d. The simulations resulted in a heavy () NS as the compact object in 95% of the cases, while the O6V donor star gained mass (from M⊙ to 31 M⊙) via mass transfer. Note that the systems that match the above criteria have high eccentricity (), while Abramowski et al. (2015) claim (based on the TeV observations) that the eccentricity of J1018 should be closer to 0.
3.2 SNR G284.31.8
The northern region analyzed in Abramowski et al. (2012) roughly corresponds to our “north” region. We extend their analysis, supplementing it with additional Chandra and deeper XMM-Newton data (their analysis used a 20 ks XMM observation), while expanding the analysis to our “west” region as well. While we do not show it here, we have also found that the northern filament, identifiable in radio, H, and X-rays, is present in the WISE 22 m IR data. IR emission from the forward shock in SNRs is common, even in more evolved SNRs (Sankrit et al., 2014), and generally results from dust heated in the post-shock environment.
We extracted spectra from the north region using only the MOS 2 and Chandra observations, since this region falls on one of the dead MOS 1 chips. For the west region, data from MOS 1, MOS 2, and Chandra are used. After background subtraction, slight residuals remained in the MOS 1 & 2 spectra from instrumental lines of Al and Si K at 1.49 and 1.75 keV, respectively. We excised small regions around both of these lines (1.45-1.53 keV and 1.71-1.79 keV) from the MOS 1 & 2 spectra, but kept those excised regions in the Chandra spectra. For each region, we perform joint fits to all available data, with all parameters tied together. The column density, is taken from the fits to the X-ray spectrum of the point source, and is frozen in the fits to 8 cm-2, the same value as Abramowski et al. (2012) used. We binned the data to a minimum of 50 counts per spectral bin for all SNR datasets.
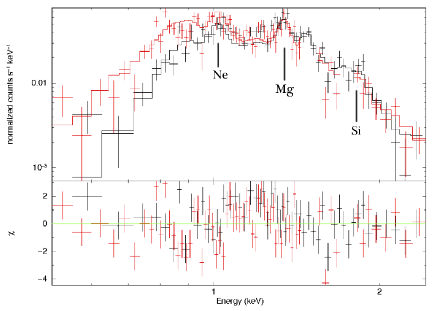
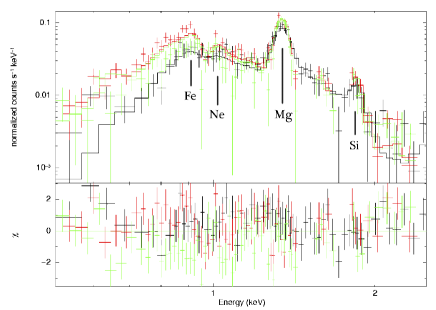
We show the spectra from the north and west regions in Figure 3. We fit these spectra with an absorbed plane shock model with variable abundances (phabs*vpshock), assuming cosmic abundances from Wilms et al. (2002). The temperature and ionization timescale ( ) were allowed to float freely, as were abundances of Ne, Mg, and Fe. Si was free as well, but was tied together with S due to the poor statistics of the S line. We kept O frozen at the solar value for two reasons: with the fairly high absorption towards the remnant, O lines are only barely visible, if present at all, and we wanted the abundances of the other elements to be normalized to some fiducial value (the abundance of O).
For the north region, we find normal cosmic abundances for Ne and Mg, with subsolar abundances for Si (S) and Fe. Subsolar abundances are often seen in the X-ray spectra of middle-aged SNRs such as the Cygnus Loop (Tsunemi et al., 2007). The relatively long ionization timescale and lower temperature leads us to concur with the analysis of Abramowski et al. (2012) that this emission is dominated by shocked ISM. The ionization timescale is fit as cm-3 s, but is unbound on the upper end (lower-bound of 1.9 ). An ionization timescale this long makes the spectrum almost indistinguishable from a plasma in collisional ionization equilibrium, again, not unexpected for the shocked ISM from an older remnant.
The spectra of the west region show an entirely different emission profile. They are relatively well-fit (reduced of 1.4 for 184 d.o.f.) by the same absorbed plane-shock model with variable abundances with the parameters shown in Table 2. Immediately obvious is the strong Mg line at 1.35 keV. Ne and Fe are both consistent within errors with solar abundances, while Si (and S) may be slightly overabundant. However, the overabundance of Mg is about a factor of 4.5 higher with respect to O. This overabundance, combined with the higher temperature ( keV) and much lower ionization timescale ( cm-3 s) implies that the emission in this region is dominated by Mg-rich ejecta, heated by the reverse shock. This conclusion is not sensitive to the choice of model; a regular NEI model with variable abundances (model vnei in XSpec) returns similar values.
The spectral fits for this region are similar to those reported in Park et al. (2003) for the LMC remnant N49B. Their analysis is similar to ours, albeit with LMC abundances, different from those in the Galaxy. They find an enrichment of Mg and Si (though their Si abundance is higher than ours), while Ne and Fe are not enhanced. They measure a Mg/O ratio of 4.2 from a small portion in the interior of N49B, within errors of our measurement of 4.5 in G284. As pointed out by Park et al. (2003), the high Mg/O ratio is surprising, as nucleosynthetic models predict that significant quantities of Mg produced in core-collapse SNe should be accompanied by significant quantities of O (Thielemann et al., 1996). While examples of significant O without Mg are plentiful, it is unexpected to find significant Mg without O.
As Park et al. (2003) show, deriving a total mass of Mg ejected by the SN from X-ray spectral analysis is very difficult, with estimates varying by more than an order of magnitude depending on the assumptions made. Such an estimate is beyond the scope of this work. Nonetheless, the high Mg abundances in the ejecta suggest a substantial amount was synthesized in the explosion. In the nucleosynthesis models of Thielemann et al. (1996), significant amounts of Mg are only produced in massive progenitors of .
4 Conclusions
While the northern region of G284 is dominated by shocked ISM, we have shown that the ejecta-dominated western region is significantly overabundant in Mg. Along with N49B in the LMC, this makes only the second known remnant with Mg-rich ejecta. Models of nucleosynthesis in CCSN progenitors produce significant amounts of Mg relative to other products, like Si and Fe, only in the explosions of massive stars ().
We find no statistically significant extended emission in the radial profile for from the binary J1018 at the center of G284, though we do see a slight excess of photons a few arcseconds southeast of the source. The spectral parameters of J1018 are about the same in the two observations shifted by 0.25 in binary phase, but the flux difference is significant, –. Our binary evolution calculations support the idea that the progenitor for this SN had an initial mass of 25 . Mass transfer prior to the explosion from the progenitor to the current donor star increased that star’s mass to . Our simulations imply that the compact object in the binary is a heavy, , NS.
With its large size and low surface brightness, G284 would benefit from a deep study with an X-ray telescope with both large effective area and field of view. A long observation with the pn instrument on XMM-Newton in Full Frame mode or the Soft X-ray Imager (SXI) on the upcoming Astro-H satellite would be ideal for the purpose of further study on the fainter sections of the ejecta.
| Region | (keV) | Ne | Mg | Si (S) | Fe | (cm-3 s) | Norm. | Flux | (d.o.f.) |
|---|---|---|---|---|---|---|---|---|---|
| North | 0.67 | 1.19 | 1.06 | 0.19 | 0.24 | 4.6 | 9.6 | 3.1 | 1.96 (112) |
| West | 0.92 | 1.30 | 4.53 | 1.50 | 0.97 | 1.0 | 1.6 | 2.5 | 1.40 (184) |
Note. — Fits to the two regions of G284 shown in Figure 2. Fits were performed using XSPEC with a phabs*vpshock model. Abundances are relative to solar. Subscripts and supercripts are lower and upper bounds, respectively, at the 90% confidence level. Flux in units of 10-13 erg s-1 cm-2 over range keV.
References
- Abramowski et al. (2012) Abramowski, A., et al. 2012, A&A, 541, A5
- Abramowski et al. (2015) H. E. S. S. Collaboration: Abramowski, A., et al. 2015, arXiv:1503.02711
- Ackermann et al. (2012) Fermi LAT Collaboration, Ackermann, M., Ajello, M., et al. 2012, Science, 335, 189
- An et al. (2013) An, H., Dufour, F., Kaspi, V. M., & Harrison, F. A. 2013, ApJ, 775, 135
- An et al. (2015) An, H., Bellm, E., Bhalerao, V., et al. 2015, arXiv:1505.02096
- Buccheri et al. (1983) Buccheri, R., Bennett, K., Bignami, G. F., et al. 1983, A&A, 128, 245
- Chernyakova et al. (2006) Chernyakova, M., Neronov, A., Lutovinov, A., Rodriguez, J., & Johnston, S. 2006, MNRAS, 367, 1201
- Coe et al. (2012) The Fermi LAT Collaboration, Coe, M. J., Di Mille, F., et al. 2012, arXiv:1202.3164
- Corbet et al. (2011) Corbet, R. H. D., Cheung, C. C., Kerr, M., et al. 2011, The Astronomer’s Telegram, 3221
- Davis (2001) Davis, J. E. 2001, ApJ, 562, 575
- Fryer (1999) Fryer, C. L. 1999, ApJ, 522, 413
- Groth (1975) Groth, E. J. 1975, ApJS, 29, 285
- Heger et al. (2003) Heger, A., Fryer, C.L., Woosley, S.E., Langer, N., & Hartmann, D.H. 2003, ApJ, 591, 288
- Hurley et al. (2000) Hurley, J. R., Pols, O. R., & Tout, C. A. 2000, MNRAS, 315, 543
- Hurley et al. (2002) Hurley, J. R., Tout, C. A., & Pols, O. R. 2002, MNRAS, 329, 897
- Kargaltsev et al. (2014) Kargaltsev, O., Rangelov, B., Hare, J., & Pavlov, G. G. 2014, Astronomische Nachrichten, 335, 301
- Milne et al. (1989) Milne, D.K., Caswell, J.L., Kesteven, M.J., Haynes, R.F., & Roger, R.S. 1989, PASA, 8, 187
- Napoli et al. (2011) Napoli, V. J., McSwain, M. V., Boyer, A. N. M., & Roettenbacher, R. M. 2011, PASP, 123, 1262
- Park et al. (2003) Park, S., Hughes, J.P., Slane, P.O., Burrows, D.N., Warren, J.S., Garmire, G.P., & Nousek, J.A. 2003, ApJL, 592, 41
- Pavlov et al. (1999) Pavlov, G. G., Zavlin, V. E., & Trümper, J. 1999, ApJ, 511, L45
- Pavlov et al. (2011) Pavlov, G. G., Misanovic, Z., Kargaltsev, O., & Garmire, G. P. 2011, The Astronomer’s Telegram, 3228
- Pavlov et al. (2015) Pavlov, G. G., Hare, J., Kargaltsev, O., Rangelov, B., & Durant, M. 2015, ApJ, in press
- Rea et al. (2010) Rea, N., Torres, D. F., van der Klis, M., et al. 2010, MNRAS, 405, 2206
- Ruiz & May (1986) Ruiz, M.T., & May, J. 1986, ApJ, 309, 667
- Sankrit et al. (2014) Sankrit, R., et al. 2014, ApJ, 787, 3
- Tanaka et al. (2014) Tanaka, T., Odaka, H., Enoto, T., & Nakashima, S. 2014, Suzaku-MAXI 2014: Expanding the Frontiers of the X-ray Universe, 244
- Thielemann et al. (1996) Thielemann, F.-K., Nomoto, K., & Hashimoto, M.-A. 1996, ApJ, 460, 408
- Tsunemi et al. (2007) Tsunemi, H., Katsuda, S., Nemes, N., & Miller, E.D. 2007, ApJ, 671, 1717
- Wilms et al. (2002) Wilms, J., Allen, A., & McCray, R. 2000, ApJ, 542, 914