Massive relic galaxies challenge the co-evolution of super-massive black holes and their host galaxies
Abstract
We study a sample of eight massive galaxies that are extreme outliers (3 - 5) in the M∙ - Mbulge local scaling relation. Two of these galaxies are confirmed to host extremely large super massive black holes (SMBHs), whereas the virial mass estimates for the other six are also consistent with having abnormally large SMBHs. From the analysis of their star formation histories and their structural properties we find that all these extreme outliers can be considered as relic galaxies from the early (z2) Universe: i.e. they are compact (Re2 kpc) and have purely old stellar populations (t10 Gyr). In order to explain the nature of such deviations from the local relations, we propose a scenario in which the hosts of these über-massive SMBHs are galaxies that have followed a different evolutionary path than the two-phase growth channel assumed for massive galaxies. Once the SMBH and the core of the galaxy are formed at z 2, the galaxy skips the second phase, remaining structurally untouched and without further mass and size increase. We show that if the outliers had followed the normal evolutionary path by growing in size via merger activity, the expected (mild) growth in mass would place them closer to the observed local relations. Our results suggest that the SMBH growth epoch for the most massive galaxies stopped 10 Gyr ago.
Subject headings:
galaxies: evolution – galaxies: formation – galaxies: stellar content – galaxies: nuclei – black hole physics: accretion1. Introduction
It is now well established that the masses of super massive black holes (SMBHs; M 106M⊙) strongly correlate with some of their host galaxies properties, such as their luminosities (e.g. Kormendy & Richstone 1995; Gültekin et al. 2009; Schulze & Gebhardt 2011; McConnell & Ma 2013; Kormendy & Ho 2013), their masses (e.g Magorrian et al. 1998; Häring & Rix 2004; Beifiori et al. 2012), or their velocity dispersions (; e.g. Ferrarese & Merritt 2000; Gebhardt et al. 2000; Gültekin et al. 2009; Graham et al. 2011). This supports the idea that the host galaxies and their SMBHs form and grow in a coordinated way by a common physical mechanism, which could be AGN feedback, mergers or secular evolution (e.g. Fabian 1999; Hopkins et al. 2006; Somerville et al. 2008; Menci et al. 2008; Jahnke & Macciò 2011). The correlation between SMBH mass and velocity dispersion is extremely tight, following a log-normal distribution whose steepness increases as the galaxy sample is enlarged and more accurate measurements of the SMBHs masses are used (see e.g. the most recent compilations of McConnell & Ma 2013 or Kormendy & Ho 2013). This correlation implies that the most massive galaxies ( 300 - 400 ) should have SMBHs with M 1010M⊙, which in turn corresponds to high stellar masses (M 1012 M⊙) and high luminosities (L 1011 L⊙).
However, in the last few years an increasing number of galaxies have been reported to strongly deviate from the above scaling relations. These galaxies show larger SMBHs than what it is expected according to their velocity dispersions or bulge masses. This is the case of e.g. the deeply analyzed NGC1277 (van den Bosch et al. 2012; Emsellem 2013; Fabian et al. 2013; Yıldırım et al. 2015 subm.), NGC4291 and NGC4342 (Bogdán et al., 2012), NGC1332 (Rusli et al., 2011) and SDSS J151741.75-004217.6 (alias b19, Läsker et al., 2013). All these extreme outliers lie far beyond the intrinsic scatter of the relations, challenging the supposed co-evolution between SMBHs and their host galaxy (3). The Hobby-Eberly Telescope Massive Galaxy Survey (hetmgs; van den Bosch et al. 2012, 2015) is a new large galaxy compilation aimed at searching nearby galaxies in which black hole masses can be directly measured. As a by-product, they confirmed the existence of two other enormous SMBHs in NGC1271 (Walsh et al., 2015 subm.) and MRK1216 (Yıldırım et al., 2015 subm.) and there are few dozens more candidates in their sample. Following Läsker et al. (2013) notation, these type of extreme SMBHs have been named über-massive SMBHs (ÜMBHs), although some critics have emerged pointing out to an overestimation of the real mass. This overestimation could be due to the methodology employed (e.g. long-slit spectroscopy instead of integral-field to derive proper dynamical models; e.g Emsellem 2013; Yıldırım et al. 2015 subm.) or to variations in the initial mass function (which would vary the measured stellar mass of the host galaxy; e.g. Emsellem 2013; Läsker et al. 2013). Nonetheless, even accounting for these uncertainties, the galaxies hosting ÜMBHs are still extreme outliers of the scaling relations. Consequently, it is worth addressing what are the physical processes that cause these objects to be outliers. One possibility is that they are galaxies that did form the corresponding stellar mass but then lost it by e.g. tidal stripping. However, the recent work from Bogdán et al. (2012), who studied two outliers in the low-mass regime, claimed that if that was the case, then the dark matter halo surrounding the galaxy should also had been stripped. Their results, instead, showed that both galaxies reside in extended dark matter haloes.
In this paper we propose and probe an alternative scenario. We hypothesize that galaxies hosting ÜMBHs form them in an early phase of the galaxy evolution (z2) and once the SMBHs are formed, the galaxies remain structurally untouched, which prevents them to reach the present-day scaling relations, leaving them as outliers. This early formation is supported by the evolution of the M∙ - Mbulge scaling relation at high redshift (e.g. Walter et al. 2004; Jahnke et al. 2009; Greene, Peng & Ludwig 2010, Petri, Ferrara & Salvaterra 2012). Therefore, in our scenario, massive galaxies hosting ÜMBHs are outliers in the black hole mass scaling relations because they did not follow the expected two-phase growth channel, where merger accretion increases the size (and to less extent, the mass) of the host galaxies after the central massive core is formed (e.g. Naab, Johansson & Ostriker 2009; Oser et al. 2010; Hilz, Naab & Ostriker 2013). Therefore, we would expect the host of ÜMBHs to be galaxies showing the structural properties of the massive galaxy population at z2. In other words, they should be the “relics” of the early Universe, with old (10 Gyr) stellar populations and compact (R2 kpc) sizes, similar to those found at high-z (e.g. Trujillo et al. 2007; Buitrago et al. 2008; Carrasco, Conselice & Trujillo 2010). The existence of a small number of such galaxies without merging accretion since z2 is a natural prediction of the CDM model (i.e. Quilis & Trujillo 2013), but to date only one candidate has been robustly confirmed (Trujillo et al., 2014).
To probe such prediction, we explore the star formation histories (SFHs) for a sample of galaxies with ÜMBHs. If this scenario is realistic, we should be able to pose a lower limit for the age of the SMBH formation, which corresponds to the age of the host galaxy. The layout of this paper is the following. Section 2 describes the data used from the different compilations and our spectroscopic sample. Section 3 analyses the derived SFHs of the sample in order to determine whether a galaxy is a relic candidate or not. Section 4 shows the results and discusses their implications on the theories of the co-evolution (or not) of the SMBHs and the host galaxy. A final summary is presented in Section 5. Throughout this work we adopt a standard cosmological model with the following parameters: =70 km s-1 Mpc-1, =0.3 and =0.7.
2. The data
We first collect the largest possible sample of galaxies with SMBH mass measurements. There are three main recently updated compilations of nearby galaxies: McConnell & Ma (2013, McM13), Kormendy & Ho (2013, KH13) and Graham & Scott (2013, GS13). They are all based on the initial sample of Gültekin et al. (2009), but also contain new galaxies and improved measurements on the SMBH masses, galaxy distances and bulge mass determinations. All McM13 and GS13 galaxies (except for 9 new ones in the latter) are included in KH13. In addition, KH13 presents 13 new galaxies. This literature compilation corresponds to a total of 95 galaxies.
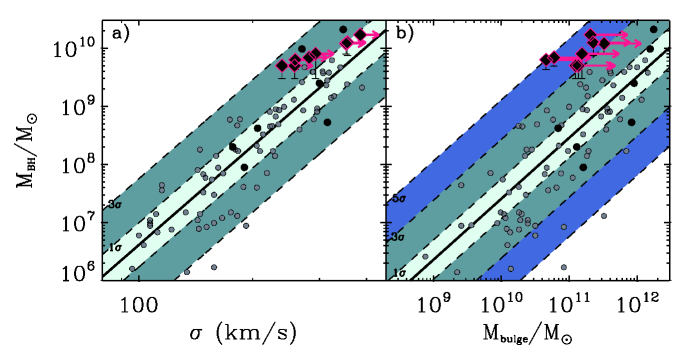
A number of caveats are worth mentioning. First, galaxies found in common among the three compilations (McM13, KH13 and GS13) do not always have the same reported values for some of the properties, as different techniques were employed. Second, galaxies are morphologically classified following different criteria in each compilation. McM13 discriminate between elliptical galaxies and bulges but do not differentiate between classical and pseudobulges, while KH13 make this last separation on the bulges, and GS13 only separate by elliptical and disk galaxies. In addition, the authors of each compilation do not include the same galaxies in their fits: some galaxies excluded in a fit may be included in another one. Consequently, we use here the entire compilation to illustrate the correlations (Figure 1), but we are not deriving new fits for the correlations. In this exercise we use the fits corresponding to McM13 for all the galaxies with dynamical mass estimates, with = 8.32 0.05 and = 5.64 0.32 (for the M∙ - ; Fig. 1a) and = 8.46 0.08 and = 1.05 0.11 (for M∙ - Mbulge; Fig. 1b).
Together with the above compilation, we have expanded our sample using the new compilation of galaxies from the hetmgs survey. This survey was especially designed to find nearby galaxies that were suitable for black hole mass measurements. It is composed of 1022 galaxies, hence is an ideal place where to find galaxies with very large SMBHs, that will be the basis of our analysis for ÜMBH candidates, as explained in the next section.
2.1. Defining the ÜMBH candidates
To identify ÜMBH host candidates, we select galaxies whose SMBHs are significantly larger than what is expected according to the
mass of the bulge of its host galaxy. In other words, we identify those galaxies which strongly deviate from the
M∙ - Mbulge scaling relation. We use the following operative definition to select ÜMBH host candidates: a
ÜMBH host candidate is a galaxy where the mass of its SMBH is located at a distance of 3 above the
M∙ - Mbulge scaling relation given by McM13 (see Fig. 1). With this definition, it is very unlikely that the mass of its SMBH can be explained as simply produced by the uncertainty in the measurement of the
mass of its SMBH. To have a significant number of ÜMBH host candidates, we use the hetmgs sample. In this paper, we are interested in the most massive galaxies, hence we will concentrate our efforts on finding ÜMBH candidates in the upper right corner of the M∙ - Mbulge scaling relation.
From the hetmgs sample we first select those galaxies that are good candidates to host ÜMBHs by imposing
the following criteria:
-
•
To have a large dynamical enclosed mass inside the central aperture of the hetmgs, which indicates a very high central mass concentration (from either stars or a black hole). We use the virial mass estimator M⊙, where is the gravitational constant and the central velocity dispersion. This mass does not discriminate between baryonic mass and black hole mass. And as such, these virial masses are considered upper limits for the black hole masses (see below).
-
•
To be nearby enough so that the putative black hole can be resolved with high spatial resolution facilities; i.e the sphere of influence (being the Hubble flow distance) to be larger then (see van den Bosch et al. 2015).
With the above criteria, the sample of candidates from the hetmgs consists of 173 galaxies. These galaxies
are, as expected, average massive galaxies with sizes of 4 kpc. The vast majority of them do not qualify as ÜMBH host
candidates (i.e. they are not 3 outliers of the M∙ - Mbulge scaling relation). With the 3
criteria, our sample is reduced to 30 ÜMBH candidates. Interestingly, this last criteria changes dramatically the structural properties of the selected galaxies: they have now an average size of 1.5 kpc. In other words, the ÜMBH host candidates are massive compact galaxies. The sizes of the
hetmgs galaxies have been retrieved from the SDSS database as the half-light effective radii in the -band
() and then circularized (Re).
We need to make a last selecting criteria, which is to have pre-existing SDSS111Sloan Digital Sky Survey spectroscopy with
high quality (S/N 20). This is crucial to robustly derive the SFHs of the galaxies with the full-spectral-fitting technique
employed in Section 3. This reduces our sample of ÜMBH candidates to 10 galaxies. Two of them (NGC0426 and NGC2522) were rejected
as their spectra were classified by SDSS as Active Galaxy Nucleus (AGN) broadline. Having an AGN would not only make the
determination of the stellar population properties of the galaxies uncertain but also prevent a proper estimation of the structural
properties of the galaxies. In fact, the presence of a bright nucleus could bias the measurement of the effective radius of the
galaxies towards smaller sizes. In order to avoid this potential source of contamination from our sample, we have ended with a final
sample of 8 ÜMBH candidates.
We use the central enclosed virial mass estimate from the hetmgs as an estimation of the M∙ of the host galaxies. This means that both the black hole masses and their locus in the SMBH-host galaxy planes should be considered as an upper limit. Efforts towards obtaining more accurate estimates using orbit-based dynamical models are underway. For example, the actual black hole mass for NGC1277 has been lowered to 12 M⊙ (Yıldırım et al., 2015 subm.), which is a factor of 1.5 lower than the upper limits. Therefore, if we apply this factor to the rest of the ÜMBH candidates we have a lower, more conservative, estimate of their black hole mass. Nonetheless, in the absence of high-resolution spectroscopy and orbit-based models for our sample of candidates, we will use the upper limit estimates for our analysis. However, it is worth noticing that, even considering the lower estimates, the ÜMBH candidates are still extreme outliers in the local M∙ - Mbulge scaling relation (Fig. 1b; 3 - 5 deviations). It is worth noting that, when placed in the M∙ - scaling relation, our ÜMBH host candidates are not that extreme (Fig. 1a; 1 - 3 deviations). The reason for such differences between the two planes is further discussed in Sect. 4. The details of our complete spectroscopic sample are described in Table 1.
| Galaxy | Spectra | M | M | vel. disp. | Re | deviation | deviation |
|---|---|---|---|---|---|---|---|
| (109 M⊙) | (1011 M⊙) | (km) | (kpc) | Mbulge | vel. disp. | ||
| ÜMBH host candidates from hetmgs | |||||||
| NGC1270 | SDSS | 12 | 3.3 (2.7,1.3) | 353 4 | 1.92 0.03 | (-,1.6) | (-,0.7) |
| NGC1271 | SDSS | 8 | 1.5 (0.8,0.6) | 293 6 | 1.31 0.02 | (-,2.0) | (-,1.9) |
| NGC1277 | SDSS | 17 | 2.1 (1.9,0.7) | 385 4 | 1.64 0.03 | (-,1.4) | (-,0.7) |
| NGC1281 | SDSS | 5 | 1.2 (1.0,0.4) | 258 4 | 1.46 0.03 | (-,0.6) | (-,0.9) |
| NGC2767 | SDSS | 5 | 1.4 (1.1,0.6) | 239 3 | 1.95 0.03 | (-,1.7) | (-,1.3) |
| PGC012557 | SDSS | 7 | 0.6 (0.6,0.3) | 283 4 | 0.71 0.02 | (-,1.0) | (-,0.8) |
| PGC012562 | SDSS | 6 | 0.4 (0.3,0.2) | 259 4 | 0.70 0.02 | (-,1.2) | (-,0.7) |
| PGC032873 | SDSS | 14 | 2.3 (1.2,0.9) | 356 3 | 1.76 0.03 | (-,1.2) | (-,0.8) |
| Control sample from McM13 | |||||||
| NGC3379 | Y06 | 0.4 (0.1,0.1) | 0.7 (0.5,0.3) | 206 10 | 3.3 0.4 | (1.1,1.1) | (0.6,0.8) |
| NGC3842 | SDSS | 9.7 (3.0,2.5) | 16.0 (14.0,7.0) | 270 14 | 14.0 1.3 | (1.1,1.2) | (0.7,0.9) |
| NGC4261 | SDSS | 0.5 (0.1,0.1) | 8.3 (7.0,4.0) | 315 15 | 7.4 0.7 | (1.1,1.1) | (0.5,0.8) |
| NGC4472 | Y06 | 2.5 (0.6,0.1) | 9.0 (7.0,4.0) | 300 15 | 8.2 0.4 | (0.8,1.1) | (0.6,0.7) |
| NGC4473 | Y06 | 0.1 (0.0,0.0) | 1.6 (2.0,0.6) | 190 9 | 4.3 0.3 | (0.9,1.6) | (0.7,1.0) |
| NGC4697 | Y06 | 0.2 (0.0,0.0) | 1.3 (0.7,0.6) | 177 8 | 6.4 0.4 | (1.3,1.5) | (0.8,1.5) |
| NGC4889 | SDSS | 21.0 (16.0,15.5) | 18.0 (14,8) | 347 17 | 12.6 1.4 | (1.6,2.5) | (1.0,2.6) |
Column 1 – Our spectroscopic sample from the compilation of hetmgs (top) and McM13 (bottom). Column 2 – origin of the spectra: SDSS or Y06 (from Yamada et al. 2006). Columns 3 and 4 – the masses of the SMBHs and the masses of the bulge of the galaxy from their dynamical estimates (from hetmgs and McM13). Column 5 – Velocity dispersions (derived with STARLIGHT and from McM13). Column 6 – Circularized effective radii (from the SDSS -band, ATLAS3D and Hyperleda). Columns 7 and 8 – Deviations from the local SMBH mass scaling relations. Note that for the ÜMBH host candidates the black hole masses are an upper limit, thus marked with an .
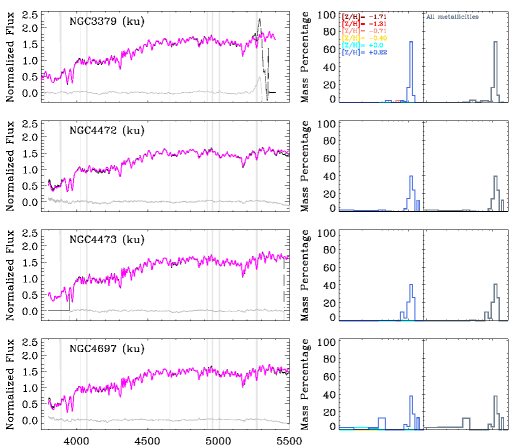
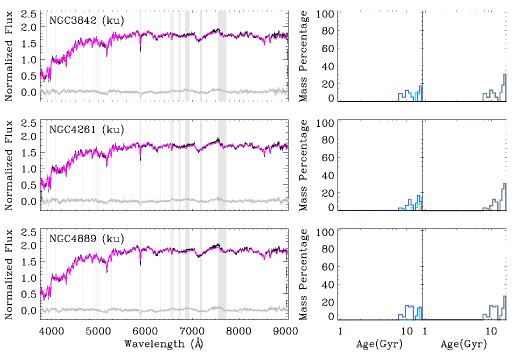
2.2. The control sample
In order to test our scenario, we also explore the ages of the stellar populations of galaxies in a control sample. They were selected from the above (McM13, KH13, GS13) compilations uniquely by the criteria of having a SMBH detection and having high-quality, flux calibrated spectra available. No selection based upon morphology, size or any other parameter was done. Only 3 galaxies out of the 95 have good quality SDSS spectra (NGC3842, NGC4261 and NGC4889). High quality archive spectroscopic data is also included for a few other control galaxies: NGC3379, NGC4472, NGC4473 and NGC4697 (from Yamada et al. 2006, the reader is referred to this publication for a further description of the data). Their black hole masses, velocity dispersions and bulge masses are those quoted in Table A1 from McM13. The circularized sizes have been retrieved from Krajnović et al. (2013) for those galaxies belonging to the ATLAS3D survey (Cappellari et al. 2011; NGC3379, NGC4261, NGC4472, NGC4473 and NGC4697) and from Hyperleda222http://leda.univ-lyon1.fr for NGC3842 and NGC4889. This control sample is thus composed of large ellipticals and S0s mostly from Coma and Virgo clusters. They cover a larger parameter space than our ÜMBH candidates and are typically within the intrinsic scatter of the local relations, showing smaller deviations.
3. Analysis
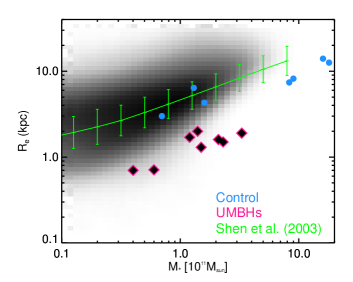
As mentioned before, under the proposed scenario present-day massive galaxies hosting ÜMBHs should have the characteristics of the typical population of galaxies at z2 after passively evolving since that epoch. In other words, they should be massive (M* 1011 M⊙), compact (R2 kpc) and with old stellar populations (10 Gyr). Galaxies that fulfill these criteria in the local Universe are named relic galaxies and are known to be extreme outliers from the local mass-size relation (Trujillo et al., 2009). Therefore, we have quantified the compactness of our galaxies by measuring how much their size deviates from the expected value according to the present-day local size-mass relation of Shen et al. (2003). This well-known relation was derived using a complete sample of 140,000 galaxies from the SDSS. The stellar masses used in that paper were taken from Kauffmann et al. (2003), calculated by multiplying the SDSS Petrosian luminosity with the model-derived mass-to-light ratio. The radii considered were the Sérsic half-light radius in the -band. For galaxies with 2.5, the local mass-size relation is:
| (1) |
where is the mean radius, is the stellar mass, and and are fitting parameters given by a least-squares fit to the data, = 0.56 and = 2.88 10-6. This relation is shown as the solid green line in Figure 2. This figure indicates the location of our spectroscopic sample in the mass-size relation plane. It is clear that our ÜMBH candidates largely deviate from the local relation.
We consider here that a galaxy is compact if the ratio Re/R0.33 (see Table 2). This corresponds to 1/3 of the normal size that massive galaxies show at z = 0 at a given stellar mass. The location in the stellar mass-size plane of our ÜMBH host candidates is equivalent to the locus occupied by the massive compact galaxies at high-z.
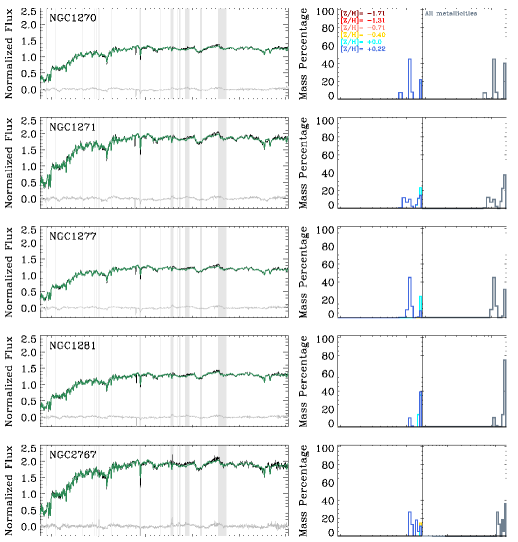
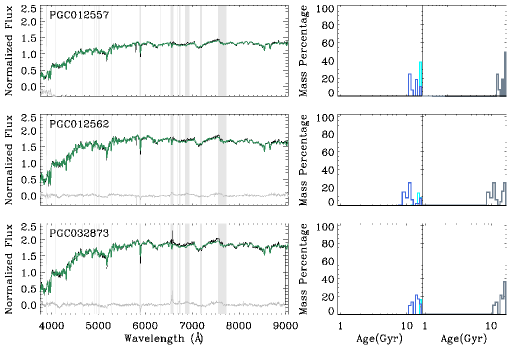
To determine the stellar populations of both the outliers and the control sample we derive the SFHs of our galaxies applying a full-spectral-fitting approach. This technique has several advantages compared to the classical line strength approach. One of them is that the results are not limited to luminosity-weighted estimates but also give the output in terms of mass, allowing to recover the true fossil imprints of the epoch when the stars were created. The code employed here is STARLIGHT (Cid Fernandes et al. 2005; Cid Fernandes & González Delgado 2010), which creates a combination of single stellar populations (SSPs) model predictions that best resemble the observed galaxy spectrum while minimizing the . The reader is referred to the source code papers for a deeper description of the methodology, or to the Appendix for a brief summary of this technique. The SSP models used are MIUSCAT (Vazdekis et al. 2012; Ricciardelli et al. 2012), which cover a wide range of both ages (0.1-17.8 Gyr) and metallicities (-1.71 to 0.22 dex). For this exercise in particular, 46 ages and 4 different metallicites were considered, making a total of 184 SSP templates. These SSP models also allow for variations on the IMF slope and shape. The IMF has been recently reported to be non-universal (e.g. Cappellari et al. 2012; Conroy & van Dokkum 2012; Spiniello et al. 2012; Ferreras et al. 2013; La Barbera et al. 2013) and to have a strong impact in the derived stellar population properties (Ferré-Mateu, Vazdekis & de la Rosa, 2013). However, Martín-Navarro et al. (2015) have shown recently that for the compact massive relic galaxy NGC1277, changing the IMF does no modify the derived age properties. This indicates that it is still unclear which is the parameter that really drives these IMF variations (e.g. velocity dispersion, metallicity, -enhancement). Therefore, here we will focus on the standard assumption of a Kroupa Universal IMF.
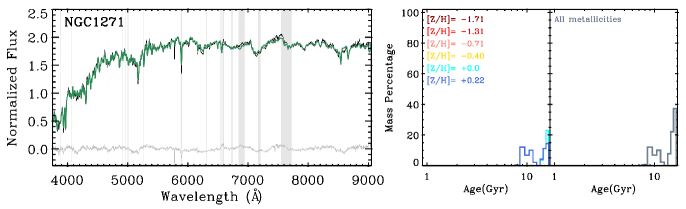
Figure 3 illustrates the derived SFH from the spectral fitting for one of the galaxies (NGC1271). The derived SFHs for the rest of our spectroscopic sample can be found in the Appendix. The right panels in Figure 3 show the derived SFHs as the percentage of mass created at a given age, considering both the contribution of each individual metallicity from the models and of the total metallicity. It is worth emphasizing here an important caveat on the form the derived SFHs are shown. As mentioned by Cid Fernandes et al. (2005), the reader should not take the form of each single burst at face value. This is partly because the SSP models do not cover uniformly the entire age parameter space. For example, there is always a gap at 13 Gyr because there is no SSP model corresponding to that age in the MIUSCAT models. Therefore, the derived SFHs should be better interpreted as clearly differentiated epochs of formation, i.e. young, intermediate and old. These considerations are fundamental for the purpose of our exercise, as one of our criteria to consider a galaxy as a relic of the z2 Universe is that all their stellar populations must be old (10 Gyr). When looking at the age distributions, it can be seen that sometimes there is a small contribution at 8 - 9 Gyr, which can be considered as the tail of the distribution that peaks at 10 Gyr. For this reason, in order to be more quantitative in our statement whether a galaxy has or not entirely old stellar populations, we measure the fraction of mass which is within the interval 8t10 Gyr. We thus consider a galaxy compatible with having all its stellar mass formed at z 2 if there are no stellar populations younger than 8 Gyr and is below 10 of the total mass.
We summarize in Table 2 the quality parameters from the fit and whether the outliers satisfy our criteria to be considered relic galaxies or not. We find that 7 out of the 8 objects undoubtedly qualify as relic galaxies, while only one is dubious. As these compact relic galaxies are also outliers in the present-day mass-size relation (Figure 2), finding these ÜMBH host candidates could constitute a new way of detecting these rather elusive relic galaxies in the nearby Universe (e.g. Trujillo et al. 2009; Taylor et al. 2010; Ferré-Mateu et al. 2012; Trujillo, Carrasco & Ferré-Mateu 2012, Poggianti et al. 2013). Regarding our control sample, none of the galaxies can be considered as massive relic of the high-z Universe because of their large sizes. However, a couple of them are as old as our relic galaxies, indicating that at least the stellar populations of their most central parts were formed at very early epochs too. We would like to emphasize that our criteria based on the value, in order to be fully consistent with the statement that the galaxy is a relic, should be shown to be true along the entire structure of the galaxy. As we are employing SDSS data, the coverage of the fiber is 0.3 - 0.8Re for the compact galaxies and 0.01-0.03Re for the control sample. Consequently, the SDSS data does not allow us to perform such radial study. However, this issue has been assessed for the compact candidates in Trujillo et al. (2014) for NGC1277 and in the companion paper of Ferré-Mateu (2015b, in prep.) for PGC032873. These works both use high-quality spectroscopy from the William Herschel Telescope to the derive SFHs and stellar populations properties out to several effective radii, showing no gradients and supporting our hypothesis of this type of galaxies being relics.
| Galaxy | [] | adev () | R | Gyr) | Relic? | |
| ÜMBH host candidates | ||||||
| NGC1270 | 1.6 | 1.7 | 0.24 | 0 | 7 | ✓ |
| NGC1271 | 1.7 | 1.6 | 0.25 | 0 | 10 | ✓ |
| NGC1277 | 1.9 | 1.5 | 0.26 | 0 | 0 | ✓ |
| NGC1281 | 1.2 | 1.6 | 0.33 | 0 | 0 | ✓ |
| NGC2767 | 0.7 | 1.8 | 0.37 | 0 | 0 | ✓ |
| PGC012557 | 1.3 | 1.7 | 0.22 | 0 | 0 | ✓ |
| PGC012562 | 1.3 | 1.3 | 0.23 | 0 | 14 | |
| PGC032873 | 1.0 | 1.0 | 0.23 | 0 | 0 | ✓ |
| Control | ||||||
| NGC3379 | 0.1 | 1.9 | 0.92 | 5 | 4 | ✗ |
| NGC3842 | 0.8 | 2.0 | 0.73 | 1 | 14 | ✗ |
| NGC4261 | 0.7 | 1.8 | 0.55 | 0 | 5 | ✗ |
| NGC4472 | 1.5 | 1.7 | 0.55 | 7 | 5 | ✗ |
| NGC4473 | 1.1 | 1.3 | 0.83 | 1 | 14 | ✗ |
| NGC4697 | 1.2 | 1.4 | 1.26 | 21 | 7 | ✗ |
| NGC4889 | 0.8 | 1.8 | 0.61 | 0 | 10 | ✗ |
The table summarizes the different criteria by which a galaxy can be considered a relic candidate. Column 2 and 3 are measurements of the quality of the fit from STARLIGHT, (see Appendix). Column 4 measures the compactness of a galaxy, by showing how much the galaxy size deviates from the present-day mass-size relation of Shen et al. (2003) for 2.5 galaxies. Column 5 and Column 6 quote the fraction of stellar populations with Gyr, and the fraction of mass with 8t10 Gyr, . Column 7 states the verdict on whether the galaxy is considered a relic candidate or not.
4. Discussion
The tight correlations that the mass of the SMBHs and their host galaxy properties follow have been considered as a proof of the co-evolution between galactic bulges and the SMBHs they host. According to this paradigm, they should be coupled by a common physical mechanism, e.g. feedback, mergers, secular evolution. However, a small sample of galaxies hosting ÜMBHs now challenge this assumed universal co-evolution as they clearly fail to follow such relations. In this paper we have proposed that the nature of these outliers hosting ÜMBHs is connected to the uncommon evolutionary path followed by these massive galaxies (without growing in mass or size). It is generally assumed from galaxy formation models that massive galaxies form in a two-phase mechanism, where the central massive part of the galaxy is created in a fast and violent event at high-z, and then the galaxy grows by posterior merger activity (e.g. Naab, Johansson & Ostriker 2009; Oser et al. 2010; Hilz, Naab & Ostriker 2013). But because mergers are stochastic events, it is expected that some galaxies remain untouched over cosmic time, remaining compact and entirely old (see Quilis & Trujillo 2013). Therefore, if the ÜMBH-outliers are those relics, as our results suggest, then the nature of the deviations could be explained by the lack of merging activity and its consequent lack of galaxy growth. Under our hypothesis, these galaxies should occupy in the SMBH mass scaling relations the position of the population of galaxies at z2. Consequently, present day most massive galaxies should start at those locations 10 Gyr ago and their growth in mass and size should be able to move them to the current scaling relations. If this is true, the expected mass and increase of the massive galaxies since z2 should be enough to locate our outliers in agreement with the local relations.
We explore this possibility on what follows. The arrows in Figure 1 show the estimated growth in velocity dispersion and stellar mass since z 2 for individual massive galaxies. From semi-analytical models, if an individual galaxy grows 7 times in size, it can increase its mass by almost a factor of 5 (e.g. Oser et al. 2010; Trujillo, Ferreras & de La Rosa 2011). This could account for the missing stellar mass, placing the ÜMBH-outliers closer to the central distribution in the M∙-Mbulge relation. As commented above, our sample is not that extreme when placed in the M∙ - relation, hence no much variation in the velocity dispersion should be expected, if any. This is in agreement with the model predictions (e.g. Cenarro & Trujillo 2009; Oser et al. 2012; Oogi & Habe 2013; Wellons et al. 2015), where the velocity dispersion varies very slightly since z 2. Depending on the dominant merger channel, individual galaxies can increase very mildly their velocity dispersion by a factor of 1.1 (Hilz et al. 2012; Tapia et al. 2015 subm.). It is worth noting that in our scenario, the arrows move horizontally because an increase in the SMBH is expected to be almost negligible during the second phase. It is typically assumed that the amount of mergers that occur since z 2 have a mass ratio of 1:3 to 1:5 (Oser et al. 2010, 2012). Here we assume that the massive galaxies, once formed at z 2, have a much larger SMBH than what they should have from their stellar masses. Then, they merge with smaller satellites, whose mass-size evolution is milder over cosmic time (Trujillo et al., 2004) and therefore are expected to be located already in, or very close to, the local relation having smaller black holes. This type of encounters would produce a negligible increase in the mass of the SMBH, as seen in cosmological simulations of SMBH growth (e.g. Yoo et al. 2007; Wellons et al. 2015; Kulier et al. 2015). Therefore, it is a valid assumption to account for evolution only in the Mbulge and directions for the relic galaxies and neglect the one in the SMBH mass direction. As a final comment, considering the lower black hole estimates would further support our scenario: the ÜMBH candidates would still be extreme outliers in the M∙-Mbulge relation but they would be located even closer to the local scaling relations after accounting for the missing mass.
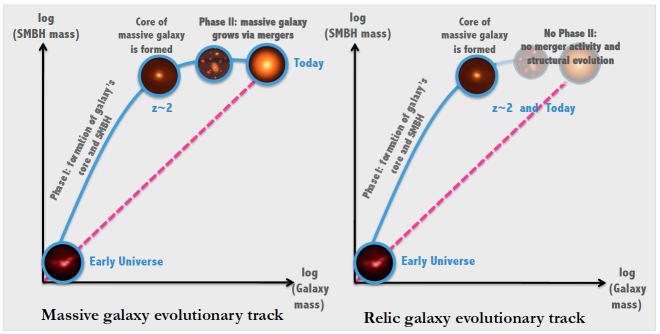
In a nutshell, our scenario is schematically depicted in Figure 4. The left panel shows the normal evolution that a massive galaxy follows over cosmic time to become a large elliptical galaxy today, with the two-phase of formation (Oser et al., 2010). The right panel illustrates the expected evolutionary track for the relic/outlier galaxies. We remind the reader that this is a cartoon to illustrate the proposed scenario, where a number of assumptions have been here simplified, as many questions in the (co-)evolution of SMBHs and their host galaxies remain unsolved. For example, the exact position in the early Universe phase. It is not yet clear if the SMBH and the host started forming at the same time, but several observational and theoretical works suggest that the SMBH started forming first, as inferred from the mild deviations of these objects in the M∙- (e.g. Walter et al. 2004; Jahnke et al. 2009, Merloni et al. 2010; Reines et al. 2011; Petri, Ferrara & Salvaterra 2012; Khandai et al. 2012). Our scenario also seems to support this case, as by the end of the z 2 phase the SMBH should be almost fully in place, being larger than expected from the galaxy stellar mass. Although we are not in the position to confirm this from our derived SFHs, we can pose a lower limit for the SMBHs growth at 10 Gyr, when the star formation activity in the host galaxy is halted. At this point, one would expect the massive compact galaxy to move into the second phase of formation, balancing out the deviations with its SMBH, which roughly evolves, by growing largely in size and mildly in mass through mergers. This will eventually place the massive galaxy in the local M∙ - Mbulge relation.
We are aware of the limited sample employed here, but so is the published sample of galaxies with detected SMBHs and accurate measurements or the sample of relic galaxy candidates. In a recent effort, Saulder, van den Bosch & Mieske (2015) have revisited the number of relic candidates in the SDSS, enlarging the one from Trujillo et al. (2009) to 76 candidates. The next step is to find out how many of these galaxies host a SMBH and if so, if they are ÜMBHs. This will be achieved with the upcoming era of the largest telescopes, when SMBH detections and measurements will be improved. On the meantime, surveys such as the hetmgs are ideal compilations for new SMBH detections. A deeper understanding on the formation of these extreme outliers (both in the upper and the low-mass end) is crucial to test the current theories of galaxy formation and evolution and cosmological models.
5. Summary
In this work we have studied a sample of 8 compact massive galaxies selected from the hetmgs that are candidates for hosting ÜMBHs and that are therefore considered extreme outliers from the correlation that the SMBHs and the mass of their host galaxies follow. We propose that they deviate because the host galaxies did not structurally evolve in the way expected for massive galaxies due to their relic nature. Our main results are here briefly summarized:
-
•
We find that 7 out of the 8 ÜMBH host candidates fulfill the criteria to be considered a relic galaxy (i.e. Re2 kpc and t10 Gyr), while one of them is a dubious case. Therefore, selecting galaxies that are extreme outliers in the SMBH mass scaling relations could represent a new way to find the elusive relic galaxies in the nearby Universe.
-
•
When we plot the M∙- and M∙-Mbulge relations, the loci of the galaxies hosting ÜMBHs should represent the position of the massive galaxy population at z2. As cosmic time progresses, galaxies following normal growth paths should evolve towards galaxies with larger host masses in those planes.
-
•
We can pose a lower limit to the age on the SMBH growth at 10 Gyr, based on the derived SFHs.
Appendix A STARLIGHT and the Star Formation Histories
We briefly summarize here how the full-spectral-fitting code STARLIGHT works, but the reader is referred to the source code papers for a more detailed explanation (Cid Fernandes et al. 2005, Cid Fernandes & González Delgado 2010). The code models the extinction as due to foreground dust, and different reddening-laws can be selected to correct from Galactic extinction. Then, it finds the fraction that a given th SSP contributes to the total flux of the galaxy (normalized to a certain wavelength ), creating a synthetic spectrum. In other words, it creates a combination of SSPs that best resemble the observed galaxy spectrum and that minimize the . The first two parameters presented in Table 2 are indicative of the quality of the fit. [] represents the total divided by the number of ’s used in the fit. The second parameter, adev, is a proxy for the mean deviation over all fitted pixels. Good values for a fit are those with adev below 2-3. A visual inspection of the fits and their residuals confirms the quality of the results obtained (see Figures A1 and A2).
From each we can derive its contribution in mass, , directly from the mass-to-light ratio of each individual SSP (from the models), to obtain the desired mass-weighted estimates such as the star formation episodes and mean stellar populations parameters, which are derived as:
| (A1) |
| (A2) |
We can therefore reconstruct the SFH of the galaxy by summing up all the fractions of stellar mass created at a given epoch, as shown in Figures A1 and A2. They present the whole spectroscopic sample data and their derived SFHs. Like in Figure 3, the left panels show the galaxy spectrum with fit from STARLIGHT and the right side ones, the derived SFHs in terms of stellar mass.
References
- Beifiori et al. (2012) Beifiori A., Courteau S., Corsini E. M., Zhu Y., 2012, MNRAS, 419, 2497
- Bogdán et al. (2012) Bogdán Á. et al., 2012, ApJ, 753, 140
- Buitrago et al. (2008) Buitrago F., Trujillo I., Conselice C. J., Bouwens R. J., Dickinson M., Yan H., 2008, ApJ, 687, L61
- Cappellari et al. (2011) Cappellari M. et al., 2011, MNRAS, 413, 813
- Cappellari et al. (2012) —, 2012, Nature, 484, 485
- Carrasco, Conselice & Trujillo (2010) Carrasco E. R., Conselice C. J., Trujillo I., 2010, MNRAS, 405, 2253
- Cenarro & Trujillo (2009) Cenarro A. J., Trujillo I., 2009, ApJ, 696, L43
- Cid Fernandes & González Delgado (2010) Cid Fernandes R., González Delgado R. M., 2010, MNRAS, 403, 780
- Cid Fernandes et al. (2005) Cid Fernandes R., Mateus A., Sodré L., Stasińska G., Gomes J. M., 2005, MNRAS, 358, 363
- Conroy & van Dokkum (2012) Conroy C., van Dokkum P., 2012, ApJ, 747, 69
- Emsellem (2013) Emsellem E., 2013, MNRAS, 433, 1862
- Fabian (1999) Fabian A. C., 1999, MNRAS, 308, L39
- Fabian et al. (2013) Fabian A. C., Sanders J. S., Haehnelt M., Rees M. J., Miller J. M., 2013, MNRAS, 431, L38
- Ferrarese & Merritt (2000) Ferrarese L., Merritt D., 2000, ApJ, 539, L9
- Ferré-Mateu, Vazdekis & de la Rosa (2013) Ferré-Mateu A., Vazdekis A., de la Rosa I. G., 2013, MNRAS, 431, 440
- Ferré-Mateu et al. (2012) Ferré-Mateu A., Vazdekis A., Trujillo I., Sánchez-Blázquez P., Ricciardelli E., de la Rosa I. G., 2012, MNRAS, 423, 632
- Ferreras et al. (2013) Ferreras I., La Barbera F., de la Rosa I. G., Vazdekis A., de Carvalho R. R., Falcón-Barroso J., Ricciardelli E., 2013, MNRAS, 429, L15
- Gebhardt et al. (2000) Gebhardt K. et al., 2000, ApJ, 539, L13
- Graham et al. (2011) Graham A. W., Onken C. A., Athanassoula E., Combes F., 2011, MNRAS, 412, 2211
- Graham & Scott (2013) Graham A. W., Scott N., 2013, ApJ, 764, 151
- Greene, Peng & Ludwig (2010) Greene J. E., Peng C. Y., Ludwig R. R., 2010, ApJ, 709, 937
- Gültekin et al. (2009) Gültekin K. et al., 2009, ApJ, 698, 198
- Häring & Rix (2004) Häring N., Rix H.-W., 2004, ApJ, 604, L89
- Hilz, Naab & Ostriker (2013) Hilz M., Naab T., Ostriker J. P., 2013, MNRAS, 429, 2924
- Hilz et al. (2012) Hilz M., Naab T., Ostriker J. P., Thomas J., Burkert A., Jesseit R., 2012, MNRAS, 425, 3119
- Hopkins et al. (2006) Hopkins P. F., Hernquist L., Cox T. J., Robertson B., Springel V., 2006, ApJS, 163, 50
- Jahnke et al. (2009) Jahnke K. et al., 2009, ApJ, 706, L215
- Jahnke & Macciò (2011) Jahnke K., Macciò A. V., 2011, ApJ, 734, 92
- Kauffmann et al. (2003) Kauffmann G. et al., 2003, MNRAS, 341, 33
- Khandai et al. (2012) Khandai N., Feng Y., DeGraf C., Di Matteo T., Croft R. A. C., 2012, MNRAS, 423, 2397
- Kormendy & Ho (2013) Kormendy J., Ho L. C., 2013, ARA&A, 51, 511
- Kormendy & Richstone (1995) Kormendy J., Richstone D., 1995, ARA&A, 33, 581
- Krajnović et al. (2013) Krajnović D. et al., 2013, MNRAS, 432, 1768
- Kulier et al. (2015) Kulier A., Ostriker J. P., Natarajan P., Lackner C. N., Cen R., 2015, ApJ, 799, 178
- La Barbera et al. (2013) La Barbera F., Ferreras I., Vazdekis A., de la Rosa I. G., de Carvalho R. R., Trevisan M., Falcón-Barroso J., Ricciardelli E., 2013, MNRAS, 433, 3017
- Läsker et al. (2013) Läsker R., van den Bosch R. C. E., van de Ven G., Ferreras I., La Barbera F., Vazdekis A., Falcón-Barroso J., 2013, MNRAS, 434, L31
- Magorrian et al. (1998) Magorrian J. et al., 1998, AJ, 115, 2285
- Martín-Navarro et al. (2015) Martín-Navarro I., La Barbera F., Vazdekis A., Ferré-Mateu A., Trujillo I., Beasley M. A., 2015, ArXiv e-prints:1505.01485
- McConnell & Ma (2013) McConnell N. J., Ma C.-P., 2013, ApJ, 764, 184
- Menci et al. (2008) Menci N., Fiore F., Puccetti S., Cavaliere A., 2008, ApJ, 686, 219
- Merloni et al. (2010) Merloni A. et al., 2010, ApJ, 708, 137
- Naab, Johansson & Ostriker (2009) Naab T., Johansson P. H., Ostriker J. P., 2009, ApJ, 699, L178
- Oogi & Habe (2013) Oogi T., Habe A., 2013, MNRAS, 428, 641
- Oser et al. (2012) Oser L., Naab T., Ostriker J. P., Johansson P. H., 2012, ApJ, 744, 63
- Oser et al. (2010) Oser L., Ostriker J. P., Naab T., Johansson P. H., Burkert A., 2010, ApJ, 725, 2312
- Petri, Ferrara & Salvaterra (2012) Petri A., Ferrara A., Salvaterra R., 2012, MNRAS, 422, 1690
- Poggianti et al. (2013) Poggianti B. M. et al., 2013, ApJ, 762, 77
- Quilis & Trujillo (2013) Quilis V., Trujillo I., 2013, ApJ, 773, L8
- Reines et al. (2011) Reines A. E., Sivakoff G. R., Johnson K. E., Brogan C. L., 2011, Nature, 470, 66
- Ricciardelli et al. (2012) Ricciardelli E., Vazdekis A., Cenarro A. J., Falcón-Barroso J., 2012, MNRAS, 424, 172
- Rusli et al. (2011) Rusli S. P., Thomas J., Erwin P., Saglia R. P., Nowak N., Bender R., 2011, MNRAS, 410, 1223
- Saulder, van den Bosch & Mieske (2015) Saulder C., van den Bosch R. C. E., Mieske S., 2015, ArXiv e-prints: 1503.05117
- Schulze & Gebhardt (2011) Schulze A., Gebhardt K., 2011, ApJ, 729, 21
- Shen et al. (2003) Shen S., Mo H. J., White S. D. M., Blanton M. R., Kauffmann G., Voges W., Brinkmann J., Csabai I., 2003, MNRAS, 343, 978
- Somerville et al. (2008) Somerville R. S., Hopkins P. F., Cox T. J., Robertson B. E., Hernquist L., 2008, MNRAS, 391, 481
- Spiniello et al. (2012) Spiniello C., Trager S. C., Koopmans L. V. E., Chen Y. P., 2012, ApJ, 753, L32
- Taylor et al. (2010) Taylor E. N., Franx M., Glazebrook K., Brinchmann J., van der Wel A., van Dokkum P. G., 2010, ApJ, 720, 723
- Trujillo, Carrasco & Ferré-Mateu (2012) Trujillo I., Carrasco E. R., Ferré-Mateu A., 2012, ApJ, 751, 45
- Trujillo et al. (2009) Trujillo I., Cenarro A. J., de Lorenzo-Cáceres A., Vazdekis A., de la Rosa I. G., Cava A., 2009, ApJ, 692, L118
- Trujillo et al. (2007) Trujillo I., Conselice C. J., Bundy K., Cooper M. C., Eisenhardt P., Ellis R. S., 2007, MNRAS, 382, 109
- Trujillo et al. (2014) Trujillo I., Ferré-Mateu A., Balcells M., Vazdekis A., Sánchez-Blázquez P., 2014, ApJ, 780, L20
- Trujillo, Ferreras & de La Rosa (2011) Trujillo I., Ferreras I., de La Rosa I. G., 2011, MNRAS, 415, 3903
- Trujillo et al. (2004) Trujillo I. et al., 2004, ApJ, 604, 521
- van den Bosch et al. (2012) van den Bosch R. C. E., Gebhardt K., Gültekin K., van de Ven G., van der Wel A., Walsh J. L., 2012, Nature, 491, 729
- van den Bosch et al. (2015) van den Bosch R. C. E., Gebhardt K., Gültekin K., Yıldırım A., Walsh J. L., 2015, ApJS, 218, 10
- Vazdekis et al. (2012) Vazdekis A., Ricciardelli E., Cenarro A. J., Rivero-González J. G., Díaz-García L. A., Falcón-Barroso J., 2012, MNRAS, 424, 157
- Walsh et al. (2015 subm.) Walsh J. L., van den Bosch R. C. E., Gebhardt K., Yıldırım A., Gültekin K., Richstone D. O., 2015 subm., ApJ
- Walter et al. (2004) Walter F., Carilli C., Bertoldi F., Menten K., Cox P., Lo K. Y., Fan X., Strauss M. A., 2004, ApJ, 615, L17
- Wellons et al. (2015) Wellons S. et al., 2015, MNRAS, 449, 361
- Yamada et al. (2006) Yamada Y., Arimoto N., Vazdekis A., Peletier R. F., 2006, ApJ, 637, 200
- Yıldırım et al. (2015 subm.) Yıldırım A., van den Bosch R. C. E., Gebhardt K., Gültekin K., van de Ven G., Walsh J. L., 2015 subm., MNRAS
- Yoo et al. (2007) Yoo J., Miralda-Escudé J., Weinberg D. H., Zheng Z., Morgan C. W., 2007, ApJ, 667, 813