The Kapteyn moving group is not tidal debris from Centauri111Based on observations collected at the European Southern Observatory, Chile (ESO Program 090.B-0605) and observations gathered with the 6.5 m Magellan Telescopes at Las Campanas Observatory, Chile.
Abstract
The Kapteyn moving group has been postulated as tidal debris from Centauri. If true, members of the group should show some of the chemical abundance patterns known for stars in the cluster. We present an optical and near-infrared high-resolution, high-signal-to-noise ratio spectroscopic study of 14 stars of the Kapteyn group, plus 10 additional stars (the Cen group) that, while not listed as members of the Kapteyn group as originally defined, have nevertheless been associated dynamically with Centauri. Abundances for Na, O, Mg, Al, Ca, and Ba were derived from the optical spectra, while the strength of the chromospheric He I 10830 Å line is studied as a possible helium abundance indicator. The resulting Na–O and Mg–Al patterns for stars of the combined Kapteyn and Cen group samples do not resemble those of Centauri, and are not different from those of field stars of the Galactic halo. The distribution of equivalent widths of the He I 10830 Å line is consistent with that found among non-active field stars. Therefore, no evidence is found for second-generation stars within our samples, which most likely rules out a globular-cluster origin. Moreover, no hint of the unique barium overabundance at the metal-rich end, well established for Centauri stars, is seen among stars of the combined samples. Because this specific Ba pattern is present in Centauri irrespective of stellar generation, this would rule out the possibility that our entire sample might be composed of only first-generation stars from the cluster. Finally, for the stars of the Kapteyn group, the possibility of an origin in the hypothetical parent galaxy of Centauri is disfavored by the different run of -elements with metallicity between our targets and stars from present-day dwarf galaxies.
Subject headings:
stars: abundances, globular clusters: individual (NGC 5139), Galaxy: halo1. Introduction
Stellar halos of galaxies such as the Milky Way (MW) are thought to form hierarchically via the accumulation of stars from smaller satellite galaxies formed at earlier times (Searle & Zinn 1978; Freeman & Bland-Hawthorn 2002). Strong evidence for this scenario has been found in the MW as well as in extragalactic environments, e.g., in the form of accreting galaxies and star clusters, often displaying long tidal tails and organized streams of stars (Belokurov et al. 2006; Martínez-Delgado et al. 2012). Indeed, the accretion of independent stellar systems into the MW is taking place even today, notably demonstrated by the Sagittarius stellar stream (Ibata et al. 1994, 1995; Vivas et al. 2001; Majewski et al. 2003) and many others.
These disrupting systems are depositing their stellar populations into the Galactic field, particularly the stellar halo, and therefore the study of the detailed chemistry and kinematics of halo stars, and their comparison with stars in the aforementioned stellar streams, should shed light on the processes and the progenitors responsible for this hierarchical mode of MW assembly. Achieving this, however, is complicated by the large distances to the presently occurring, easily identifiable, accretion events, which prevent us from studying them in all the detail that is possible when studying more local populations. Therefore, it would be desirable to study instead the remnants of accretion events existing today within the solar neighborhood. However, identifying local stars that have been accreted throughout the MW’s history is not an easy task because most of these should have mixed by now with the background Galactic stellar populations.
Despite such difficulties, efforts to identify accreted stars in the Galactic field have already started to uncover what appears to be the long sought-after population of halo field stars that originated in disrupted globular clusters (GCs), particularly those corresponding to second-generation stars111Hereafter, the term “generations” will be used to refer to groups of GC stars that present differences in their light-element abundances, such as Na, O, Mg, and Al, as well as in their helium content.. First, Martell et al. (2011) found 3% of red giant stars with CN and CH bandstrengths consistent with depleted carbon and enhanced nitrogen abundances, an atypical light-element pattern found only in GC second-generation stars. The same fraction was obtained by Ramírez et al. (2012), who discovered the first examples of field dwarf stars showing low oxygen and high sodium abundances, which are key signatures of the O–Na anticorrelation, a characteristic abundance pattern seen only among GC stars. Based on the models of Vesperini et al. (2010) for the evolution of GCs in the field of the Galaxy, these results suggest to us that a fraction as large as 40-50% of the present Galactic stellar halo might be composed of stars, from both first and second generations, originating in such stellar systems.
Another opportunity for identifying field stars originally belonging to GCs might be provided by the measurement of helium abundances. Although initially unpopular, the hypothesis of stellar generations with high helium abundance (up to 0.40, Norris 2004) arguably remains as the most solid explanation for the observed splitting of the main sequences (MSs) of Centauri and various other GCs, while at the same time opening possibilities for the natural resolution of additional long-standing puzzles. In fact, spectroscopic studies of stars in the different MSs of some GCs found that the blue MS is more metal-rich than the red one, something that could be explained only if the blue MS has a higher He abundance (D’Antona et al. 2005; Piotto et al. 2005, 2007). Recent spectroscopic studies that could directly measure the He abundance in the horizontal branch of GCs known to host different MSs confirmed this scenario, and also found that wider MS splitting requires higher helium enhancement (see e.g., Villanova et al. 2012; Marino et al. 2014; Mucciarelli et al. 2014; Valcarce et al. 2014; Milone 2015). Previous to these recent developments, there has been a long history of well documented abundance anomalies as tracked by the luminous red giants in GCs, and extended down to below the MS turn-off in more recent years. Notorious among these are correlated and anticorrelated abundances of elements such as C, N, O, Na, Mg, Al, and others, all thought to arise from He-producing, high-temperature branches of hydrogen-burning chains (see e.g., Gratton et al. 2004; Carretta et al. 2007, 2009a, 2009b, 2010b; Gratton et al. 2012, and references therein).
In this context, first-generation GC stars are those that have chemical abundances indistinguishable from the MW halo field stars, at a given metallicity. Second-generation GC stars present “anomalies” in the chemical abundances such as low oxygen, magnesium, and carbon, and enhanced sodium, nitrogen, and aluminum (Carretta et al. 2009a, b; Martell et al. 2011). Spectroscopic studies confirmed that second-generation GC stars are also helium-enhanced (Pasquini et al. 2011; Dupree & Avrett 2013; Marino et al. 2014).
Most of the uncommon characteristics of the Centauri GC, such as its wide metallicity distribution, abundance anomalies (Norris & Da Costa 1995), multiple stellar populations222By “populations” we are referring to different mean metallicity peaks in the metallicity distribution of a group of stars. (Bedin et al. 2004), mildly retrograde orbit (Dinescu et al. 1999), among others, strongly suggest that it may be the remnant nucleus of an accreted dwarf galaxy from a past merger event (Freeman 1993; Bekki & Freeman 2003; Lee et al. 2009). This might make Centauri the nearest surviving remnant of a true Galactic building block, one from which stars were stripped and incorporated into the Galactic field populations. Thus it would be of significant interest to identify stars in the solar neighborhood that could be unambiguously linked to this merger event.
Chemical abundances measured for the different populations observed along the red giant branch (RGB) of Centauri have shown that the cluster had a complex chemical enrichment history. In fact, despite the cluster being suspected to be the remnant nucleus of a disrupted dwarf galaxy, it has [/Fe] ratios between 0.0 and 0.26 dex, more similar to the MW field stars (Gratton et al. 2011) than to dwarf galaxies, which display sub-solar [/Fe] abundances (see Tolstoy et al. 2009). At the same time, Centauri has higher s-process abundances, as other dwarf galaxies show (Tolstoy et al. 2009), but the fast rise in the barium abundance with metallicity seen in stars in Centauri is not found in any other galaxy or star cluster (see, e.g., Geisler et al. 2007; Johnson & Pilachowski 2010; Marino et al. 2011). Such specific variation of Ba abundances with metallicity among stars in Centauri is extremely important because it is independent of whether stars are from the first or second generation, and it is displayed by all populations in the cluster. Besides the overabundance of s-process elements, Centauri displays the well-known O–Na and Mg–Al anticorrelations found in most GCs (Johnson & Pilachowski 2010). The O–Na anticorrelation is found over almost the whole metallicity range measured in the cluster, except in the most metal-rich population (Gratton et al. 2011; Marino et al. 2011). The anticorrelation is more marked than that observed typically in GCs, but similar to NGC 2808, another of the most massive GCs in the MW (Gratton et al. 2011). Like other GCs, Centauri has almost equal fractions of first- and second-generation stars in the metal-poor population, but an exceptionally high fraction of second-generation stars in the metal-intermediate and metal-rich populations (less than 20% of the stars associated with the intermediate-metallicity population have abundances consistent with first-generation stars; see Johnson & Pilachowski 2010, and references therein).
The Kapteyn moving group was originally identified as composed of stars seemingly distinct, kinematically speaking, from the bulk disk and halo local populations (Eggen 1978, 1996; Navarro et al. 2004). Recently, Wylie-de Boer et al. (2010, WdB10 hereafter) studied chemical abundances of some members of the Kapteyn group, concluding that they have abundance patterns similar to those found among Centauri red giants, including abundance ratios involving Na, Ba, and s-process elements that are enhanced compared to the field halo stars. Furthermore, they argued that stars in the Kapteyn group are nicely located in the range of expected values of angular momentum and energy for Centauri tidal debris (Dinescu 2002; Meza et al. 2005). Based on those arguments, WdB10 suggested that some stars in the Kapteyn group may be part of the tidal debris from the same merger event that disrupted Centauri’s parent dwarf galaxy. However, errors in the abundance determinations of WdB10, added to the use of literature values from heterogeneous sources to compare the populations of the halo and Centauri with the Kapteyn stars, justify a re-examination of this conclusion. Furthermore, WdB10 do not consider the oxygen abundance, which follows a very marked anticorrelation with sodium in GC stars and thus could constitute a key ingredient to properly disentangle between field and GC origins (Carretta et al. 2009a). Hence, the association between the Kapteyn moving group and Centauri stars should be considered with caution and not as unambiguously established.
Moreover, as discussed earlier, another species that could be used to uncover field stars of GC origins is helium, although using this element for the chemical tagging of field stars has not been attempted yet, to the best of our knowledge. Measuring the abundance of helium is a significant observational challenge because He absorption lines need quite high temperatures to be formed (higher than 8000 K), and even at these temperatures the optical He I line ( 5875.5 Å) is weak and needs high signal-to-noise ratio (S/N) spectra to be properly measured (Villanova et al. 2009, 2012). Additionally, at higher temperatures ( 11500 K), helium suffers of sedimentation and settling, diminishing the strength of the absorption line and, hence, yielding underestimated photospheric He abundances. Cool stars are not hot enough to produce the He transition in the optical, but they commonly display the near-IR He I 10830 Å chromospheric line. This line historically has been used as a chromospheric activity indicator for late-type giant and supergiant stars (Obrien & Lambert 1986; Takeda & Takada-Hidai 2011; Smith et al. 2012); and as a sensitive probe of mass loss by stellar winds (Dupree et al. 2009). Moreover, Sanz-Forcada & Dupree (2008) have demonstrated a direct relation between the He I line and the extreme ultraviolet and X-ray emission flux related to coronal activity in cool stars.
The connection between the chromospheric He line and the possibility of helium enhancement has been scarcely studied but the few available results are quite suggestive. Dupree et al. (2011) studied red giants in Centauri using infrared and optical spectra, finding that the stars that have larger He I 10830 Å equivalent widths (EWs) also have the largest [Al/Fe] and [Na/Fe] abundances, arguably deriving the first convincing evidence for an enhancement of helium in giant stars in this cluster. A similar study was carried out by Pasquini et al. (2011), who studied the difference between two giants of NGC 2808 with similar stellar parameters but strongly different Na and O abundances, finding that a helium enhancement of in the Na-rich, O-poor star is required to fit theoretical chromospheric models in their infrared spectra. Recently, Dupree & Avrett (2013) used state-of-the-art radiative transfer models considering a semi-empirical non-LTE spherical atmosphere, in addition to a chromospheric model, deriving the helium abundance of two giants from Centauri; they found that the star that is Na- and Al-rich is consistent with with a marked chromospheric He I line in absorption. This is, to our knowledge, the only work that derives a helium abundance based on the He I 10830 Å line.
In this paper we aim to study the chemistry and kinematics of the Kapteyn moving group in order to establish whether it can be unambiguously associated to Centauri or not. Moreover, we add to our sample a number of stars from the kinematically selected “ Cen group”, as defined by Meza et al. (2005) using the angular momentum distribution of metal-poor field stars. If both groups are constituted by stripped stars from Centauri, we expect at least four and three stars with second-generation chemical abundances in our sample, respectively. Moreover, they also should present the unique Ba– pattern, which is independent of the stellar generation. From the chemical analysis, the classical correlations and anticorrelations expected in GC stars are studied. At the same time, the possibility of He enhancement is addressed using the near-IR He I chromospheric line. The paper is organized as follows. In Section 2 the observations and data reduction from the optical and infrared spectra are presented. The measurement of stellar parameters for the full sample and the determination of elemental abundances and near-IR He I EWs are described in Section 3. The resulting chemical patterns are discussed in Section 4, and in Section 5 we briefly examine the kinematics of the studied samples. Our conclusions are presented in Section 6.
2. Observations and data reduction
2.1. Target Selection
We target stars from the Kapteyn group, an apparently coherent kinematic structure within the solar neighborhood that has recently been linked, both kinematically and chemically, to the GC Centauri (WdB10). Eggen (1996) listed 33 stars kinematically associated to the Kapteyn group (earlier defined by Eggen 1977), from which there are 7 that are variable. Our sample collects 14 of the remaining 26 non-variable stars, all of them included in the study of WdB10, which contains a total of 16 stars, extracted from the study of Eggen (1996).
We also include in our sample stars from the “ Cen group” of Meza et al. (2005), identified as having specific angular momenta similar to that of the Centauri cluster and slightly retrograde orbits (50 km s-1 Vrot 0 km s-1). These stars are part of the catalogs of metal-poor field stars of Beers et al. (2000) and Gratton et al. (2003).
A comparison sample of field stars was also observed. These stars were selected from the catalog of Gratton et al. (2003), such that they span the range of stellar parameters of stars in the Kapteyn and Cen groups.
Table 1 lists our target stars with their fundamental atmospheric parameters, as determined below.
| Star | [Fe/H] | |||
|---|---|---|---|---|
| (km s-1) | (K) | (dex) | (dex) | |
| Kapteyn Group Stars | ||||
| CD-30 1121 | 105.25 0.33 | 4955 65 | 2.07 0.16 | -1.919 0.06 |
| CD-62 1346 | 125.74 0.35 | 5524 83 | 2.16 0.18 | -1.399 0.06 |
| HD 110621 | 222.17 0.33 | 6212 97 | 4.04 0.20 | -1.522 0.07 |
| HD 111721aaReference star (see Section 3 and Table 3). | 21.53 0.35 | 4990 | 2.60 | -1.380 |
| HD 13979 | 52.38 0.36 | 5023 145 | 1.47 0.22 | -2.441 0.08 |
| HD 181007 | -1.72 0.35 | 4979 51 | 2.23 0.13 | -1.721 0.05 |
| HD 181743 | 29.50 0.37 | 5998 123 | 4.26 0.26 | -1.795 0.09 |
| HD 186478 | 31.45 0.35 | 4568 85 | 0.88 0.19 | -2.500 0.07 |
| HD 188031 | -144.21 0.40 | 6288 81 | 4.24 0.16 | -1.649 0.06 |
| HD 193242 | -127.85 0.39 | 5031 54 | 2.35 0.14 | -1.778 0.05 |
| HD 208069 | -166.59 0.41 | 5065 46 | 2.47 0.12 | -1.741 0.04 |
| HD 21022 | 122.85 0.33 | 4524 62 | 0.89 0.15 | -2.204 0.05 |
| HD 215601 | -36.65 0.36 | 4972 45 | 1.67 0.12 | -1.460 0.04 |
| HD 215801 | -90.87 0.40 | 6065 184 | 3.69 0.18 | -2.183 0.06 |
| Cen group Stars | ||||
| BD+02 3375 | -397.77 0.49 | 6009 160 | 4.01 0.18 | -2.190 0.06 |
| CD-61 0282 | 220.35 0.34 | 5815 70 | 4.30 0.16 | -1.234 0.06 |
| HD 113083aaReference star (see Section 3 and Table 3). | 227.91 0.46 | 5800 | 4.35 | -0.930 |
| HD 121004 | 245.63 0.33 | 5651 48 | 4.31 0.11 | -0.784 0.04 |
| HD 140283 | -170.36 0.39 | 5788 79 | 3.56 0.13 | -2.393 0.05 |
| HD 148816 | -47.62 0.34 | 5876 43 | 4.16 0.11 | -0.790 0.04 |
| HD 193901 | -171.39 0.39 | 5721 44 | 4.42 0.11 | -1.109 0.04 |
| HD 194598 | -247.04 0.40 | 5998 47 | 4.33 0.12 | -1.148 0.04 |
| HD 3567 | -47.60 0.35 | 6130 51 | 4.06 0.12 | -1.200 0.04 |
| HD 84937 | -15.12 0.39 | 6280 150 | 4.00 0.20 | -2.089 0.07 |
| Field Stars | ||||
| HD 102200 | 161.26 0.33 | 6113 62 | 4.15 0.15 | -1.222 0.05 |
| HD 116064 | 140.26 0.38 | 6010 195 | 4.16 0.22 | -1.848 0.07 |
| HD 128279 | -75.44 0.35 | 5245 97 | 2.79 0.23 | -2.123 0.08 |
| HD 134439 | 310.04 0.34 | 4956 69 | 4.60 0.17 | -1.440 0.06 |
| HD 134440 | 310.77 0.35 | 4795 66 | 4.60 0.16 | -1.426 0.06 |
| HD 142948 | 29.28 0.35 | 5024 87 | 2.52 0.14 | -0.720 0.05 |
| HD 145417aaReference star (see Section 3 and Table 3). | 8.68 0.37 | 4900 | 4.60 | -1.349 |
| HD 151559 | 16.67 0.37 | 5167 59 | 2.54 0.13 | -0.769 0.05 |
| HD 17072 | 62.43 0.36 | 5398 58 | 2.37 0.14 | -1.128 0.05 |
| HD 184266 | -348.82 0.47 | 5908 80 | 2.20 0.18 | -1.463 0.06 |
| HD 190287 | 143.74 0.33 | 5108 47 | 2.78 0.12 | -1.429 0.04 |
| HD 199289 | -5.95 0.34 | 5842 54 | 4.27 0.13 | -1.090 0.05 |
| HD 211998 | 32.10 0.34 | 5233 46 | 3.25 0.12 | -1.519 0.04 |
| HD 219617 | 13.28 0.35 | 5981 61 | 4.40 0.15 | -1.427 0.05 |
| HD 221580 | -17.35 0.36 | 5245 60 | 2.30 0.15 | -1.215 0.05 |
| HD 222434 | 16.88 0.36 | 4517 53 | 1.21 0.13 | -1.770 0.05 |
| HD 222925 | -38.64 0.36 | 5710 60 | 2.32 0.14 | -1.371 0.05 |
| HD 23798 | 88.88 0.34 | 4396 60 | 0.64 0.15 | -2.220 0.05 |
| HD 26169 | -34.42 0.35 | 5010 68 | 2.06 0.16 | -2.396 0.06 |
| HD 83212 | 109.21 0.32 | 4543 57 | 1.17 0.13 | -1.504 0.05 |
| HD 9051 | -71.99 0.38 | 4884 49 | 2.08 0.12 | -1.652 0.04 |
2.2. MIKE Optical Spectra
Optical spectroscopic observations of our sample stars were carried out using the MIKE spectrograph on the 6.5 m Magellan/Clay Telescope at Las Campanas Observatory. We employed the standard setup with the narrowest slit (width 0.35 arcsec), leading to spectral resolution of and in the blue and red CCDs, respectively. The full wavelength range covered by the standard setup of the MIKE spectrograph is 320-1000 nm. The S/N of our spectra varies from star to star, but it is typically in the range from 150 to 200 per pixel at 6000 Å.
The MIKE spectra were reduced (trimmed, corrected for overscan, flat-fielded, and corrected for background/scattered light) with the CarnegiePython pipeline, which also provides a wavelength mapping on the data with the help of ThAr exposures taken throughout each observing night. These reduced spectra were further processed for continuum normalization, merging, and co-adding of multiple exposures (when needed) using common IRAF333IRAF is the Image Reduction and Analysis Facility, a general-purpose software system for the reduction and analysis of astronomical data. IRAF is written and supported by National Optical Astronomy Observatories (NOAO) in Tucson, Arizona. tasks within the echelle package.
The continuum normalization procedure can introduce errors in elemental abundance measurements. To estimate this effect, we tested different normalization parameters such as the order of the polynomials used to fit the upper envelopes of the data and the sigma-clipping values. On a representative spectrum from our dataset, we estimated changes in our EW measurements of up to 5%, which translate to about 0.02 dex in [X/H]. These errors are smaller than our estimated total error of about 0.05 dex, which is dominated by the model uncertainties. Moreover, the changes in EW values were calculated relative to our preferred normalization method. If all EWs are measured consistently, i.e., on spectra that have been normalized using the same parameters, the errors are minimized because we employ strict differential analysis using stars with similar stellar parameters, for which the normalization procedure traces very similar continua. Even if the continuum errors were of order 0.02 dex, they would not be large enough to invalidate our main chemical tagging conclusions. As can be inferred from Figures 3 to 7, we would have had to under- or overestimate abundance ratios of some of our stars by up to 0.5 dex to make a number of our stars be consistent with the Centauri patterns.
2.2.1 Radial Velocities (RVs)
RVs were computed by cross-correlation of our spectra with those of a set of five RV standard stars. Barycentric corrections were first computed using IRAF’s task rvcor. The cross-correlation calculations were done employing IRAF’s task fxcor. The standard stars were chosen from the RV catalogs by Nidever et al. (2002) and Soubiran et al. (2013). The standard stars are (their adopted RVs, in km s-1, are given in parenthesis, and are known to be stable within about 0.5 km s-1): HD 111721 (), HD 128279 (), HD 193901 (), HD 134439 (), and HD 134440 ().
Cross-correlation was performed on the spectra on an order-by-order basis and for the blue and red CCDs separately. We employed 28 (15) orders in the blue (red) CCD, which cover the spectral range from 3560 to 4980 Å (4850-6200 Å). The order-to-order RV scatter of a typical cross-correlation calculation is less than about 0.2 km s-1. The RVs from the blue and red CCDs were found to be in excellent agreement, with a mean difference of km s-1. Thus, we averaged the RVs from the blue and red CCDs to increase the RV precision.
Each stellar spectrum was cross-correlated with the five standards, resulting in five RV values. The final RV is the average of those five RVs, and the adopted error is the standard deviation from that mean. On average, this error is about 0.4 km s-1, which shows that our RV uncertainty is dominated by our choice of RV standards and, specifically, their adopted RV values.
2.3. Infrared Spectra from the CRyogenic InfraRed Echelle Spectrograph (CRIRES)
High-resolution, high-S/N near-infrared spectra for the target stars were collected using the CRIRES (Kaeufl et al. 2004) mounted on the VLT UT1 telescope. The observations were carried out in Service Mode (Program 090.B-0605(B), 29 hr, P.I. J.C.) from 2011 October through 2012 March.
The CRIRES setting employed a slit width of 04 with the grating order #52, yielding a spectral resolution of 50 000 . This configuration allows us to observe the He I 10830 Å near the center of chip 3, which covers a range not affected by vignetting444Section 15 of CRIRES User Manual http://www.eso.org/sci/facilities/paranal/instruments/crires/doc/VLT-MAN-ESO-14500-3486_V93.pdf. Under this setup, detector 3 has a wavelength reference of 10827 Å (wavelength at the middle of the detector) and a wavelength coverage from 10800 to 10860 Å.
Data reduction was performed using the CRIRES pipeline (Common Pipeline Library recipes, version 2.4), running under the GASGANO environment555Gasgano is an ESO tool designed to manage and handle in a systematic way the astronomical data observed and produced with VLT instruments. http://www.eso.org/sci/software/gasgano/. Master dark subtraction, bad pixel map, flat-fielding, and corrections for nonlinearity effects were applied. Wavelength calibration for the spectra was applied using ThAr wavelamp frames. In order to improve the wavelength solution a high-resolution ISAAC spectrum666Available as Spectrocopic Standard at http://www.eso.org/sci/facilities/paranal/decommissioned/isaac/tools/spectroscopic_standards.html. with telluric lines was used as reference and a conversion equation was determined from the difference between the nominal wavelength of the telluric lines and the obtained positions from the hot, fast rotating star HR 1996. On average, the telluric lines appeared redshifted by 0.5Å with respect to their nominal wavelength.
Since the ThAr catalog lines used during the wavelength calibration of the spectra are in vacuum wavelengths, the He I line does not appear at 10830 Å (air wavelength), but instead it is found slightly redshifted, at 10833 Å. In order to properly join the information from the Arcturus stellar lines atlas by Hinkle et al. (1995, in vacuum wavelengths) and the atmospheric water vapor lines listed by Breckinridge & Hall (1973, in air wavelengths), the IAU standard equation of Edlén (1953) was used to go from one to the other. The coefficients for the infrared regime were derived by Peck & Reeder (1972). Table 2 shows the air and vacuum wavelengths for the stellar and telluric lines expected to be found in the CRIRES spectra.
| Line | ||
|---|---|---|
| (Å) | (Å) | |
| Stellar Lines | ||
| Cr I | 10801.36 | 10804.32 |
| Mg I | 10811.08 | 10814.05 |
| Cr I | 10816.90 | 10819.86 |
| Fe I | 10818.28 | 10821.26 |
| S I | 10821.18 | 10824.17 |
| Cr I | 10821.66 | 10824.58 |
| Si I | 10827.09 | 10830.06 |
| He I | 10830.34 | 10833.31 |
| Ca I | 10833.38 | 10836.35 |
| Na I | 10834.87 | 10837.84 |
| Ca I | 10838.97 | 10841.94 |
| Si I | 10843.85 | 10846.82 |
| Ca I | 10846.79 | 10849.74 |
| Ti I | 10847.63 | 10850.61 |
| Telluric Lines | ||
| 10815.95 | 10818.92 | |
| 10832.10 | 10835.08 | |
| 10833.98 | 10836.95 | |
| 10838.03 | 10841.00 | |
| 10840.81 | 10843.78 | |
| 10843.19 | 10846.17 | |
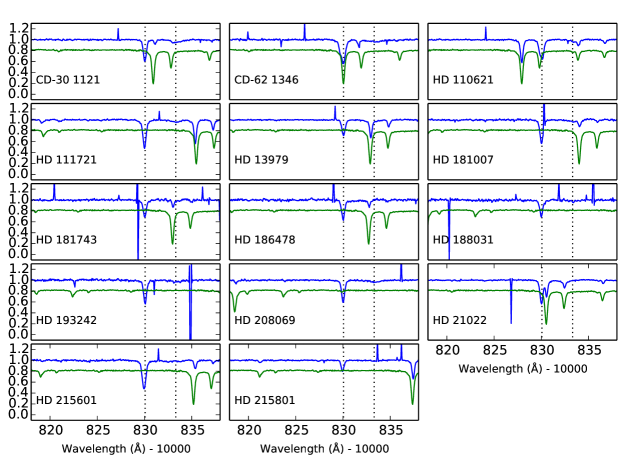
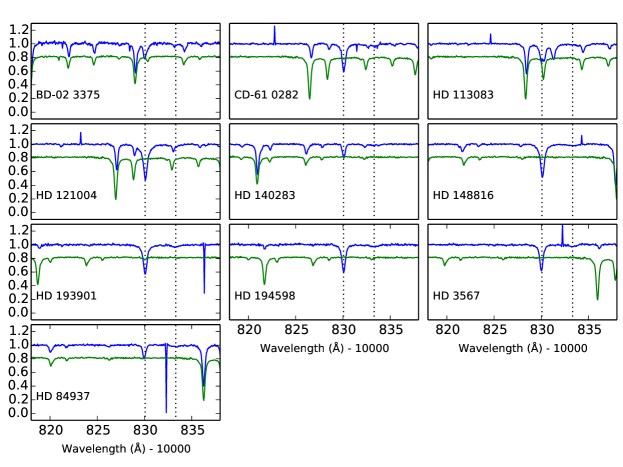
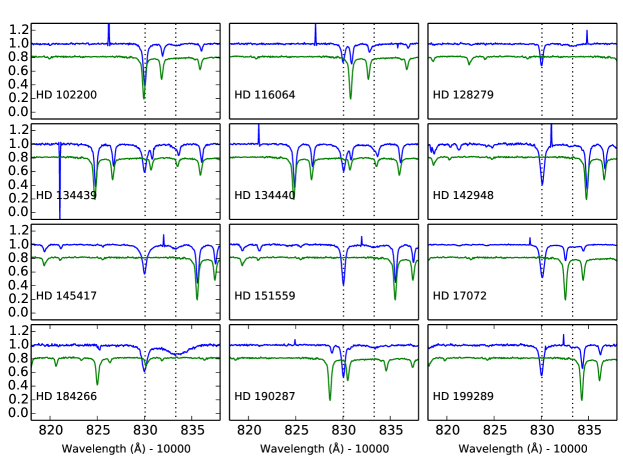
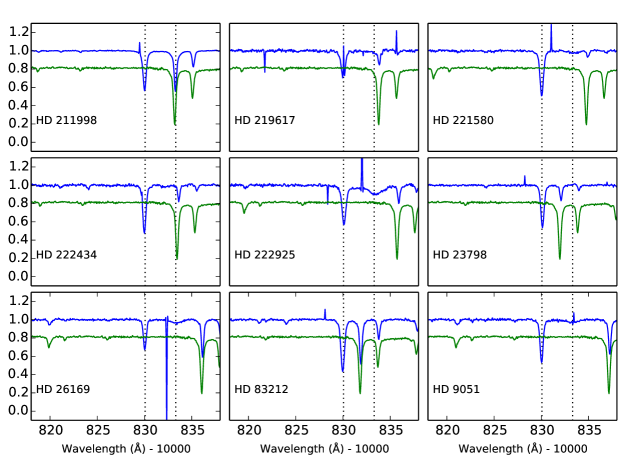
Telluric lines were identified based on the spectrum of the hot, fast rotating star HR 1996. The wavelength-calibrated spectrum of this star is shown in Figure A1 of the appendix, where the most prominent telluric lines (in the vacuum wavelength rest frame) are marked.
Figures A2, A3, A4 and A5 show all our CRIRES rest-frame spectra in the region of interest. For all the spectra, the normalization of the continuum was performed using the continuum task of IRAF. Our science targets are indicated by the top blue spectrum on each panel, while the green spectrum, shown for comparison purposes, corresponds to the telluric standard star shifted in wavelength to match the telluric features in the science target. The left and right dashed lines marked the positions of the Si I and He I lines, respectively.
3. Stellar parameters and chemical abundances
3.1. Stellar Parameters
| Reference Star | Group | (K) | |||
|---|---|---|---|---|---|
| HD 113083 | dwarfs and subgiants | 5800 | 4.35 | 1.20 | |
| HD 145417 | cool dwarfs | 4900 | 4.60 | 0.00 | |
| HD 111721 | red giant branch stars | 4990 | 2.60 | 1.35 |
Note. — Conservatively, we expect these parameters to be uncertain at the level of 100 K in , 0.1 in , and 0.05 dex in .
The fundamental atmospheric parameters of our stars () were determined using the conditions of relative excitation and ionization equilibrium for iron lines (Fe I and Fe II). The EWs of as many as possible of the iron lines employed by Ramírez et al. (2013) were measured by fitting Gaussian profiles to the observed spectral lines within IRAF’s task splot.
For each star, we started with a set of guess parameters (obtained from previous calculations found in the literature) and computed iron abundances using the curve-of-growth method on a line-by-line basis. Kurucz odfnew model atmospheres and the spectrum synthesis code MOOG were employed for these calculations. We then examined the correlations between relative iron abundance (with respect to a specific reference star, as explained below) and excitation potential as well as reduced EW (). We also examined the difference between mean iron abundance inferred from Fe I and Fe II lines separately. The initial set of parameters was then modified iteratively until the correlations disappeared and the Fe I and Fe II lines provided the same mean iron abundance. On average, 98 lines (80 Fe I and 18 Fe II) were used to derive the iron abundances. The minimum number of Fe transitions measured was 21 Fe I and 8 Fe II for HD 215801.
When using the excitation/ionization method described above, it is customary to use the Sun as the standard star. However, our sample is heterogeneous regarding spectral type and it also is biased toward very low metallicity. Employing the Sun as reference is not ideal due to the propagation of systematic uncertainties, which are very difficult to control in highly heterogeneous samples like ours. Thus, instead we adopted three different reference stars that are representative of the three main groups of targets that we have available: dwarf and subgiant stars, cool dwarf stars, and RGB stars. The three reference stars and their adopted stellar parameters are listed in Table 3.
For each of the reference stars we performed a relative analysis using the Sun as reference and adopting an absolute solar iron abundance of . Thus, while systematics still exist, they can be better controlled by investigating the parameters of the reference stars. The relative parameters within each group of stars are expected to be precise and internally consistent. In any case, the stars chosen as reference are all well-studied bright halo stars, and the parameters we derived using the Sun as reference are in reasonably good agreement with other previous and independent estimates. Conservatively, we expect these parameters to be uncertain at the level of 100 K in , 0.1 in , and 0.05 dex in .
We note that the reference stars are on the metal-rich side of the stellar parameter distribution of their respective samples. Strictly speaking, it would be better to employ reference objects with stellar parameters that are centered on the distributions of each sample. However, good reference stars at low metallicities are significantly less common than metal-rich ones and, while not ideal, our procedure is certainly superior to one where the Sun, a very metal-rich star in this context, is employed as the only reference star.
Our derived stellar parameters are listed in Table 1. The errors were computed by propagating the errors in the slopes of the iron abundance versus excitation potential and reduced EW added in quadrature with the errors due to the uncertainty in the mean iron abundances from Fe I and Fe II lines measured separately. For we also added in quadrature the standard error of the line-to-line dispersion.
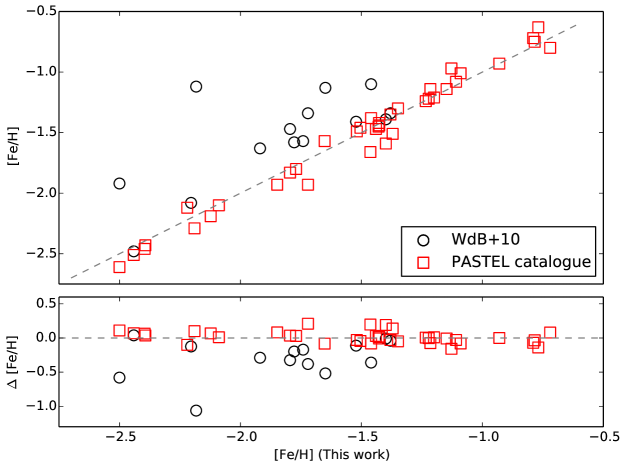
Figure 1 shows our metallicity measurements for the stars that have also been listed by WdB10 and the PASTEL catalog (Soubiran et al. 2010). The dashed line in the top panel corresponds to the 1:1 line, where practically all the stars with measurements from the PASTEL catalog lie. In the case of the stars with metallicity measurements in the study of WdB10, the differences are higher (0.3 dex). All the metallicities measured by those authors are higher than the ones measured in this work and in the PASTEL catalog.
| Equivalent Width | |||||||
|---|---|---|---|---|---|---|---|
| Wavelength | Species | CD-30 1121 | CD-62 1346 | HD 110621 | (Cont.) | ||
| (Å) | (eV) | (mÅ) | (mÅ) | (mÅ) | |||
| 7771.94 | 8.0 | 9.15 | 2.25 | 12.3 | 66.8 | 43.7 | |
| 7774.16 | 8.0 | 9.15 | 1.67 | 8.5 | 51.8 | 34.1 | |
| 7775.39 | 8.0 | 9.15 | 1.00 | 6.0 | 37.7 | 27.7 | |
| 4751.82 | 11.0 | 2.10 | -2.08 | ||||
| 4982.82 | 11.0 | 2.10 | -1.00 | ||||
| 5682.64 | 11.0 | 2.10 | -0.77 | 6.4 | 13.0 | 6.9 | |
| 5688.21 | 11.0 | 2.10 | -0.48 | 13.1 | 25.1 | 10.1 | |
| 6154.23 | 11.0 | 2.10 | -1.55 | ||||
| 6160.75 | 11.0 | 2.10 | -1.25 | 6.8 | |||
| 4730.04 | 12.0 | 4.34 | -2.39 | 8.6 | 24.3 | 7.2 | |
| 5711.09 | 12.0 | 4.34 | -1.73 | 27.8 | 41.9 | 19.7 | |
| 6318.72 | 12.0 | 5.10 | -1.95 | 5.1 | 11.3 | ||
Note. — (This table is available in its entirety in machine-readable form.)
The differences in metallicity between the measurements of WdB10 and the values derived in this work and the PASTEL catalog are propagated into the stellar parameters. For example, the stellar parameters of the star HD 181007 derived by WdB10 and the ones listed in the PASTEL catalog are in disagreement by more than 250 K for and 1.0 and 0.5 dex for and , respectively. More worrying cases include HD 186478 and HD 181743. For the former, WdB10 report while four studies included in PASTEL reveal a value closer to dex. In the case of HD 181743 the and values given by WdB10 are 1.1 and 0.2 dex lower, respectively, than most previously reported measurements, while the is in good agreement with the values reported by the PASTEL catalog.
Moreover, when comparing our values with those from the PASTEL catalog, we find an average difference of 0.010.09 dex. Our iron abundances have a typical error of the order of 0.05 dex, whereas a heterogeneous catalog like PASTEL is expected to have errors in the range 0.05–0.10 dex. Thus, the predicted error in the average difference quoted above should be between 0.07 and 0.11 dex, in good agreement with the observed value of 0.09 dex. In stark contrast, when the WdB10 data are compared to the PASTEL catalog, the average difference in is 0.310.26 dex. The large dispersion seen in this comparison, and the small one seen in our case, strongly suggest that the values from WdB10 are unreliable.
3.2. Elemental Abundances from the Optical Spectra
| Star | [Fe/H] | [O/Fe] | [Na/Fe] | [Mg/Fe] | [Al/Fe] | [Ca/Fe] | [Ba/Fe] | ||||||
|---|---|---|---|---|---|---|---|---|---|---|---|---|---|
| Kapteyn Group Stars | |||||||||||||
| CD-30 1121 | -1.919 | 0.33* | 0.07(3) | -0.15 | 0.06(2) | 0.23 | 0.06(3) | 0.25 | 0.08(9) | -0.08 | 0.10(3) | ||
| CD-62 1346 | -1.399 | 0.35 | 0.08(3) | 0.00 | 0.11(3) | 0.39 | 0.21(4) | 0.25 | 0.09(12) | 1.59 | 0.07(3) | ||
| HD 110621 | -1.522 | 0.42 | 0.09(3) | -0.05 | 0.08(2) | 0.29 | 0.08(3) | 0.34 | 0.09(10) | 0.05 | 0.09(3) | ||
| HD 111721 | -1.380 | 0.48 | 0.04 | 0.39 | 0.26 | 0.38 | 0.10 | ||||||
| HD 13979 | -2.441 | -0.21 | 0.09(1) | 0.43 | 0.10(3) | 0.29 | 0.11(7) | -0.50 | 0.26(3) | ||||
| HD 181007 | -1.721 | 0.43* | 0.07(3) | 0.15 | 0.12(6) | 0.35 | 0.09(3) | 0.33 | 0.07(13) | 0.30 | 0.05(3) | ||
| HD 181743 | -1.795 | 0.57* | 0.11(3) | -0.20 | 0.09(3) | 0.35 | 0.10(3) | 0.30 | 0.11(9) | -0.16 | 0.09(3) | ||
| HD 186478 | -2.500 | 0.72* | 0.09(2) | 0.11 | 0.08(2) | 0.45 | 0.11(3) | 0.37 | 0.09(12) | -0.34 | 0.10(3) | ||
| HD 188031 | -1.649 | 0.43* | 0.06(3) | -0.09 | 0.08(1) | 0.18 | 0.07(2) | 0.36 | 0.08(7) | -0.06 | 0.08(3) | ||
| HD 193242 | -1.778 | 0.55* | 0.07(3) | 0.01 | 0.09(3) | 0.37 | 0.08(3) | 0.13 | 0.07(1) | 0.35 | 0.08(14) | 0.02 | 0.09(3) |
| HD 208069 | -1.741 | 0.38* | 0.06(3) | -0.19 | 0.08(3) | 0.18 | 0.05(3) | 0.26 | 0.06(12) | -0.16 | 0.06(3) | ||
| HD 21022 | -2.204 | 0.59* | 0.06(3) | -0.03 | 0.05(2) | 0.42 | 0.10(3) | 0.31 | 0.07(10) | -0.08 | 0.09(3) | ||
| HD 215601 | -1.460 | 0.47 | 0.04(3) | 0.10 | 0.11(6) | 0.37 | 0.04(5) | 0.08 | 0.08(2) | 0.24 | 0.06(15) | -0.03 | 0.10(3) |
| HD 215801 | -2.183 | 0.45* | 0.09(3) | -0.14 | 0.08(1) | 0.20 | 0.06(2) | 0.46 | 0.08(8) | -0.38 | 0.10(3) | ||
| Cen Group Stars | |||||||||||||
| BD+02 3375 | -2.190 | 0.76* | 0.10(3) | 0.12 | 0.08(1) | 0.28 | 0.07(2) | 0.37 | 0.08(7) | -0.47 | 0.07(2) | ||
| CD-61 0282 | -1.234 | 0.44 | 0.07(3) | -0.20 | 0.12(2) | 0.26 | 0.09(3) | -0.02 | 0.08(2) | 0.23 | 0.08(11) | -0.04 | 0.08(3) |
| HD 113083 | -0.930 | 0.31 | 0.01 | 0.16 | -0.02 | 0.18 | 0.07 | ||||||
| HD 121004 | -0.784 | 0.54 | 0.04(3) | 0.15 | 0.07(6) | 0.33 | 0.06(2) | 0.32 | 0.04(4) | 0.29 | 0.06(15) | 0.03 | 0.04(3) |
| HD 140283 | -2.393 | 0.55* | 0.08(3) | 0.06 | 0.06(2) | 0.19 | 0.07(1) | 0.20 | 0.07(6) | -0.92 | 0.05(2) | ||
| HD 148816 | -0.790 | 0.45 | 0.04(3) | 0.19 | 0.06(6) | 0.33 | 0.07(4) | 0.22 | 0.06(5) | 0.23 | 0.05(14) | -0.09 | 0.06(3) |
| HD 193901 | -1.109 | 0.40 | 0.05(3) | -0.20 | 0.06(4) | 0.09 | 0.08(3) | 0.07 | 0.06(2) | 0.19 | 0.06(10) | -0.03 | 0.06(3) |
| HD 194598 | -1.148 | 0.36 | 0.04(3) | -0.03 | 0.06(3) | 0.14 | 0.09(4) | 0.21 | 0.06(13) | -0.05 | 0.04(3) | ||
| HD 3567 | -1.200 | 0.29 | 0.04(3) | -0.13 | 0.10(4) | 0.12 | 0.06(2) | 0.28 | 0.06(12) | 0.03 | 0.05(3) | ||
| HD 84937 | -2.089 | 0.53* | 0.08(3) | 0.20 | 0.09(1) | 0.33 | 0.08(9) | -0.20 | 0.18(2) | ||||
| Field Stars | |||||||||||||
| HD 102200 | -1.222 | 0.30 | 0.06(3) | -0.06 | 0.05(2) | 0.24 | 0.09(5) | 0.24 | 0.08(12) | -0.06 | 0.06(3) | ||
| HD 116064 | -1.848 | 0.50* | 0.07(3) | 0.13 | 0.13(3) | 0.30 | 0.07(2) | 0.55 | 0.08(6) | -0.23 | 0.07(3) | ||
| HD 128279 | -2.123 | 0.41* | 0.13(3) | -0.19 | 0.11(2) | 0.23 | 0.09(4) | 0.30 | 0.10(10) | -0.61 | 0.11(3) | ||
| HD 134439 | -1.440 | -0.39 | 0.07(4) | 0.02 | 0.07(2) | 0.15 | 0.07(15) | -0.25 | 0.09(3) | ||||
| HD 134440 | -1.426 | -0.38 | 0.08(3) | 0.03 | 0.09(2) | 0.16 | 0.07(15) | -0.23 | 0.08(3) | ||||
| HD 142948 | -0.720 | 0.38 | 0.05(3) | 0.25 | 0.09(6) | 0.41 | 0.08(4) | 0.38 | 0.06(5) | 0.22 | 0.06(15) | -0.13 | 0.05(3) |
| HD 145417 | -1.349 | 0.63 | 0.02 | 0.33 | 0.23 | 0.37 | 0.05 | ||||||
| HD 151559 | -0.769 | 0.17 | 0.05(3) | 0.18 | 0.07(6) | 0.21 | 0.05(4) | 0.20 | 0.09(5) | 0.17 | 0.06(15) | 0.07 | 0.05(3) |
| HD 17072 | -1.128 | 0.50 | 0.05(3) | 0.07 | 0.07(6) | 0.38 | 0.05(4) | 0.29 | 0.09(4) | 0.25 | 0.07(13) | 0.31 | 0.09(3) |
| HD 184266 | -1.463 | 0.51 | 0.11(3) | -0.01 | 0.10(2) | 0.34 | 0.12(2) | 0.28 | 0.08(11) | 0.24 | 0.32(3) | ||
| HD 190287 | -1.429 | 0.53 | 0.04(3) | 0.03 | 0.09(5) | 0.38 | 0.06(5) | 0.22 | 0.10(2) | 0.41 | 0.07(15) | 0.09 | 0.05(3) |
| HD 199289 | -1.090 | 0.52 | 0.05(3) | 0.11 | 0.15(5) | 0.33 | 0.06(4) | 0.17 | 0.06(3) | 0.25 | 0.06(13) | -0.09 | 0.06(3) |
| HD 211998 | -1.519 | 0.52 | 0.04(3) | 0.00 | 0.09(4) | 0.41 | 0.09(4) | 0.04 | 0.06(1) | 0.41 | 0.06(15) | -0.03 | 0.06(3) |
| HD 219617 | -1.427 | 0.41 | 0.06(3) | -0.11 | 0.06(2) | 0.18 | 0.08(3) | 0.23 | 0.06(9) | -0.15 | 0.06(3) | ||
| HD 221580 | -1.215 | 0.29 | 0.06(3) | 0.02 | 0.10(5) | 0.29 | 0.11(5) | 0.05 | 0.07(1) | 0.29 | 0.08(15) | 0.13 | 0.13(3) |
| HD 222434 | -1.770 | 0.42* | 0.05(3) | 0.02 | 0.09(5) | 0.40 | 0.05(3) | 0.08 | 0.24(2) | 0.29 | 0.06(14) | 0.05 | 0.07(3) |
| HD 222925 | -1.371 | 0.42 | 0.07(3) | 0.00 | 0.08(3) | 0.24 | 0.10(3) | 0.23 | 0.06(11) | 0.85 | 0.20(3) | ||
| HD 23798 | -2.220 | 0.67* | 0.10(3) | 0.16 | 0.11(3) | 0.51 | 0.07(4) | 0.11 | 0.07(1) | 0.35 | 0.08(12) | -0.31 | 0.06(3) |
| HD 26169 | -2.396 | 0.68* | 0.10(2) | 0.38 | 0.12(2) | 0.47 | 0.08(2) | 0.37 | 0.07(10) | -0.35 | 0.11(3) | ||
| HD 83212 | -1.504 | 0.36 | 0.05(3) | -0.01 | 0.07(6) | 0.42 | 0.06(4) | 0.14 | 0.08(4) | 0.24 | 0.06(14) | 0.11 | 0.08(3) |
| HD 9051 | -1.652 | 0.49* | 0.07(3) | -0.03 | 0.06(4) | 0.32 | 0.06(4) | 0.32 | 0.05(14) | 0.23 | 0.05(3) | ||
Note. — The number of lines used to derive the abundances of each element is listed in parenthesis. Starred [O/Fe] abundances have non-LTE corrections applied.
We searched for as many as possible of the spectral lines listed in Table 1 of Ramírez et al. (2011) and Table 4 of Ramírez et al. (2014) in order to measure chemical abundances of elements other than iron. Since that list was constructed for stars of solar metallicity, many of those lines are too weak in the spectra of our target stars. Thus, the line list was expanded with spectral lines listed in the studies by Nissen et al. (2002); Reddy et al. (2003); Neves et al. (2009), and Bensby et al. (2013). The first of these references provides a thorough and reliable list of lines for very metal-poor stars in general and the other three references, while made for studies of somewhat metal-rich stellar populations, include spectral lines that are also useful in the analysis of stars with effective temperatures and surface gravities significantly different from the solar values. On average, the number of transitions employed to derived the chemical abundances was three lines of each of the elements considered (Na I, Mg I, Al I, Ba II, and O I). For Ca I the number of lines employed was, on average, ten per star. The individual EW measurements are listed in Table 4.
With the stellar parameters listed in Table 1, we used the abfind driver of MOOG and Kurucz odfnew model atmospheres to derive elemental abundances for our sample stars. As for the stellar parameters, the absolute abundances of the reference stars were first computed using the Sun as reference. Then, we measured only relative abundances for the rest of our targets, using the appropriate reference star for each group. Table 5 presents the metallicity and the derived chemical abundances [X/Fe] for our target stars. The number of lines on which the quoted errors are based is indicated in parenthesis.
The sodium lines in the spectrum of HD 84937 were all found to have very low local S/N and in most cases the line was not even detected. Thus, no Na abundance is given for this star.
Abundances of Al are given only for a limited number of stars due to the difficulty in measuring the EWs of the very weak Al lines available in our optical spectra. In fact, in most of the cases where no Al abundance is reported in Table 5, the Al lines were not even detected.
Given the importance of the oxygen abundances for this work, and the fact that they were derived using the 777 nm O i triplet, which is known to be severely affected by departures from the LTE approximation, we made every effort to obtain as reliable as possible [O/Fe] values. We employed the grid of non-LTE corrections by Ramírez et al. (2007) to derive line-by-line non-LTE oxygen abundances of all stars more iron-rich than . This grid has a lower limit in metallicity of , but it has been shown to be reliable in extrapolations down to (see, for example, Ramírez et al. 2011, 2013). The non-LTE corrected oxygen abundances of our three reference stars were computed differentially with respect to the Sun. Then, relative oxygen abundances were calculated for the other stars differentially, each with respect to its corresponding reference star. Note that all our three reference stars have .
A significant fraction of our stars are more iron-poor than . For these objects, we employed LTE abundances to calculate oxygen abundances relative to their corresponding reference stars. However, for the reference stars, we adopted the non-LTE oxygen abundances derived as described above. This mixing of LTE and non-LTE oxygen abundances will certainly introduce a systematic error, but it will be somewhat mitigated by the fact that the calculations are done differentially for each star relative to another object of comparable atmospheric parameters. These “pseudo” non-LTE corrected oxygen abundances were adopted for the stars.
To test the reliability of our adopted oxygen abundances, we computed non-LTE corrections for all our stars using the grid by Fabbian et al. (2009), which includes the full range covered by our stars. Nevertheless, we also had to extrapolate this grid in order to apply it to our data. This is because nearly all the LTE abundances we derived are higher than the upper limit given in that grid. In any case, we noticed that the [O/Fe] versus relation that results using the grid by Fabbian et al. is similar in shape to that obtained using our adopted oxygen abundances, even at low metallicity. In fact, the most notable difference is a roughly constant offset of about +0.15 dex in [O/Fe] due to the fact that the oxygen abundances calculated using the grid by Fabbian et al. are systematically higher.
In a number of reliable elemental abundance studies, some of which employ oxygen features other than the 777 nm triplet (e.g., Asplund & García Pérez 2001; Sneden & Primas 2001; Meléndez & Barbuy 2002; Meléndez et al. 2006), the [O/Fe] abundance ratios of very metal-poor stars are seen to lie in a plateau at a level of about +0.5, similar to what we obtained with our adopted oxygen abundances. The [O/Fe] values inferred using the grid of Fabbian et al., on the other hand, would place the [O/Fe] plateau at a significantly higher level (). For this reason, we prefer to adopt the oxygen abundances as described before, and not those computed with the Fabbian et al. grid. The comparison, however, shows that in a relative sense, the two methods provide similar results. This means that stars that are too oxygen-poor or too oxygen-rich relative to the bulk of halo stars could be equally identified using either set of [O/Fe] results.
| Star | S/N (a)(a)S/N calculated as the median value of the S/N pixel by pixel. | EW1 | EW2 | Notes |
|---|---|---|---|---|
| (mÅ) | (mÅ) | |||
| Kapteyn Group Stars | ||||
| CD-30 1121 | 129 | 71.43.0 | 59.42.9 | |
| CD-62 1346 | 114 | 91.24.4 | 50.03.8 | |
| HD 110621 | 130 | 25.91.8 | Blend, the line cannot be measured manually | |
| HD 111721 | 142 | 48.82.5 | 40.72.4 | |
| HD 13979 | 161 | Blend with a telluric line | ||
| HD 181007 | 93 | 38.23.8 | 43.27.6 | Blend with a telluric line |
| HD 181743 | 84 | Blend with a telluric line | ||
| HD 186478 | 79 | 3.81.5 | Upper limit | |
| HD 188031 | 71 | 18.53.0 | 10.92.3 | |
| HD 193242 | 83 | 41.44.4 | 49.04.6 | |
| HD 208069 | 125 | 62.73.5 | 50.13.1 | |
| HD 21022 | 163 | 12.31.4 | Blend, the line cannot be measured manually | |
| HD 215601 | 112 | Not detected | ||
| HD 215801 | 148 | 30.92.5 | 10.72.0 | |
| Cen Group Stars | ||||
| BD+02 3375 | 81 | 23.33.2 | 23.12.9 | |
| CD-61 0282 | 140 | 21.61.7 | 21.81.9 | |
| HD 113083 | 137 | Not detected | ||
| HD 121004 | 149 | 40.62.4 | 13.31.8 | |
| HD 140283 | 162 | 6.2 1.3 | 10.01.9 | Upper limit |
| HD 148816 | 171 | 35.12.5 | 23.12.3 | |
| HD 193901 | 123 | 31.92.7 | 31.52.8 | |
| HD 194598 | 104 | 31.13.5 | 34.43.7 | |
| HD 3567 | 118 | 36.93.5 | 31.32.8 | |
| HD 84937 | 127 | 27.62.8 | 25.42.9 | |
| Field Stars | ||||
| HD 102200 | 129 | 25.92.6 | 26.32.9 | |
| HD 116064 | 125 | 11.81.8 | Blend, the line cannot be measured manually | |
| HD 128279 | 136 | 44.92.7 | 51.83.2 | |
| HD 134439 | 147 | 52.91.4 | Blend, the line cannot be measured manually | |
| HD 134440 | 147 | 34.71.6 | Blend, the line cannot be measured manually | |
| HD 142948 | 118 | 18.22.4 | 17.02.3 | |
| HD 145417 | 176 | 72.62.1 | 53.71.9 | |
| HD 151559 | 139 | 60.63.6 | 46.12.9 | |
| HD 17072 | 294 | 73.81.7 | Blend, the line cannot be measured manually | |
| HD 184266 | 99 | 442.86.1 | 302.55.3 | |
| HD 190287 | 136 | 44.52.8 | 49.82.8 | |
| HD 199289 | 116 | 10.71.9 | 14.52.2 | |
| HD 211998 | 521 | Blend with a telluric line | ||
| HD 219617 | 91 | Not detected | ||
| HD 221580 | 142 | 51.63.2 | 37.62.8 | |
| HD 222434 | 110 | 1.32.2 | Upper limit | |
| HD 222925 | 110 | 231.45.1 | 215.24.5 | |
| HD 23798 | 161 | Emission? | ||
| HD 26169 | 151 | 34.62.3 | 51.62.5 | |
| HD 83212 | 156 | Blend with a telluric line | ||
| HD 9051 | 129 | 31.72.0 | 46.23.7 | |
The 777 nm oxygen triplet lines were not detected in the spectra of HD 134439, HD 134440, and HD 13979. Therefore, no oxygen abundances are reported for these three stars.
Later in this paper, we use the elemental abundances derived from the optical spectra to perform a chemical tagging experiment, i.e., to attempt to associate our samples to known stellar populations for which previous chemical composition studies exist. Most of these previous works have adopted a pure LTE approach or used the oxygen forbidden lines, which are formed under LTE conditions, to derive [O/H]. Therefore, for our chemical tagging experiment, the impact of non-LTE effects on the abundances is not as important as being able to perform a fair comparison instead.
3.3. He I 10830 Å line
The EW of the He I 10830 Å line in our program stars was measured with the IRAF’s task splot. We use the deblend option when a telluric line appears contaminating the wings or the continuum around the line, which occurs in six of our program stars (four stars of the Kapteyn/ Cen group sample and two of the field sample). For another star of the field comparison sample, HD 211998, a strong telluric line is at exactly the same position as the He line, preventing us from saying anything about it.
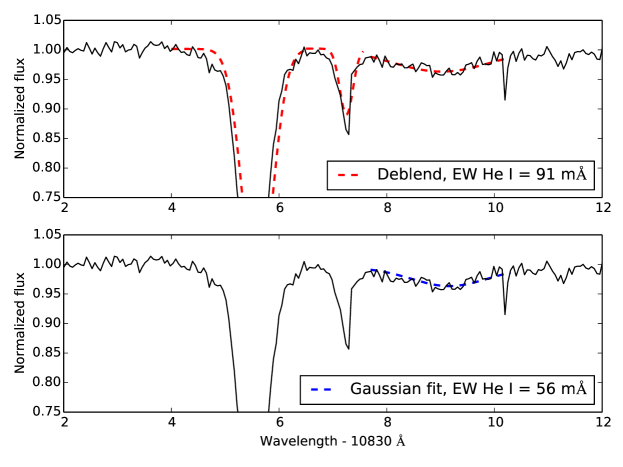
We also measured, when possible, the EW of the line directly using the Gaussian fit of splot, as a validation test for our measured values. However, when telluric lines are near the He I line, the position of the wings is not easy to identify and the line sometimes could be asymmetric, leading to a less accurate Gaussian fit. Figure 2 shows the fit using both procedures for the He I line of CD-621 346. From the spectrum, the wings of the He I line are difficult to identify and the direct Gaussian fit gives a lower value than the deblending option, which takes into account the fact that part of the wings of one line and its neighbor can overlap.
The EW measurements derived using the deblending task, EW1, and the direct Gaussian fit, EW2, are listed in Table 6, where we also list the S/N achieved by our CRIRES observations at the location of the He I line. Errors in EW were calculated using the formula of Cayrel (1988), which uses the FWHM of the line, the S/N of the spectrum, and the dispersion of the instrument (5.2 nm pix-1 for the setup used in our CRIRES observations). A minimum value of 10 mÅ as lower limit is used to separate stars that show detectable helium in their spectra from those that do not. A similar cut-off was found by Dupree et al. (2011) for the spectra of the stars where the helium line is not apparent.
In most of the spectra, there is a good agreement between the two EW values measured as mentioned before. The same behavior was found by Smith et al. (2014), comparing the EWs of the He I line in giants of M13. Nonetheless, in some cases the difference is non-negligible and not explained by the listed errors, mainly because the line is in blends, and the Gaussian fit cannot take into account the part of the spectrum that is missed in the blended wing. Because of that, we adopt hereafter the EWs measured using the deblending option.
Although the He I 10830Å line has not been measured frequently in a systematic way, there are nine stars from our sample that have published EWs, which are listed in Table 3.3 together with our derived EW values from CRIRES spectra. A relatively good agreement is found for five stars; HD 194598 is the only star that has two measurements in the literature and both values agree with our derived value. However, there are some stars that have important differences, which might be due to an intrinsic variability of the line depending on the chromospheric activity. This is further discussed in Section 4.2.
| Star | EW (CRIRES) | EW (Lit.) | Reference |
|---|---|---|---|
| (mÅ) | (mÅ) | ||
| Kapteyn group stars | |||
| HD 111721 | 48.8 2.5 | 48.4 | 1 |
| Cen-group stars | |||
| HD 140283 | 6.2 1.3 | 32.5 | 2 |
| HD 148816 | 31.1 3.5 | 30.1 | 2 |
| HD 194598 | 31.1 3.5 | 30.5, 26.7 | 2,3 f |
| HD 193901 | 31.9 2.7 | 40.5 | 2 |
| HD 3567 | 36.9 3.5 | 15.1 | 3 |
| HD 84937 | 27.6 2.8 | 27.2 | 3 |
| Field stars | |||
| HD 219617 | not detected | 25.3 | 2 |
| HD 83212 | not detected | in emission | 1 |
4. Chemical abundance patterns
4.1. O–Na and Mg–Al
One of the main distinguishing chemical patterns of GC stars is an anticorrelated behavior of O and Na abundances, with a fraction of the stars showing O–Na levels similar to field stars, but another important fraction showing depleted O and enhanced Na (Carretta et al. 2009a; Johnson & Pilachowski 2010; Gratton et al. 2012, and references therein). The latter group of stars has been associated to a second stellar generation that formed out of material enriched by the hotter branches of hydrogen burning that took place in stars of the first generation (Ventura et al. 2001; Gratton et al. 2004). Therefore, if the Galactic field contains a fraction of stars originating from GCs, one would expect to find some of these O-poor, Na-rich second-generation stars as well (e.g., Altmann et al. 2005; Ramírez et al. 2012). Applying this to the context of the present work, therefore, if the Kapteyn group were tidal debris from Centauri, then an unambiguous indication that this is the case would be the identification among the group’s stars of some with this particular O–Na pattern.
Figure 3 shows the O and Na abundances for our target stars from the Kapteyn group (red triangles), Cen group (blue diamonds) and field stars (green circles). The O and Na abundances of GC stars (open gray circles from Carretta et al. 2009a) and giant stars from Centauri (open magenta squares from Marino et al. 2011) are included. The two star symbols correspond to the two GC second-generation stars in the field found by Ramírez et al. (2012).
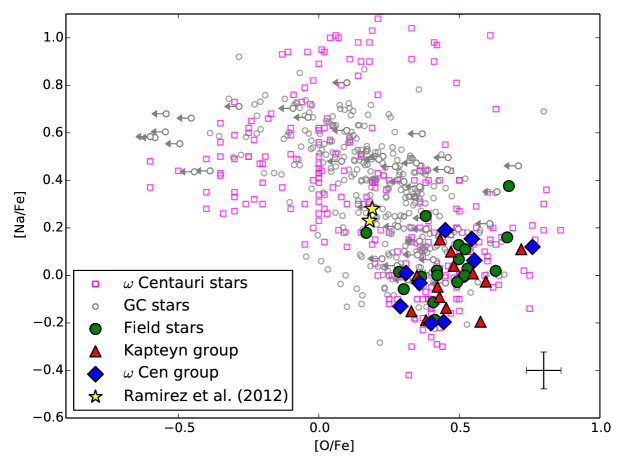
The oxygen abundances of the stars from both the Kapteyn and Cen groups are indistinguishable from those of the stars of the field sample, which are located at the base of the GC Na–O anticorrelation. HD 151559 appears as the only star from our whole sample that could be a second-generation star from a GC in the field. This star has the lowest O abundance and the third most enhanced Na abundance of our full sample.
Centauri is known to harbor at least three different populations, with mean metallicities at –1.7, –1.2 and –0.8 dex (Johnson & Pilachowski 2010). These populations are consistent with the multiple MSs found through its color–magnitude diagram, namely the red, blue, and anomalous MS (as defined by Bedin et al. 2004; Bellini et al. 2010). Spectroscopic analyses of RGB stars from these three different populations by Marino et al. (2011) and Gratton et al. (2011) reveal that the metal-poor and metal-intermediate populations present a marked O–Na anticorrelation and at least two different generations of stars (primordial and intermediate, i.e., the first and second generations). It is important to note that this conclusion does not depend on the specific bins adopted to separate the three metallicity populations, thus discarding the possibility that the O–Na anticorrelation seen in both populations is due to the overlapping of the populations. Only the metal-rich population (at dex) is practically all composed of second-generation stars and, contrary to the others, it actually shows a slight O–Na correlation (Gratton et al. 2011). In particular, Gratton et al. (2011) show that there is an extreme component of second-generation GC stars (as defined by Carretta et al. 2009a) that is consistent with being O-poor, Na-rich, and also He-rich (up to dex) compared to stars of an intermediate component that are also O-poor and Na-rich, but with almost the same He abundance as the primordial generation. This first generation is mostly indistinguishable from the halo field stars with the same metallicity. Similar to monometallic GCs, Centauri has a prominent fraction of second-generation stars (Johnson & Pilachowski 2010). According to the criteria to separate the primordial, intermediate, and extreme components in GCs developed by Carretta et al. (2009a) and the O and Na abundances reported by Johnson & Pilachowski (2010), the fractions of stars belonging to the primordial, intermediate, and extreme components in Centauri are 42%, 44%, and 14%, respectively, in agreement with the measured fractions in monometallic GCs (Johnson & Pilachowski 2010). Nonetheless, Centauri has a prominent fraction of extreme component stars in its metal-rich population, even reaching 81% of that population, the greatest fraction found in any GC so far (Johnson & Pilachowski 2010).
Motivated by this, our target stars were divided into three different metallicity ranges, in order to better visualize whether second-generation stars are present among the Kapteyn or the Cen groups. Figure 4 shows the O–Na plane for the three different metallicity regimes, i.e., metal-poor, ; metal-intermediate, ; and metal-rich, . In each panel, Centauri’s RGB stars from the catalogue of Johnson & Pilachowski (2010) are also plotted, according to the different metallicity bins.
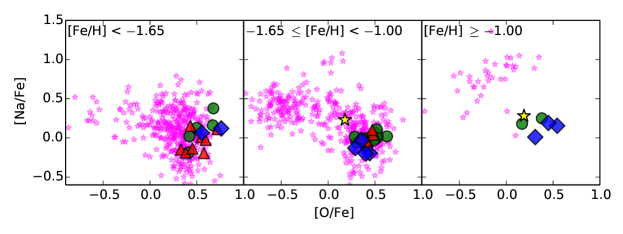
From the metallicity distribution of the Kapteyn group stars, most of them (9 out 14 stars) are metal-poor, while five are in the metal-intermediate range and there are no stars in the metal-rich group. Figure 4 shows there is no evidence of an O–Na anticorrelation in the two groups. The same result is found for the stars in the Cen group, which are indistinguishable from the Galactic halo stars in each metallicity bin.
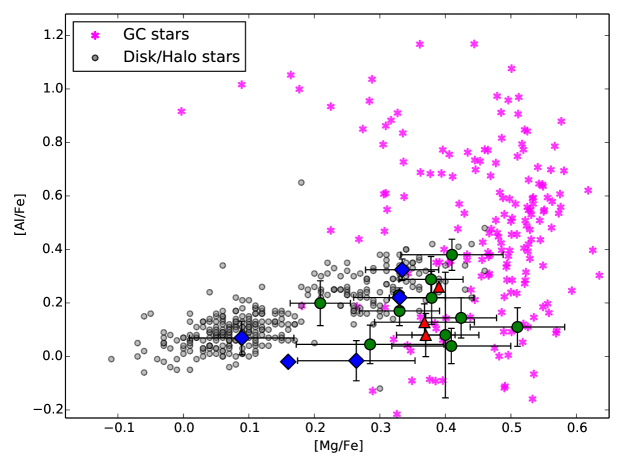
GC stars also follow a Mg–Al anticorrelation (Carretta et al. 2009a), which is the result of high-temperature H-burning chains. In contrast, disk and halo stars of the MW are mostly confined to nearly solar Al and Mg abundances (Reddy et al. 2003, 2006). Therefore, if stars in the Kapteyn and Cen groups showed that kind of behavior, it would be suggestive of a GC origin.
Aluminum lines are weak or undetectable for most of our target stars. Figure 5 shows the stars for which we could measure an abundance for this species –only three from the Kapteyn group and five from the Cen one– preventing us from tracing any possible Mg–Al pattern. All these stars, nevertheless, have similar abundances to those found for the field star samples.
Could it be that our sample of Kapteyn group stars just so happens to contain only first-generation stars stripped from Centauri? As in other GCs, the second-generation stars in Centauri are more centrally concentrated than the first-generation (see Bellini et al. 2009, and references therein). Therefore, it can be expected that a larger fraction of the stripped stars from the cluster belong to the first generation. However, as we explain immediately below, if all our Kapteyn and Cen group stars originated in Centauri, it is unlikely that all of them could be at the same time from the first stellar generation of the cluster.
Considering that the fraction of second-generation GC stars in the Galactic halo is of the order of 2-3% (Martell et al. 2011; Ramírez et al. 2012), the models of Vesperini et al. (2010) allow us to estimate that at most 50% of the Galactic halo stars come from GCs. Nonetheless, if we consider that our stars are typical Galactic halo stars, from our observations, we have one out of 45 ( 2.2%) stars with Na and O abundances consistent with GC second-generation stars, compatible with the 2-3% fraction expected.
Based on the concentrations derived by Gratton et al. (2011), the number of first- and second-generation stars from the different populations could be estimated out to 10 arcmin, corresponding to about a fourth of Centauri’s tidal radius. According to Table 1 and Figure 9 of their paper, the mix of stars at 10 arcmin from the center should be composed of 35%, 60%, and 5% from the metal-poor, metal-intermediate, and metal-rich populations, respectively. Within the metal-poor and metal-intermediate populations, 30% and 40% of the stars should correspond to second-generation stars. Therefore, assuming the stripped regions of Centauri contained a similar mix of populations, if the Kapteyn and Cen groups were part of Centauri’s tidal debris, they should contain approximately 30% of second-generation stars: four and three stars in the Kapteyn and Cen groups, respectively. Although crude, this fraction of stars from the second-generation that could be stripped from Centauri is at odds with our derived chemical abundances, which are consistent with only first-generation stars.
4.2. Helium
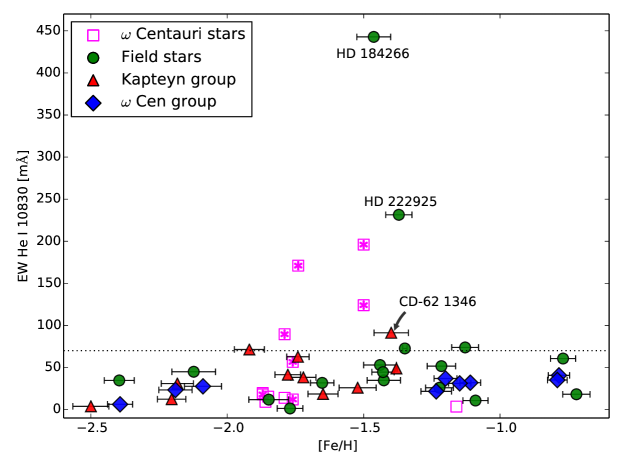
Figure 6 shows the EW of the He I line for all the stars in our program as a function of metallicity. Centauri’s red giants observed by Dupree et al. (2011) are also plotted as open magenta squares, with the starred symbols indicating those stars with enhanced Al and Na abundances. The dotted line at 70 mÅ marks the typical maximum value found in non-active metal-poor stars from the Galactic field (Takeda & Takada-Hidai 2011; Smith et al. 2012). All the stars in the Cen group have EW below 70 mÅ, making the group indistinguishable from the sample of comparison field stars. Stars of the Kapteyn group also appear with typical EWs, except CD-62 1346 which has a somewhat large EW of 91.2 mÅ. There is no correlation between the EW of the He line and the metallicity, as seen for the metal-intermediate group of stars in Centauri (Dupree et al. 2011).
The Centauri giants with starred symbols in Figure 6 are second-generation star candidates based on their Na and Al abundances (Dupree et al. 2011). These authors found a better correlation between the detection of the chromospheric He I line and the enhanced Na–Al abundances than as a function of the metallicity. For stars in the Kapteyn and Cen groups, the measured He I EWs are generally smaller than those of the secong-generation stars of Dupree et al. (2011) with seemingly enhanced helium. As discussed earlier, they also have O, Na, Mg, and Al abundances normal among field stars, which would be consistent with their He I EWs, assuming the latter to be indicative of helium content. For red giants in Messier 13, a GC with no significant helium enhancement measured ( 0.04), Smith et al. (2014) found several He I EW values lower than 40 mÅ, similar to the distribution found for the Kapteyn and Cen groups.
Among the control sample of field stars, HD 222925 and HD 184266 strongly deviate from all the stars in all of our samples. HD 184266 has an EW of the order of magnitude of those found in active cool stars (see Sanz-Forcada & Dupree 2008), but no previous studies reported a measurement for the helium line for this star. HD 222925 has a He I EW about 5-6 times larger than the average value for the remaining stars in our field sample and, moreover, it has an enhanced [Ba/Fe] abundance (Fig. 7) that makes it an intriguing target in its own right (see Section 4.5).
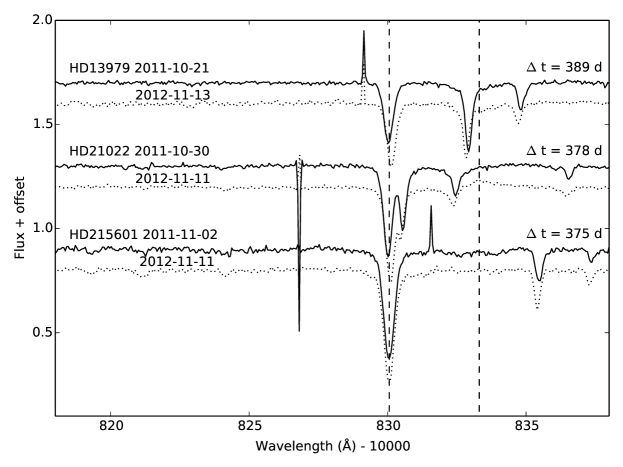
Given that the He I 10830 Å line is associated with activity in cool stars, we also explore its variability among a few of the stars in our samples using our own data obtained for another program, as well as some measurements available in the literature. CRIRES spectra were obtained for HD 13979, HD 21022, and HD 215601 about a year after the observations reported in the present work. Using the same reduction process, the spectrum around 10830 Å was extracted, and in Figure 8 we show the normalized spectra at the two epochs for the three stars. Both HD 13979 and HD 215601 show an indistinguishable helium line shape between the two observations. In contrast, the He I line in HD 21022 changes from being not detected on the first run (EW smaller than 10 mÅ) to appearing in emission a year later, with an EW of 50 mÅ.
Finally, we found differences in the He I EW measurements in the literature for two stars in our Cen group (see Table 3.3). For HD 3567, Smith et al. (2012) determine an EW that is about half of that derived here, while for HD 140283, Takeda & Takada-Hidai (2011) report an EW five times larger than ours. For HD 83212, from our field sample, while our data show He I non-detections, while observations by Dupree et al. (2009) show the line in emission, with an EW of 43.6 mÅ.
In summary, out of twelve stars in our full sample with multiple measurements of the He I 10830 Å line, we find that four present significant variability between separate epochs. This suggests that the line should at least be used with caution as an abundance indicator.
4.3. Barium
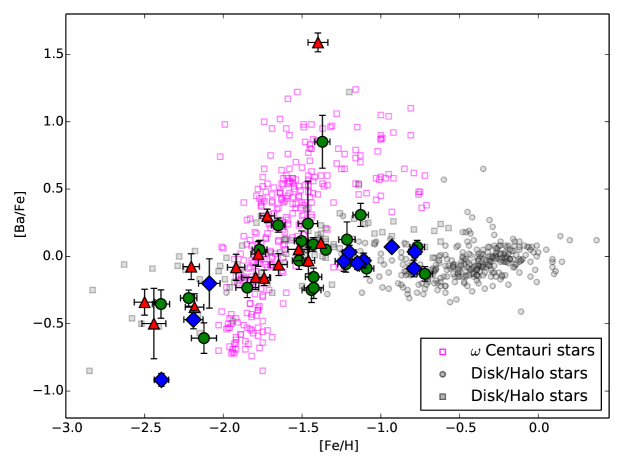
Barium is one of the neutron-capture elements. It is the product of the s-process that takes place during the thermal pulses of AGB stars. Therefore, the barium abundance is a proxy for measuring the s-process contribution in a stellar system. Centauri has a unique [Ba/Fe]–[Fe/H] distribution that does not follow the expected distribution of MW or dwarf spheroidal (dSph) galaxy stars (e.g., Geisler et al. 2007; Marino et al. 2011). For the most metal-rich population (between [Fe/H] dex), Centauri’s stars have an extreme overabundance of barium, [Ba/Fe] 0.7 dex, while the metal-poor stars experience a sharp increase in [Ba/Fe] with [Fe/H] between and dex. This is the result of the high contribution of AGB stars to the chemical enrichment process that occurs between the formation of the metal-poor and metal-intermediate components of the cluster (Marino et al. 2011). To date, only Majewski et al. (2012) and Casey et al. (2014a) seem to have identified stars that appear to be consistent with an origin in Centauri based on this unique Ba abundance pattern.
Figure 7 shows the [Ba/Fe]–[Fe/H] distribution for our target stars, in comparison with MW and Centauri stars from previous studies. MW stars predominantly have Ba abundances near the solar value, typical of the Galactic halo population. As a whole, neither Kapteyn nor Cen group stars follow a trend like the one found for Centauri stars, which puts into question any possible association between them.
However, there are two stars with a marked overabundance of Ba within our samples, compared to the other target stars with the same metallicity. CD-62 1346, a target from the Kapteyn group, has the most extreme Ba abundance of our sample, [Ba/Fe] 1.6 dex (WdB10 find [Ba/Fe] = 0.95 for this star, also the largest value for their sample). [Ba/Fe] determinations for our Kapteyn group sample range from to 0.3 dex with an average value of [Ba/Fe] = , if CD-62 1346 is excluded. The [Ba/Fe] abundances derived by WdB10 have an average value of 0.21 dex, and 0.16 dex when excluding CD-62 1346, both higher than the determinations in the present work. However, the trend with metallicity even in WdB10 is still inconsistent with that of Centauri.
The other star with an overabundance of Ba is HD 222925, but it belongs to our field control sample and we discuss its case further in Section 4.5.
4.4. -Elements and the Present-day Dwarf Galaxies
Centauri is thought to be the remnant nucleus of a completely disrupted dwarf galaxy (Dinescu et al. 1999; Bekki & Freeman 2003; Bekki & Norris 2006). Based on that, it seems necessary to address the possibility that the Kapteyn and Cen groups originated in the main body of the defunct progenitor galaxy instead of the GC itself.
Carretta et al. (2010a) compared detailed chemical abundances for Centauri RGB stars and the stars in the Sagittarius dSph galaxy and its nuclear GC, M54. Based on metallicities, the authors concluded that Centauri’s stars resemble the metallicity distribution found for M54 and Sagittarius dSph together. In particular, the metal-rich population of Centauri is consistent with the extent of the metallicity distribution of Sagittarius itself. Moreover, the -element abundance for the surrounding nucleus of Sagittarius is similar to what is found for the metal-rich stars in Centauri while M54 shows [/Fe] abundances in agreement with the metal-poor and metal-intermediate populations of Centauri.
The abundances of three alpha-elements were obtained from our optical spectra (O, Mg, and Ca), so we can compare the -element abundances of our target stars with those measured for stars in dSph galaxies. Since most of the -abundances in the literature are computed from those of Mg and Ca, we use these elements in our own determinations, leaving O aside.
Figure 9 shows the [/Fe] abundance versus metallicity for our target stars, MW stars, and stars from the Sagittarius, Sculptor, and Carina dSph galaxies. The metallicity distributions of both the Kapteyn and Cen groups do not overlap with that of Sagittarius. As the GC Centauri appears consistent with the metal-rich stars ( dex) in Sagittarius, it appears straightforward to discard the idea that the Kapteyn and Cen groups’ stars have an origin in the defunct host galaxy of Centauri, if such an extinct host was comparable to what we see today in Sagittarius.
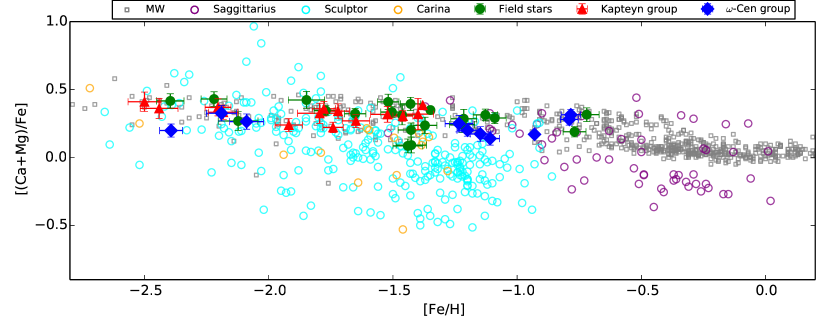
For Carina and Sculptor, and although they cover the same metallicity range as our target stars, the range of [/Fe] variation for stars in those dSphs is very broad and incompatible with our stars. In fact, Kapteyn and Cen groups’ stars follow, at least qualitatively, the same trend as MW field halo stars. At dex, halo stars (Venn et al. 2004) have an average [/Fe] abundance of 0.30 with a dispersion of 0.12 dex. The comparison field stars in our sample have a very similar average [/Fe] abundance, of 0.30 dex with = 0.10 dex. For Kapteyn group stars, the same average is 0.33 dex ( = 0.06 dex), completely compatible with MW halo stars. Stars from the Cen group, on the other hand, have an average [/Fe] = 0.23 ( = 0.06 dex), still consistent with the MW halo given the dispersion in both distributions, but less so than observed for the Kapteyn group.
Based on the run of -element abundances, the stars of the Kapteyn group do not resemble the present-day dSph galaxies close to the MW, including the case of the Sagittarius dwarf, thus rejecting Centauri’s parent galaxy as the origin for this moving group. The same can be said for the stars in the Cen group, but the somewhat lower overall [/Fe] among these stars might be indicative of something different and does not allow us to discard completely an origin in a dSph galaxy.
4.5. Chemically peculiar stars
Even though we do not find our samples of the Kapteyn and Cen groups to contain any second-generation stars, there are a few stars that appear special on their own, and we examine them separately here.
HD 151559, from our field sample, appears as a Na-rich and relatively O-poor star, compared with the other stars in our sample. This is one of the most metal-rich stars in the sample, with , consistent with the metal-rich population found in Centauri, which is mainly composed of second-generation stars. In fact, HD 151559 falls in the same location of Figure 3 and of the right panel of Figure 4 where Ramírez et al. (2012) identified the first field dwarfs with O and Na abundances consistent with second-generation stars from GCs. One star out of 45 with both O and Na measurements amounts to just in between the 2-3% of second-generation stars in the Galactic field recently found by Martell et al. (2011) and Ramírez et al. (2012). The He I EW measured for this star is below the maximum usually found in the literature for field stars. However, it is slightly larger than what is found for dwarfs and subdwarfs with dex (Takeda & Takada-Hidai 2011). The magnesium and aluminum abundances for HD 151559 (Figure 5) are typical of MW halo stars. However, as discussed earlier, this alone does not say anything about its origin as a first- or second-generation star, since the Mg–Al anticorrelation is evident only in a few massive GCs, like Centauri, while other clusters with known different stellar generations are practically indistinguishable from the MW halo in its Mg and Al abundance content (see Figure 6 of Carretta et al. 2009b). It is the location of HD 151559 in the Na–O diagram that makes this star a firm candidate for a second-generation GC star in the Galactic halo.
CD-62 1346 and HD 222925 have an overabundance of Ba and resemble the Ba-rich stars typical of Centauri. However, even though their large He I EWs would be expected for helium-enhanced stars, their Na and O abundances are similar to field stars, which is not consistent with being second-generation stars from Centauri (Gratton et al. 2011; Marino et al. 2011). Therefore, the large He I EW in these cases might be due to chromospheric activity on those stars.
On the other hand, the high [Ba/Fe] values for these stars could be the result of mass transfer from an unseen AGB companion which changes the surface abundance of these stars. The most straightforward test for this possibility is to search for RV variations in time. For CD-62 1346 a RV of 125.74 0.35 km s-1 is found based on our optical spectrum, which is in excellent agreement with the value listed by Beers et al. (2000) of 127.0 10 km s-1. Despite CD-62 1346 not showing RV variations, its and s-process element abundances are consistent with a CH-rich Ba-strong star in a binary system (see Pereira et al. 2012, and references therein). Therefore, the barium overabundance of this star is not representative of the Kapteyn group. HD 222925 is listed with = 45 10 km s-1 by Beers et al. while we found 38.64 0.36 km s-1. Due to the large uncertainties of the Beers et al. (2000) measurement, it is hard to conclude anything for this star. The abundances of yttrium and technetium are desirable to reject mass transfer from an AGB companion (Busso et al. 2001; Uttenthaler et al. 2011; Casey et al. 2014b, and references therein), but this kind of analysis is beyond the scope of this study.
Finally, HD 184266 has the largest value ( 400 mÅ) for the He I EW of the whole sample. This star from our field sample is indistinguishable from the field halo stars with the same metallicity in its O, Na and Ba abundances. From visual inspection of its optical spectrum obtained with MIKE, the core of the chromospheric Ca II lines is not found in emission, undermining the possibility of chromospheric activity as being responsible for the high He I EW (see Pasquini et al. 2011). The same is found for HD 222925, the star with the second largest He I EW ( 230 mÅ), also from our field star sample. A more detailed chromospheric/activity study of these stars is needed in order to determine whether these EWs are consistent with enhanced helium abundances777Although HD 222925 appears as an Ap star in the literature (Houk & Cowley 1975, and the subsequent compilations of HD stars), the study of Renson & Manfroid (2009) classified it as an F8 star..
5. Kinematics
| Star | Distance | ||||||
|---|---|---|---|---|---|---|---|
| (pc) | (km s-1) | (km s-1) | (km s-1) | (km s-1) | (km s-1) | (km s-1) | |
| Kapteyn Group Stars | |||||||
| CD-30 1121 | 842 | 12 | 6 | -191 | 33 | -28 | 12 |
| CD-62 1346 | 243 | -78 | 4 | -149 | 22 | -34 | 8 |
| HD 110621 | 191 | 47 | 34 | -285 | 22 | 55 | 4 |
| HD 111721 | 188 | 69 | 17 | -322 | 63 | -163 | 37 |
| HD 13979 | 444 | -21 | 5 | -120 | 23 | -27 | 3 |
| HD 181007 | 410 | -92 | 17 | -317 | 64 | -55 | 13 |
| HD 181743 | 120 | 53 | 18 | -449 | 90 | -80 | 15 |
| HD 186478 | 1003 | -173 | 27 | -363 | 76 | -65 | 14 |
| HD 188031 | 181 | 174 | 12 | -351 | 73 | 7 | 14 |
| HD 193242 | 326 | 42 | 10 | -185 | 29 | 46 | 5 |
| HD 208069 | 257 | 162 | 15 | -282 | 51 | 20 | 23 |
| HD 21022 | 1285 | -31 | 14 | -300 | 51 | 9 | 21 |
| HD 215601 | 263 | 11 | 1 | -194 | 39 | 10 | 6 |
| HD 215801 | 150 | 16 | 4 | -198 | 43 | 123 | 8 |
| Cen group Stars | |||||||
| BD+02 3375 | 147 | 362 | 7 | -263 | 19 | 129 | 48 |
| CD-61 0282 | 122 | -325 | 53 | -316 | 41 | 31 | 41 |
| HD 113083 | 40 | -55 | 13 | -215 | 14 | 112 | 6 |
| HD 121004 | 53 | -85 | 18 | -241 | 15 | 102 | 6 |
| HD 140283 | 26 | 180 | 10 | -104 | 24 | -25 | 12 |
| HD 148816 | 29 | -60 | 18 | -185 | 35 | -56 | 7 |
| HD 193901 | 54 | 150 | 4 | -285 | 47 | -103 | 39 |
| HD 194598 | 61 | 59 | 15 | -280 | 19 | -33 | 22 |
| HD 3567 | 99 | -138 | 24 | -219 | 42 | -31 | 17 |
| HD 84937 | 86 | -251 | 47 | -250 | 52 | 0 | 1 |
| Field Stars | |||||||
| HD 102200 | 94 | -106 | 8 | -136 | 1 | 11 | 8 |
| HD 116064 | 87 | 163 | 51 | -261 | 33 | 138 | 15 |
| HD 128279 | 133 | -7 | 11 | -65 | 21 | -214 | 37 |
| HD 134439 | 32 | -318 | 13 | -547 | 97 | -84 | 54 |
| HD 134440 | 34 | -322 | 13 | -577 | 103 | -101 | 57 |
| HD 142948 | 131 | -22 | 3 | -32 | 4 | -1 | 2 |
| HD 145417 | 15 | 46 | 13 | -94 | 19 | -24 | 6 |
| HD 151559 | 265 | -23 | 1 | 21 | 4 | 39 | 6 |
| HD 17072 | 38 | -19 | 1 | -45 | 2 | -31 | 1 |
| HD 184266 | 54 | 299 | 1 | -160 | 7 | 58 | 10 |
| HD 190287 | 142 | -145 | 2 | -95 | 23 | -67 | 1 |
| HD 199289 | 49 | 27 | 7 | -58 | 13 | -15 | 5 |
| HD 211998 | 30 | 138 | 33 | -129 | 24 | -61 | 9 |
| HD 219617 | 58 | -278 | 53 | -225 | 47 | -37 | 6 |
| HD 221580 | 160 | 60 | 13 | -71 | 16 | 18 | 1 |
| HD 222434 | 1120 | -108 | 19 | -214 | 44 | 17 | 5 |
| HD 222925 | 115 | 69 | 12 | -57 | 16 | 46 | 2 |
| HD 23798 | 995 | 57 | 7 | -105 | 14 | -5 | 12 |
| HD 26169 | 351 | 196 | 39 | -111 | 29 | 119 | 18 |
| HD 83212 | 563 | 19 | 2 | -119 | 6 | -15 | 13 |
| HD 9051 | 485 | 51 | 15 | -96 | 21 | 94 | 3 |
The Kapteyn moving group was originally selected on the basis of kinematics (proper motions and Galactic velocities), consistent with retrograde Galactic orbits (Eggen 1977). Meanwhile, the Cen group was kinematically selected by Meza et al. (2005) considering its broad, symmetric, double-peaked distribution of Galactocentric RVs and low vertical velocities consistent with the expectations for tidal debris from accreted satellite galaxies.
Despite the fact that all our targets have Hipparcos trigonometric parallax measurements, the adopted distances were determined based on the photometric relations derived by Beers et al. (2000). Hipparcos distance estimates were discarded because most of our targets are distant stars, hence its parallax measurements are very inaccurate, with relative errors larger than 15%.
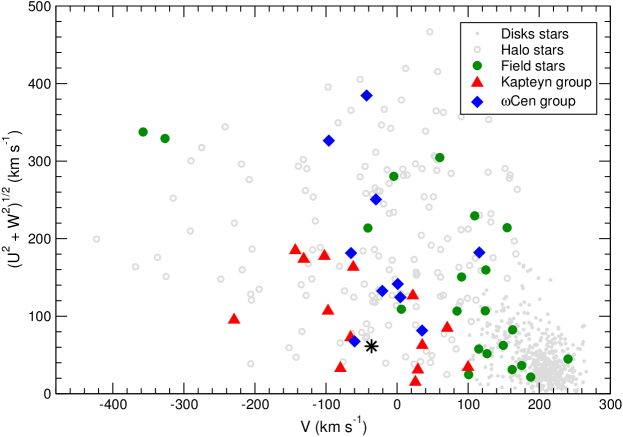
Beers et al. (2000) provide relations for the -band absolute magnitudes, based on the stellar type (e.g., giants, dwarfs, AGB stars), which are linear functions of the metallicity and dereddened color of each star. The stellar types of our stars were determined spectroscopically from our optical spectra, and the metallicity values adopted were those derived in the present work (see Table 1). The colors and the color excess were adopted from the catalogs of Beers et al. (2000) and Gratton et al. (2003). The derived distances are presented in Column 2 of Table 8.
The galactic space velocities were calculated using these distances, our derived RVs from the optical spectra, and the tabulated proper motions measured by van Leeuwen (2007). Table 8 shows the galactic velocities , where is defined as positive toward the Galactic anticenter, is in the direction of the Sun’s rotation, and points toward the north Galactic pole. The velocities were corrected for the solar motion in the LSR, adopting = from Dehnen & Binney (1998). The position and motion of the Sun were also corrected, adopting = 8.0 kpc and = 220 km s-1. The errors listed for the Galactic velocities in Table 8 were determined by error propagation, adopting an error of 20% for the distances (mean errors of the photometric distances derived by Beers et al. 2000), using the formal errors for the proper motions as listed by van Leeuwen (2007), and our derived errors for the RVs.
Figure 10 shows the Toomre diagram for stars from the Kapteyn and Cen groups. For comparison, we also show halo stars (open gray circles) and disk stars (gray dots) from Venn et al. (2004). All stars from both groups are more probably associated with the halo population.
Following Meza et al. (2005), we choose to analyze the Galactocentric radial -velocity distribution of Kapteyn and Cen group stars because relatively symmetric, double-peaked Galactic RV distributions are an expected sign of a past accretion event. This simple signature does not rely on the computation of energies or other dynamical variables, which can introduce unnecessary complications or problems of interpretation. WdB10 consider the angular momentum–energy plane to select the members of the Kapteyn group that are kinematically coherent, within 1, with the theoretical prediction of Dinescu (2002) for Centauri candidate stars in the halo. We prefer not to use this approach since it is strongly dependent on the distance errors, the adopted LSR, and a largely subjective decision on how far from the present Centauri orbital elements to allow candidate stars. Figure 11 shows the vertical versus radial velocity for stars in the Kapteyn (red circles) and Cen (blue circles) groups. This figure also shows metal-poor halo stars with angular momentum kpc km s-1 from the catalog of Beers et al. (2000). The U distribution of the 14 stars from the Kapteyn group (red dashed-line histogram, multiplied by four for clarity) does not differ significantly from that of the stars in the Beers et al. compilation (gray solid-line histogram). This argues against a common origin of the Kapteyn group and the accretion of the Centauri parent object. In the case of the Cen group, the U distribution of the ten stars observed (blue solid-line histogram, multiplied by five) is somewhat different. Instead of having a peak at = 0 km s-1, the distribution presents peaks at positive and negative values, consistent with the expected U-velocity distribution for accreted stars in the Galaxy (Meza et al. 2005). Clearly, this signal is low, but still suggestive of an extragalactic origin for the Cen group, as previously claimed by Meza et al. (2005).
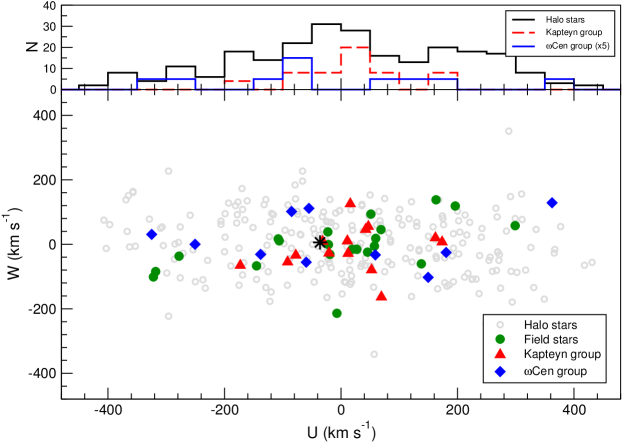
6. Conclusions
Based on newly determined chemical abundances of 14 stars belonging to the Kapteyn moving group, we find no evidence that this group could be identified as tidal debris from Centauri, as claimed elsewhere. Neither does the kinematically selected Cen group show any chemical signatures resembling the abundance patterns seen among Centauri’s stars.
First, stars in both groups have O and Na abundances indistinguishable from the field halo stars, and there is no evidence for an anticorrelation between O and Na, as expected for GC stars. The same applies to the Mg and Al abundances. If the Kapteyn and Cen moving groups are stripped stars from Centauri, four and three second-generation stars, respectively, are expected to be in our sample. Based on the absence of second-generation chemical abundances for the stars in the Kapteyn and Cen groups, we discard a possible connection between the two moving groups and Centauri.
Second, stars in the Kapteyn group have a mean value of [Ba/Fe] = dex (excluding CD-62 1346, the most Ba-rich star in the sample), consistent with the mean barium abundance of disk and halo stars. Moreover, the specific trend between Ba and metallicity seen in Centauri’s stars is not followed by either the Kapteyn group or the Cen group. The barium abundances are consistent with field stars, contrary to the Centauri tidal debris candidate stars found by Majewski et al. (2012).
Third, stars in the Kapteyn and Cen groups have EW values for the chromospheric He I 10830 Å line that are indistinguishable from non-active field stars. Thus there is no hint of helium enhancement among the Kapteyn group stars, which would have been a very suggestive link with the helium-enhanced second-generation stars that Centauri hosts (Dupree et al. 2011; Dupree & Avrett 2013, and references therein). We were able to track non-negligible levels of variability of the He I 10830 Å line for a small number of our targets, which suggests that its use as helium abundance indicator should be treated with caution.
Fourth, the kinematic analysis of the -velocity distribution of the Kapteyn group does not support the accretion scenario. As Meza et al. (2005) pointed out, tidal debris from satellite galaxies are expected to show a bimodal distribution of velocities, which is not seen in the Kapteyn group. A bimodal, symmetric distribution of velocities can be identified among the stars in the Cen group, still allowing these stars as to be considered as candidates to be accreted onto the MW in the past.
It thus may appear that the only possibility remaining for the Kapteyn group to still be associated to Centauri’s parent system is that all the stars in our sample were first-generation stars selectively stripped from the cluster (i.e., the primordial component, which is indistinguishable from the halo field stars at a given metallicity). However this possibility is unlikely (see Section 4.1). Even assuming that this is the case, the Ba– pattern rejects this possible connection, since even first-generation stars in Centauri are different from the MW halo field stars in their barium content (see Section 4.3).
Based on all of the above, we conclude that neither the Kapteyn group nor the Cen group consists of stars stripped from Centauri, as suggested elsewhere (Meza et al. 2005; Wylie-de Boer et al. 2010). Our chemical study is not consistent with stars in either of these groups, when considered as a group, having an origin in any GC, as their chemical abundances are indistinguishable from the MW halo stars.
Finally, the -element abundances of the Kapteyn group strongly resemble the abundances found for MW halo stars. dSph galaxies have lower values of [/Fe] compared to our Galaxy, which is not seen in any of the stars in the Kapteyn group. Our measurements therefore do not support the idea that this moving group could originate in the defunct galaxy progenitor of Centauri, but rather reinforce the hypothesis that those stars are chemically indistinguishable from the field MW halo stars.
The Cen group, in contrast, have slightly lower [/Fe] abundances, when compared to the MW stars in the same range of metallicity, just like stars in dSph galaxies. Therefore, some of the stars in this group could have originated in a progenitor that was accreted in the MW. Moreover, the Cen group stars could remain as a coherent group because their -velocity distribution is different from what is observed in the MW halo.
References
- Altmann et al. (2005) Altmann, M., Catelan, M., & Zoccali, M. 2005, A&A, 439, L5
- Asplund & García Pérez (2001) Asplund, M. & García Pérez, A. E. 2001, A&A, 372, 601
- Bedin et al. (2004) Bedin, L. R., Piotto, G., Anderson, J., et al. 2004, ApJ, 605, L125
- Beers et al. (2000) Beers, T. C., Chiba, M., Yoshii, Y., et al. 2000, AJ, 119, 2866
- Bekki & Freeman (2003) Bekki, K. & Freeman, K. C. 2003, MNRAS, 346, L11
- Bekki & Norris (2006) Bekki, K. & Norris, J. E. 2006, ApJ, 637, L109
- Bellini et al. (2010) Bellini, A., Bedin, L. R., Piotto, G., et al. 2010, AJ, 140, 631
- Bellini et al. (2009) Bellini, A., Piotto, G., Bedin, L. R., et al. 2009, A&A, 507, 1393
- Belokurov et al. (2006) Belokurov, V., Evans, N. W., Irwin, M. J., Hewett, P. C., & Wilkinson, M. I. 2006, ApJ, 637, L29
- Bensby et al. (2013) Bensby, T., Yee, J. C., Feltzing, S., et al. 2013, A&A, 549, A147
- Breckinridge & Hall (1973) Breckinridge, J. B. & Hall, D. N. B. 1973, Sol. Phys., 28, 15
- Busso et al. (2001) Busso, M., Gallino, R., Lambert, D. L., Travaglio, C., & Smith, V. V. 2001, ApJ, 557, 802
- Carretta et al. (2009a) Carretta, E., Bragaglia, A., Gratton, R., & Lucatello, S. 2009a, A&A, 505, 139
- Carretta et al. (2007) Carretta, E., Bragaglia, A., Gratton, R. G., et al. 2007, A&A, 464, 939
- Carretta et al. (2010a) Carretta, E., Bragaglia, A., Gratton, R. G., et al. 2010a, ApJ, 714, L7
- Carretta et al. (2009b) Carretta, E., Bragaglia, A., Gratton, R. G., et al. 2009b, A&A, 505, 117
- Carretta et al. (2010b) Carretta, E., Bragaglia, A., Gratton, R. G., et al. 2010b, A&A, 516, A55
- Casey et al. (2014a) Casey, A. R., Keller, S. C., Alves-Brito, A., et al. 2014a, MNRAS, 443, 828
- Casey et al. (2014b) Casey, A. R., Keller, S. C., Da Costa, G., Frebel, A., & Maunder, E. 2014b, ApJ, 784, 19
- Cayrel (1988) Cayrel, R. 1988, in IAU Symposium, Vol. 132, The Impact of Very High S/N Spectroscopy on Stellar Physics, ed. G. Cayrel de Strobel & M. Spite, 345
- Chen et al. (2000) Chen, Y. Q., Nissen, P. E., Zhao, G., Zhang, H. W., & Benoni, T. 2000, A&As, 141, 491
- D’Antona et al. (2005) D’Antona, F., Bellazzini, M., Caloi, V., et al. 2005, ApJ, 631, 868
- Dehnen & Binney (1998) Dehnen, W. & Binney, J. J. 1998, MNRAS, 298, 387
- Dinescu (2002) Dinescu, D. I. 2002, in Astronomical Society of the Pacific Conference Series, Vol. 265, Omega Centauri, A Unique Window into Astrophysics, ed. F. van Leeuwen, J. D. Hughes, & G. Piotto, 365
- Dinescu et al. (1999) Dinescu, D. I., Girard, T. M., & van Altena, W. F. 1999, AJ, 117, 1792
- Dupree & Avrett (2013) Dupree, A. K. & Avrett, E. H. 2013, ApJ, 773, L28
- Dupree et al. (2009) Dupree, A. K., Smith, G. H., & Strader, J. 2009, AJ, 138, 1485
- Dupree et al. (2011) Dupree, A. K., Strader, J., & Smith, G. H. 2011, ApJ, 728, 155
- Edlén (1953) Edlén, O. J. 1953, J. Opt. Soc. Am., 43, 339
- Eggen (1977) Eggen, O. J. 1977, ApJ, 215, 812
- Eggen (1978) Eggen, O. J. 1978, ApJ, 221, 881
- Eggen (1996) Eggen, O. J. 1996, AJ, 112, 1595
- Fabbian et al. (2009) Fabbian, D., Asplund, M., Barklem, P. S., Carlsson, M., & Kiselman, D. 2009, A&A, 500, 1221
- Freeman & Bland-Hawthorn (2002) Freeman, K. & Bland-Hawthorn, J. 2002, ARA&A, 40, 487
- Freeman (1993) Freeman, K. C. 1993, in Astronomical Society of the Pacific Conference Series, Vol. 48, The Globular Cluster-Galaxy Connection, ed. G. H. Smith & J. P. Brodie, 27
- Geisler et al. (2005) Geisler, D., Smith, V. V., Wallerstein, G., Gonzalez, G., & Charbonnel, C. 2005, AJ, 129, 1428
- Geisler et al. (2007) Geisler, D., Wallerstein, G., Smith, V. V., & Casetti-Dinescu, D. I. 2007, PASP, 119, 939
- Gratton et al. (2004) Gratton, R., Sneden, C., & Carretta, E. 2004, ARA&A, 42, 385
- Gratton et al. (2012) Gratton, R. G., Carretta, E., & Bragaglia, A. 2012, A&ARv, 20, 50
- Gratton et al. (2003) Gratton, R. G., Carretta, E., Claudi, R., Lucatello, S., & Barbieri, M. 2003, A&A, 404, 187
- Gratton et al. (2011) Gratton, R. G., Johnson, C. I., Lucatello, S., D’Orazi, V., & Pilachowski, C. 2011, A&A, 534, A72
- Hinkle et al. (1995) Hinkle, K., Wallace, L., & Livingston, W. 1995, PASP, 107, 1042
- Houk & Cowley (1975) Houk, N. & Cowley, A. P. 1975, University of Michigan Catalogue of two-dimensional spectral types for the HD stars. Volume I. Declinations -90_ to -53_f0.
- Ibata et al. (1994) Ibata, R. A., Gilmore, G., & Irwin, M. J. 1994, Nature, 370, 194
- Ibata et al. (1995) Ibata, R. A., Gilmore, G., & Irwin, M. J. 1995, MNRAS, 277, 781
- Ishigaki et al. (2013) Ishigaki, M. N., Aoki, W., & Chiba, M. 2013, ApJ, 771, 67
- Johnson & Pilachowski (2010) Johnson, C. I. & Pilachowski, C. A. 2010, ApJ, 722, 1373
- Kaeufl et al. (2004) Kaeufl, H.-U., Ballester, P., Biereichel, P., et al. 2004, in Society of Photo-Optical Instrumentation Engineers (SPIE) Conference Series, Vol. 5492, Ground-based Instrumentation for Astronomy, ed. A. F. M. Moorwood & M. Iye, 1218–1227
- Kirby et al. (2009) Kirby, E. N., Guhathakurta, P., Bolte, M., Sneden, C., & Geha, M. C. 2009, ApJ, 705, 328
- Koch et al. (2008) Koch, A., Grebel, E. K., Gilmore, G. F., et al. 2008, AJ, 135, 1580
- Lee et al. (2009) Lee, J.-W., Kang, Y.-W., Lee, J., & Lee, Y.-W. 2009, Nature, 462, 480
- Majewski et al. (2012) Majewski, S. R., Nidever, D. L., Smith, V. V., et al. 2012, ApJ, 747, L37
- Majewski et al. (2003) Majewski, S. R., Skrutskie, M. F., Weinberg, M. D., & Ostheimer, J. C. 2003, ApJ, 599, 1082
- Marino et al. (2011) Marino, A. F., Milone, A. P., Piotto, G., et al. 2011, ApJ, 731, 64
- Marino et al. (2014) Marino, A. F., Milone, A. P., Przybilla, N., et al. 2014, MNRAS, 437, 1609
- Martell et al. (2011) Martell, S. L., Smolinski, J. P., Beers, T. C., & Grebel, E. K. 2011, A&A, 534, A136
- Martínez-Delgado et al. (2012) Martínez-Delgado, D., Romanowsky, A. J., Gabany, R. J., et al. 2012, ApJ, 748, L24
- Meléndez & Barbuy (2002) Meléndez, J. & Barbuy, B. 2002, ApJ, 575, 474
- Meléndez et al. (2006) Meléndez, J., Shchukina, N. G., Vasiljeva, I. E., & Ramírez, I. 2006, ApJ, 642, 1082
- Meza et al. (2005) Meza, A., Navarro, J. F., Abadi, M. G., & Steinmetz, M. 2005, MNRAS, 359, 93
- Milone (2015) Milone, A. P. 2015, MNRAS, 446, 1672
- Monaco et al. (2005) Monaco, L., Bellazzini, M., Bonifacio, P., et al. 2005, A&A, 441, 141
- Mucciarelli et al. (2014) Mucciarelli, A., Lovisi, L., Lanzoni, B., & Ferraro, F. R. 2014, ApJ, 786, 14
- Navarro et al. (2004) Navarro, J. F., Helmi, A., & Freeman, K. C. 2004, ApJ, 601, L43
- Neves et al. (2009) Neves, V., Santos, N. C., Sousa, S. G., Correia, A. C. M., & Israelian, G. 2009, A&A, 497, 563
- Nidever et al. (2002) Nidever, D. L., Marcy, G. W., Butler, R. P., Fischer, D. A., & Vogt, S. S. 2002, ApJs, 141, 503
- Nissen et al. (2002) Nissen, P. E., Primas, F., Asplund, M., & Lambert, D. L. 2002, A&A, 390, 235
- Norris (2004) Norris, J. E. 2004, ApJ, 612, L25
- Norris & Da Costa (1995) Norris, J. E. & Da Costa, G. S. 1995, ApJ, 447, 680
- Obrien & Lambert (1986) Obrien, Jr., G. T. & Lambert, D. L. 1986, ApJs, 62, 899
- Pasquini et al. (2011) Pasquini, L., Mauas, P., Käufl, H. U., & Cacciari, C. 2011, A&A, 531, A35
- Peck & Reeder (1972) Peck, E. R. & Reeder, K. 1972, J. Opt. Soc. Am., 62, 958
- Pereira et al. (2012) Pereira, C. B., Jilinski, E., Drake, N. A., et al. 2012, A&A, 543, A58
- Piotto et al. (2007) Piotto, G., Bedin, L. R., Anderson, J., et al. 2007, ApJ, 661, L53
- Piotto et al. (2005) Piotto, G., Villanova, S., Bedin, L. R., et al. 2005, ApJ, 621, 777
- Ramírez et al. (2007) Ramírez, I., Allende Prieto, C., & Lambert, D. L. 2007, A&A, 465, 271
- Ramírez et al. (2013) Ramírez, I., Allende Prieto, C., & Lambert, D. L. 2013, ApJ, 764, 78
- Ramírez et al. (2014) Ramírez, I., Bajkova, A. T., Bobylev, V. V., et al. 2014, ApJ, 787, 154
- Ramírez et al. (2012) Ramírez, I., Meléndez, J., & Chanamé, J. 2012, ApJ, 757, 164
- Ramírez et al. (2011) Ramírez, I., Meléndez, J., Cornejo, D., Roederer, I. U., & Fish, J. R. 2011, ApJ, 740, 76
- Reddy et al. (2006) Reddy, B. E., Lambert, D. L., & Allende Prieto, C. 2006, MNRAS, 367, 1329
- Reddy et al. (2003) Reddy, B. E., Tomkin, J., Lambert, D. L., & Allende Prieto, C. 2003, MNRAS, 340, 304
- Renson & Manfroid (2009) Renson, P. & Manfroid, J. 2009, A&A, 498, 961
- Sanz-Forcada & Dupree (2008) Sanz-Forcada, J. & Dupree, A. K. 2008, A&A, 488, 715
- Sbordone et al. (2007) Sbordone, L., Bonifacio, P., Buonanno, R., et al. 2007, A&A, 465, 815
- Searle & Zinn (1978) Searle, L. & Zinn, R. 1978, ApJ, 225, 357
- Shetrone et al. (2003) Shetrone, M., Venn, K. A., Tolstoy, E., et al. 2003, AJ, 125, 684
- Smith et al. (2014) Smith, G., Dupree, A., & Strader, J. 2014, ArXiv e-prints
- Smith et al. (2012) Smith, G. H., Dupree, A. K., & Strader, J. 2012, PASP, 124, 1252
- Sneden & Primas (2001) Sneden, C. & Primas, F. 2001, NewA Rev., 45, 513
- Soubiran et al. (2013) Soubiran, C., Jasniewicz, G., Chemin, L., et al. 2013, A&A, 552, A64
- Soubiran et al. (2010) Soubiran, C., Le Campion, J.-F., Cayrel de Strobel, G., & Caillo, A. 2010, A&A, 515, A111
- Takeda & Takada-Hidai (2011) Takeda, Y. & Takada-Hidai, M. 2011, PASJ, 63, 547
- Tolstoy et al. (2009) Tolstoy, E., Hill, V., & Tosi, M. 2009, ARA&A, 47, 371
- Uttenthaler et al. (2011) Uttenthaler, S., van Stiphout, K., Voet, K., et al. 2011, A&A, 531, A88
- Valcarce et al. (2014) Valcarce, A. A. R., Catelan, M., Alonso-García, J., Cortés, C., & De Medeiros, J. R. 2014, ApJ, 782, 85
- van Leeuwen (2007) van Leeuwen, F. 2007, A&A, 474, 653
- Venn et al. (2004) Venn, K. A., Irwin, M., Shetrone, M. D., et al. 2004, AJ, 128, 1177
- Ventura et al. (2001) Ventura, P., D’Antona, F., Mazzitelli, I., & Gratton, R. 2001, ApJ, 550, L65
- Vesperini et al. (2010) Vesperini, E., McMillan, S. L. W., D’Antona, F., & D’Ercole, A. 2010, ApJ, 718, L112
- Villanova et al. (2012) Villanova, S., Geisler, D., Piotto, G., & Gratton, R. G. 2012, ApJ, 748, 62
- Villanova et al. (2009) Villanova, S., Piotto, G., & Gratton, R. G. 2009, A&A, 499, 755
- Vivas et al. (2001) Vivas, A. K., Zinn, R., Andrews, P., et al. 2001, ApJ, 554, L33
- Wylie-de Boer et al. (2010) Wylie-de Boer, E., Freeman, K., & Williams, M. 2010, AJ, 139, 636
Figure A1 shows the wavelength-calibrated spectrum of the hot, fast rotating HR 1996. Figures A2–A5 show all our CRIRES rest-frame spectra in the region of interest.