Multiple Broken Symmetries in Striped La2-xBaxCuO4
detected by the
Field Symmetric Nernst Effect
Abstract
We report on a thermoelectric investigation of the stripe and superconducting phases of the cuprate La2-xBaxCuO4 near the doping known to host stable stripes. We use the doping and magnetic field dependence of field-symmetric Nernst effect features to delineate the phenomenology of these phases. Our measurements are consistent with prior reports of time-reversal symmetry breaking signatures above the superconducting , and crucially detect a sharp, robust, field-invariant peak at the stripe charge order temperature, . Our observations suggest the onset of a nontrivial charge ordered phase at , and the subsequent presence of spontaneously generated vortices over a broad temperature range before the emergence of bulk superconductivity in LBCO.
A Introduction
There is increasing evidence of a fundamental connection between the phenomenology of unconventional superconductivity and the proliferation of broken symmetry phases in hole-doped cupratesNorman (2011); Lee (2014); Taillefer (2009). On one hand, numerous studies indicate the existence of electronic phases that break translational symmetry, viz. spin/charge density wavesSebastian et al. (2009); Wise et al. (2008) and stripesEmery et al. (1999), and are expected to compete with or enhance superconductivity. On the other, several reports of the onset of broken time-reversal and point-group symmetries have recently emergedHe et al. (2011); Xia et al. (2008), complicating the picture. A case in point is the prototypical cuprate La2-xBaxCuO4, wherein the spin and charge of the doped holes together form a -periodic static stripe arrangementEmery et al. (1999); Fujita et al. (2004) – strongest at – where bulk superconductivity is strongly suppressedHücker et al. (2011). Recent reports suggest that striped LBCO may also host other broken symmetries, with potential ramifications on the extensively debated superconducting mechanism in these materialsLi et al. (2011); Karapetyan et al. (2012, 2014); Hosur et al. (2013).
A set of recent studies on LBCO have challenged the notion that its phase diagram is well understood. First, a recent transport study by Li et al.Li et al. (2011) has detected a finite Nernst effect signal at zero magnetic field well above , interpreted as evidence of spontaneous vortex generation due to time-reversal symmetry breaking (TRSB). This was corroborated by polar Kerr effect measurements of Karapetyan et al.Karapetyan et al. (2012). However, subsequent theoretical work showed that these observations could also be consistent with a non-trivial point-group symmetry breaking (PSB) induced by stripe charge orderHosur et al. (2013); Karapetyan et al. (2014), wherein the stacking of stripes in the plane can be modulated in a nontrivial fashion along the axis to break inversion and mirror symmetries. It is worth noting that the onset of stripe order plays central role in both scenarios – the TRSB is driven by the onset of superconducting correlations along individual stripes, whereas the PSB is ascribed to the long-range ordering of stripes. Several prior observations such as that of a pairing gap and resistivity drop above Valla et al. (2006); He et al. (2008); Li et al. (2007a); Tranquada et al. (2008) support the presence of superconducting correlations, corroborating the TRSB picture. Meanwhile, some predictions ensuing from PSB dealing with the varation of Kerr angle with crystal orientation have also been verifiedKarapetyan et al. (2014); however this interpretation remains a subject of controversyOrenstein and Moore (2013); Chakravarty (2014); Armitage (2014); Lee (2014); Hosur et al. (2015). Importantly, neither scenario provides a fully satisfactory explanation of recent experiments – the sign of the TRSB signal cannot be “trained” by external magnetic fields, while PSB cannot explain the Nernst effect profile, observed to peak near the onset of superconductivityLi et al. (2011).
Here we perform a high-resolution thermoelectric investigation of near- LBCO, and use the doping and field dependence of the observed features to delineate their behavior and understand their origin. Our high-resolution Nernst effect measurements show TRSB signatures consistent with prior reportsLi et al. (2011), and further detect a sharp, field independent peak at the stripe charge ordering temperature, . Our observations suggest the onset of a nontrivial stripe charge ordered phase at , and the subsequent presence of spontaneously generated vortices over a broad temperature range before the onset of bulk superconductivity in LBCO.
B Methods and Results
Single crystals of La2-xBaxCuO4 (near ) were grown using the recently developed laser-diode-heated floating zone method, which enables an exceptionally high degree of sample homogeneityIto et al. (2013). The samples were cut along the crystal axes into rectangular bars for plane transport measurements. For thermoelectric measurements, the typical temperature gradient applied was K/mm. Further experimental methods are detailed in SOM .
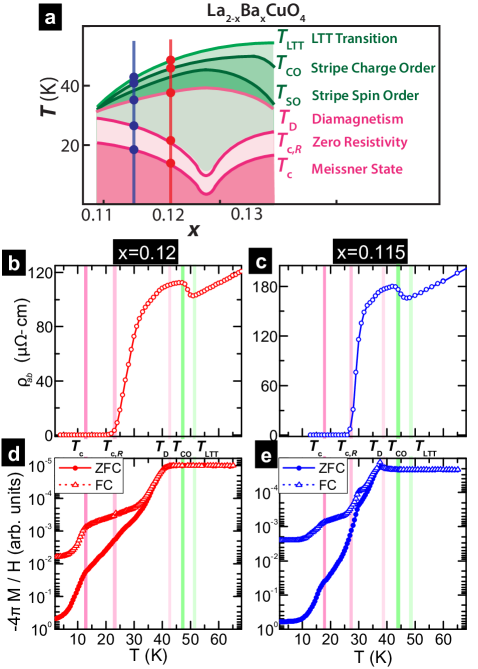
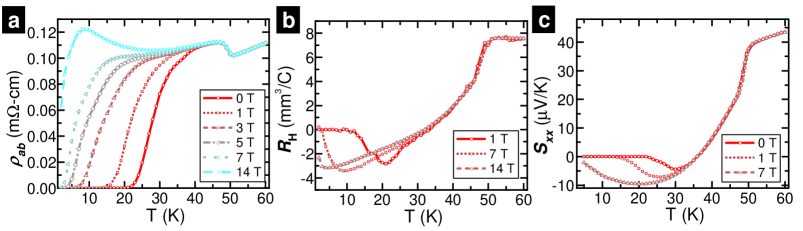
The phase diagram of hole-doped LBCO () has been extensively characterized by a combination of scattering, transport and thermodynamic measurements, establishing the signatures of structural and electronic transitions in such measurementsLi et al. (2007a); Hücker et al. (2008, 2010, 2011); Li et al. (2011). Our measurements of longitudinal resistivity (, Fig. 1(b-c)) and out-of-plane magnetization (, Fig. 1(d-e)) show the series of transitions that our LBCO samples undergo when cooled below 80 K (schematic Fig. 1(a)): (1) structural transition from an orthorhombic phase to a low temperature tetragonal (LTT) phase at (48-52 K); (2) onset of periodic charge order at (45-48 K); (3) onset of periodic spin order at (40-42 K, not detectable); (4) onset of diamagnetism at (38-40 K); (5) zero resistivity at ( K); and (6) the emergence of 3D superconductivity below (12-18 K). Further details of the identification are discussed in SOM . We emphasize the quantitative consistency of these temperature scales within our experimentsSOM and note their agreement with existing literatureLi et al. (2007a); Tranquada et al. (2008); Hücker et al. (2011).
Zero Field Nernst Effect
To distinguish the evidence for TRSB due to phase incoherent superconductivityLi et al. (2011) from the signatures of nontrivial charge orderingKarapetyan et al. (2014), it is imperative to examine their evolution with doping and magnetic field using techniques sensitive to both phenomenaHosur et al. (2013). The large resistivity anisotropy in LBCO (, Li et al. (2007a)) severely limits attempts to detect their presence using anomalous Hall effect – due to unavoidable artifacts resulting from -axis pickupSOM . In contrast, the near-isotropic thermoelectric properties of LBCONakamura and Uchida (1993) enable the field-symmetric Nernst coefficient, , to probe their signatures with the requisite sensitivity. Having determined the characteristic temperature scales of stripe and superconducting phases for our samples, we thus turn to the Nernst effect measurements forming the nucleus of this work.
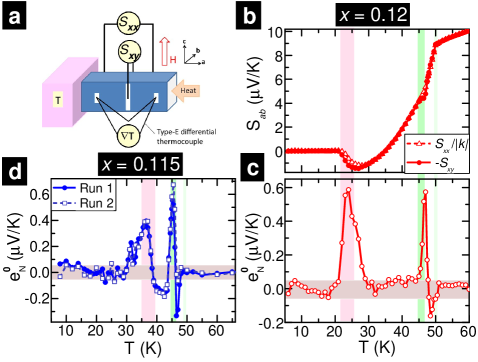
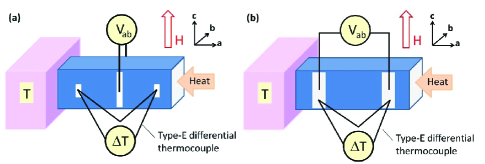
The Nernst coefficient, corresponds to the transverse voltage generated due to a longitudinal thermal gradient . It is typically observed at a finite magnetic field, and in the cuprates, has been attributed to moving vorticesWang et al. (2006); Li et al. (2007b), Gaussian fluctuationsUssishkin et al. (2002), or to quasiparticles arising from fluctuating stripesCyr-Choinière et al. (2009); Chang et al. (2010). While the aforementioned field anti-symmetric, or conventional Nernst coefficient is determined entirely from transverse thermoelectric measurements at fields (), this is not possible for the the field-symmetric, unconventional component of interest to us (). For example, at zero field, the observed signal () unavoidably contains a longitudinal pickup due to a slight misalignment of the contact leads (Fig. 2b). Therefore, we obtain the true zero field Nernst (ZFN) coefficient (and, by extension, at finite fields) by removing the contribution to , i.e. Li et al. (2011), where and are measured simultaneously (schematic in Fig. 2a, further details in SOM ).
The ZFN coefficient measured as a function of temperature using this compensated technique for and respectively (Fig. 2c-d) shows several features at characteristic transition temperatures that are consistent across doping. First, is finite only for , i.e. in the presence of static stripes, yet in the absence of bulk superconductivity, as reported for Li et al. (2011). Second, can be bipolar (Fig. 2d) in contrast with Li et al. (2011), and the exact behavior is reproduced through multiple temperature cycles. Third, we observe a broad hump (width K) just above - similar to that reported in Li et al. (2011), which has been ascribed to spontaneous vortex generation. Fourth, and crucially, we observe a sharp peak (width K) at a temperature previously identified as . This peak, also visible in the raw data (Fig. 2b) has been hitherto unobserved likely due to its sharp linewidth; our high temperature resolution ( K) and small temperature gradients ( K/mm) enable its detection. We reiterate that such a sharp peak is in contrast to a broad hump expected from the presence of vorticesLi et al. (2011). Importantly, its coincidence with the onset of stripe charge order ( ) is suggestive of its origin.
Symmetric Nernst Effect: Field Dependence
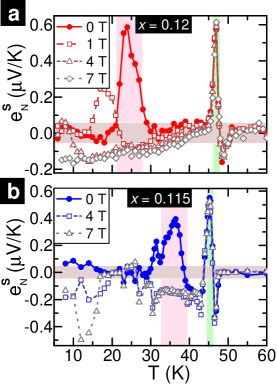
Having identified features of interest in the ZFN data, we now turn to the field-symmetric evolution of these data (, shown in Fig. 3), to further understand the origin of these features. The two peaked features identified previously have remarkably contrasting field dependent behavior – consistent across doping. First, the broad hump just above is strongly suppressed with field – it is much reduced in magnitude and is observed at lower temperatures. This is consistent with its expected origin from the spontaneous generation of vortices of one sign, which would be stabilized by TRSBLi et al. (2011). In contrast, the sharp peak at has no observable field dependence in position or magnitude, maintaining a robust presence at across field and doping. This strongly suggests that the latter peak does not have a superconducting origin, and could instead emerge from other nontrivial symmetry breaking phenomenaKarapetyan et al. (2014). Finally, we also note the field dependence of the background emerging at or just below , and persisting to lower temperatures.
Conventional Nernst Effect
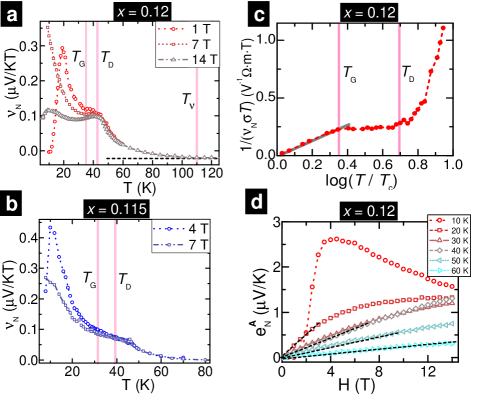
The conventional Nernst effect has been extensively utilized to probe superconducting and quasiparticle fluctuations in the cupratesWang et al. (2006); Cyr-Choinière et al. (2009). Fig. 4a-b show the temperature dependence of the field-normalized, anti-symmetric Nernst coefficient of LBCO-0.120, , measured at various magnetic fields for the two doping values. At high temperatures, the near-constant results from quasiparticle transportWang et al. (2006). Below the Nernst onset temperature K, deviates from the background, with a kink observed at . The suppression of by magnetic field at temperatures below the onset of diamagnetism, , is a clear signature of superconducting vortices Xu et al. (2000); Wang et al. (2006); Ussishkin et al. (2002); Kokanović et al. (2009). This may result from either vortex excitations produced by phase fluctuationsXu et al. (2000); Wang et al. (2006) or from Gaussian amplitude fluctuations caused by short-lived Cooper pairsUssishkin et al. (2002); Kokanović et al. (2009). In our case, increases dramatically below K for – the onset temperature of Gaussian fluctuations. This is verified in Fig. 4c, wherein a linear relationship is observed between and for – indicating the dominance of Gaussian fluctuationsUssishkin et al. (2002); Serbyn et al. (2009); Michaeli and Finkel’stein (2009). Meanwhile, the superconducting signatures observed over are likely due to vortex excitations. We note that the broad ZFN peak occurs in this temperature regime, consistent with its ascribed origin to superconducting vortices resulting from TRSBLi et al. (2011). Finally, the absence of any measurable field-dependence signatures in at corroborate the non-superconducting origin of the peak in the complementary ZFN measurements.
C Discussion
Our detailed doping and field-dependent studies show that the symmetric Nernst effect signal observed in near- LBCO is comprised of two distinct components – a broad, field-dependent hump above of superconducting origin, and a sharp field-independent peak at . The observed behavior of the broad hump with doping and field substantiates prior reports at of spontaneously generated vortices arising from TRSBLi et al. (2011). In contrast, the hitherto unobserved robust peak at , unchanged with field, is suggestive of a stripe charge order origin. It is worth emphasizing that the observed result is a large, spontaneously generated transverse electric field at in response to a longitudinal thermal gradient. Having ruled out a superconducting origin, we consider the possibility that this results from the heat current going off-axis for extrinsic reasons, either induced by the contacts, or sample inhomogeneity. First, we point out that repeated (3-5 times) measurements across multiple samples for each doping with fresh electrical and thermal contacts show a peak constant in magnitude within measurement error – discounting contact-related artifacts. Next, the possibility of marked physical or chemical inhomogeneity deeper inside the sample causing this effect can also be ruled out as these should be detectable within the complementary , , and measurements, which are instead consistent with the expected behavior at the corresponding dopingSOM . Finally, in a perfectly crystalline sample, is also possible that the onset of unidirectional charge stripes drastically alters the thermal transport properties, introducing a transverse component to the thermal current. Here it is worth noting that our samples are not detwinned, and such unidirectional behavior is expected to average out over the sample size, as evidenced in Hall measurementsSOM . Moreover, our measurements of transverse thermal gradients across this temperature range show that any such transverse effects would be an order of magnitude smaller than the the observed sharp, sizeable feature at SOM . Furthermore, since the sample is heated to high-temperatures ( 700 K, for contact preparation) between successive measurements, the presence of a quantitatively reproducible peak is not tenable in such a scenario.
Finally, we examine plausible scenarios wherein the peak emerges from intrinsic effects resulting from the onset of stripe charge order. One possibility is that the presence of some tetragonal symmetry breaking could result in the mixing of longitudinal and transverse transport coefficients. While such effects would be small or absent in a perfectly tetragonal crystal, they could be induced by charge or superconducting stripes, and would be preferentially oriented along crystallographic directions. Another possibility is that this peak results from the point-group symmetry breaking emerging from nontrivial stacking of stripesHosur et al. (2013, 2015), as observed in Kerr effect measurements of similar samplesKarapetyan et al. (2012). In this latter case, one would expect PSB, and thus the ZFN signal to persist to well below . While the peak-like manifestation of the ZFN signal could, in principle, result from the interplay of a PSB signal and the field-dependent background, a quantitative explanation of the observations is imperative.
In summary, we have performed a detailed investigation of the thermoelectric coefficients of near- LBCO, with varying doping and magnetic field. Our symmetric Nernst effect signal is comprised of two distinct components – a broad, field-dependent hump above of superconducting origin, and a sharp field-independent peak at . While the former is consistent with prior reports indicative of spontaneous TRSB, the latter, likely of stripe charge order origin, merits a comprehensive theoretical explanation.
We are grateful to Ivar Martin for insightful discussions. This work was supported by the National Research Foundation, Singapore, through Grant NRF-CRP4-2008-04. The work at AIST was supported by JSPS Grants-in-Aid for Scientific Research (Grant no. 22560018). A.S. and X.Y.T. contributed equally to this work.
References
- Norman (2011) M. R. Norman, Science 332, 196 (2011).
- Lee (2014) P. A. Lee, Phys. Rev. X 4, 031017 (2014).
- Taillefer (2009) L. Taillefer, J. Phys.: Condens. Matter 21, 164212 (2009).
- Sebastian et al. (2009) S. E. Sebastian, N. Harrison, C. H. Mielke, R. Liang, D. A. Bonn, W. N. Hardy, and G. G. Lonzarich, Phys. Rev. Lett. 103, 1 (2009).
- Wise et al. (2008) W. D. Wise, M. C. Boyer, K. Chatterjee, T. Kondo, T. Takeuchi, H. Ikuta, Y. Wang, and E. W. Hudson, Nat. Phys. 4, 696 (2008).
- Emery et al. (1999) V. J. Emery, S. A. Kivelson, and J. M. Tranquada, Proc. Natl. Acad. Sci. 96, 8814 (1999).
- He et al. (2011) R.-H. He, M. Hashimoto, H. Karapetyan, J. D. Koralek, J. P. Hinton, J. P. Testaud, V. Nathan, Y. Yoshida, H. Yao, K. Tanaka, W. Meevasana, R. G. Moore, D. H. Lu, S.-K. Mo, M. Ishikado, H. Eisaki, Z. Hussain, T. P. Devereaux, S. A. Kivelson, J. Orenstein, A. Kapitulnik, and Z.-X. Shen, Science 331, 1579 (2011).
- Xia et al. (2008) J. Xia, E. Schemm, G. Deutscher, S. A. Kivelson, D. A. Bonn, W. N. Hardy, R. Liang, W. Siemons, G. Koster, M. M. Fejer, and A. Kapitulnik, Phys. Rev. Lett. 100, 3 (2008).
- Fujita et al. (2004) M. Fujita, H. Goka, K. Yamada, J. M. Tranquada, and L. P. Regnault, Phys. Rev. B 70, 104517 (2004).
- Hücker et al. (2011) M. Hücker, M. v. Zimmermann, G. D. Gu, Z. J. Xu, J. S. Wen, G. Xu, H. J. Kang, A. Zheludev, and J. M. Tranquada, Phys. Rev. B 83, 104506 (2011).
- Li et al. (2011) L. Li, N. Alidoust, J. Tranquada, G. Gu, and N. P. Ong, Phys. Rev. Lett. 107, 1 (2011).
- Karapetyan et al. (2012) H. Karapetyan, M. Hücker, G. Gu, J. Tranquada, M. Fejer, J. Xia, and A. Kapitulnik, Phys. Rev. Lett. 109, 1 (2012).
- Karapetyan et al. (2014) H. Karapetyan, J. Xia, M. Hücker, G. D. Gu, J. M. Tranquada, M. M. Fejer, and A. Kapitulnik, Phys. Rev. Lett. 112, 047003 (2014).
- Hosur et al. (2013) P. Hosur, A. Kapitulnik, S. A. Kivelson, J. Orenstein, and S. Raghu, Phys. Rev. B 87, 115116 (2013).
- Valla et al. (2006) T. Valla, a. V. Fedorov, J. Lee, J. C. Davis, and G. D. Gu, Science 314, 1914 (2006).
- He et al. (2008) R.-H. He, K. Tanaka, S.-K. Mo, T. Sasagawa, M. Fujita, T. Adachi, N. Mannella, K. Yamada, Y. Koike, Z. Hussain, and Z.-X. Shen, Nat. Phys. 5, 119 (2008).
- Li et al. (2007a) Q. Li, M. Hücker, G. Gu, A. Tsvelik, and J. Tranquada, Phys. Rev. Lett. 99, 067001 (2007a).
- Tranquada et al. (2008) J. M. Tranquada, G. D. Gu, M. Hücker, Q. Jie, H.-J. Kang, R. Klingeler, Q. Li, N. Tristan, J. S. Wen, G. Xu, Z. A. Xu, J. Zhou, and M. von Zimmermann, Phys. Rev. B 78, 174529 (2008).
- Orenstein and Moore (2013) J. Orenstein and J. E. Moore, Phys. Rev. B 87, 165110 (2013).
- Chakravarty (2014) S. Chakravarty, Phys. Rev. B 89, 087101 (2014).
- Armitage (2014) N. P. Armitage, Phys. Rev. B 90, 035135 (2014).
- Hosur et al. (2015) P. Hosur, A. Kapitulnik, S. A. Kivelson, J. Orenstein, S. Raghu, W. Cho, and A. Fried, Physical Review B 91, 039908 (2015).
- (23) Supplementary Materials.
- Ito et al. (2013) T. Ito, T. Ushiyama, Y. Yanagisawa, Y. Tomioka, I. Shindo, and A. Yanase, J. Cryst. Growth 363, 264 (2013).
- Hücker et al. (2008) M. Hücker, G. Gu, and J. Tranquada, Phys. Rev. B 78, 214507 (2008).
- Hücker et al. (2010) M. Hücker, M. v. Zimmermann, M. Debessai, J. S. Schilling, J. M. Tranquada, and G. D. Gu, Phys. Rev. Lett. 104, 057004 (2010).
- Nakamura and Uchida (1993) Y. Nakamura and S. Uchida, Phys. Rev. B 47, 8369 (1993).
- Wang et al. (2006) Y. Wang, L. Li, and N. P. Ong, Phys. Rev. B 73, 024510 (2006).
- Li et al. (2007b) L. Li, J. G. Checkelsky, S. Komiya, Y. Ando, and N. P. Ong, Nat. Phys. 3, 311 (2007b).
- Ussishkin et al. (2002) I. Ussishkin, S. Sondhi, and D. Huse, Phys. Rev. Lett. 89, 287001 (2002).
- Cyr-Choinière et al. (2009) O. Cyr-Choinière, R. Daou, F. Laliberté, D. LeBoeuf, N. Doiron-Leyraud, J. Chang, J.-Q. Yan, J.-G. Cheng, J.-S. Zhou, J. B. Goodenough, S. Pyon, T. Takayama, H. Takagi, Y. Tanaka, and L. Taillefer, Nature 458, 743 (2009).
- Chang et al. (2010) J. Chang, R. Daou, C. Proust, D. LeBoeuf, N. Doiron-Leyraud, F. Laliberté, B. Pingault, B. J. Ramshaw, R. Liang, D. A. Bonn, W. N. Hardy, H. Takagi, A. B. Antunes, I. Sheikin, K. Behnia, and L. Taillefer, Phys. Rev. Lett. 104, 3 (2010).
- Serbyn et al. (2009) M. Serbyn, M. Skvortsov, A. Varlamov, and V. Galitski, Phys. Rev. Lett. 102, 067001 (2009).
- Michaeli and Finkel’stein (2009) K. Michaeli and A. M. Finkel’stein, Europhys. Lett. 86, 27007 (2009).
- Xu et al. (2000) Z. A. Xu, N. P. Ong, Y. Wang, T. Kakeshita, and S. Uchida, Nature 406, 486 (2000).
- Kokanović et al. (2009) I. Kokanović, J. Cooper, and M. Matusiak, Phys. Rev. Lett. 102, 187002 (2009).
Supplementary Materials for
Multiple Broken Symmetries in Striped La2-xBaxCuO4
detected by the
Field Symmetric Nernst Effect
S I Sample Preparation
Single crystals of La2-xBaxCuO4 (near ) were grown using the recently developed laser-diode-heated floating zone method, which enables an exceptionally high degree of sample homogeneity, as shown by the absence of impurity phases in Laue and x-ray diffraction measurementsIto et al. (2013). The samples were cut along the crystal axes into rectangular bars for plane transport measurements, with typical dimensions of mm for in-plane resistivity () measurements and mm for thermoelectric and Hall measurements .
Electrical contacts were made with silver paste (DuPont™ 6838) baked in high purity O2-flow environment at 450 ∘C for 10 minutes. The typical contact resistance achieved was .
S II Magnetotransport Measurements
Thermoelectric Seebeck and Nernst effect measurements were performed in homemade apparatus with low DC noise ( nV), high temperature stability ( mK), and under high vacuum conditions ( mbar). Since thermoelectric measurements are in general sensitive to temperature profile in the sample, heat exchange between the sample and its surroundings has to be reduced in order to minimize the background temperature gradient. Towards this, the sample was enclosed in a radiation shield thermally anchored to the sample temperature, fine wires (25 m diameter) were used for electrical and thermal contacts, and the stage temperature was carefully stabilized before data acquisition. Meanwhile, supporting measurements of resistivity, Hall effect, and magnetization were performed in Quantum Design™ Physical Property Measurement System (PPMS) and Magnetic Property Measurement System (MPMS) systems respectively, with AC transport measurements in current bias mode at a frequency of 33 Hz.
Schematics for the measurement of Nernst and Seebeck thermoelectric coefficients are shown in Fig. S1. One end of the sample is thermally anchored to the sample stage at temperature . Heat is applied to the other end through a 1 k film heater in contact with the sample. A typical heater power of mW generates a temperature gradient K/mm, measured using a pair of differential thermocouple wires (type-E, diameter 25 m). For Nernst effect measurement (Fig. S1a), voltage contacts on the opposite sides of the sample were carefully aligned in order to minimize longitudinal thermopower pickup. For the symmetric Nernst effect results shown in this work (Fig 1-3), accuracy and reproducibility of the results were ensured by measuring Nernst and Seebeck coefficients simultaneously using the configuration shown in Fig. 2a.
Fig. S2 shows the conventional magnetotransport properties of our samples (). The variation of these coefficients, viz. the longitudinal resistivity , the Hall coefficient and the Seebeck coefficient , with magnetic field is consistent with published literatureLi et al. (2007a); Tranquada et al. (2008); Li et al. (2011). Notably both Hall and thermpower data consistently show a sign change at K, emphasizing the self-consistency of these measurements. Furthermore, the Hall data shows the absence of any hysteretic effects that could support domain formation in the strip phase.
The temperature scales corresponding to the various stripe and superconducting transitions that our samples undergo during these measurements (derived from Fig. 2 and Fig. S2) are listed in Tbl. S1.
| Temp. Scale | Significance | Samp. #1 (K) | Samp. #2 (K) |
|---|---|---|---|
| () | () | ||
| LTT Transition | 50 | 48 | |
| Charge Stripe Order | 47 | 45 | |
| Spin Stripe Order | _ | _ | |
| Diamagnetism | 42 | 38 | |
| Zero Resistivity | 22 | 25 | |
| Meissner State | 12 | 18 |
S III Thermoelectric Measurements: Consistency Checks
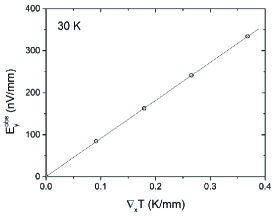
For correct determination of thermoelectric transport coefficients, especially (which is smaller than ), it is crucial to ensure that the data is acquired in a linear response regime, i.e. that the observed transverse electric field scales linearly with the applied temperature gradient for the conditions used in the measurements. Fig. S3 shows a representative selection of data acquired on LBCO (, K) towards Nernst effect measurements. With varying heater power, resulting in temperature gradients K/mm, the resulting transverse electric field is observed to be linear throughout. This justifies the accuracy of the measurements presented in this work, with typical K/mm – well within the linear response regime.
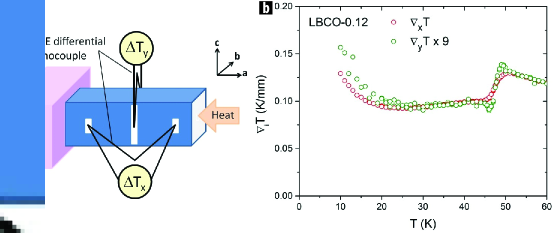
The observation of a ZFN signal, can, in principle also result from a spurious deflection of the longitudinal heat current towards the transverse direction. Such a heat current deflection would result in the generation of a Seebeck contribution along the -direction, manifesting as an artifact in the Nernst signal. To check for this, we measured the temperature gradient along the and -directions and respectively, in response to a heat current along the -direction. This is accomplished by replacing the pair of electrical contacts by another differential thermocouple, as shown in Fig. S4a.
Fig. S4b shows that is non-zero; however it results from a longitudinal pickup due to the unavoidable misalignment in the thermocouple contacts (analogous to Fig. 2(b)). Importantly, can be rescaled to overlay on (rescale factor ) for K. Any deviations from the rescaling, which are near the limit of our measurement resolution, can only result in spurious features an order of magnitude smaller in size that the observed sharp feature at . Therefore, we do not observe a heat current deflection along the -direction considerable enough to explain the observed zero field Nernst effect features in Fig. 2.