Thickness-Dependent Coherent Phonon Frequency in Ultrathin FeSe/SrTiO3 Films
Abstract
Ultrathin FeSe films grown on SrTiO3 substrates are a recent milestone in atomic material engineering due to their important role in understanding unconventional superconductivity in Fe-based materials. Using femtosecond time- and angle-resolved photoelectron spectroscopy, we study phonon frequencies in ultrathin FeSe/SrTiO3 films grown by molecular beam epitaxy. After optical excitation, we observe periodic modulations of the photoelectron spectrum as a function of pump-probe delay for 1 unit cell, 3 unit cell, and 60 unit cell thick FeSe films. The frequencies of the coherent intensity oscillations increase from to THz with increasing film thickness. By comparing with previous works, we attribute this mode to the Se A phonon. The dominant mechanism for the phonon softening in 1 unit cell thick FeSe films is a substrate-induced lattice strain. Our results demonstrate an abrupt phonon renormalization due to a lattice mismatch between the ultrathin film and the substrate.
keywords:
ultrathin films, time-resolved photoemission, coherent phonons, high-temperature superconductivitySLAC National Accelerator Laboratory] Stanford Institute for Materials and Energy Sciences, SLAC National Accelerator Laboratory, 2575 Sand Hill Road, Menlo Park, CA 94025, USA \alsoaffiliation[Stanford University] Geballe Laboratory for Advanced Materials, Departments of Physics and Applied Physics, Stanford University, Stanford, CA 94305, USA SLAC National Accelerator Laboratory] Stanford Institute for Materials and Energy Sciences, SLAC National Accelerator Laboratory, 2575 Sand Hill Road, Menlo Park, CA 94025, USA \alsoaffiliation[ALS, Lawrence Berkeley National Laboratory] Advanced Light Source, Lawrence Berkeley National Laboratory, Berkeley, CA 94720, USA SLAC National Accelerator Laboratory] Stanford Institute for Materials and Energy Sciences, SLAC National Accelerator Laboratory, 2575 Sand Hill Road, Menlo Park, CA 94025, USA \alsoaffiliation[Stanford University] Geballe Laboratory for Advanced Materials, Departments of Physics and Applied Physics, Stanford University, Stanford, CA 94305, USA CCMC Group, Lawrence Berkeley National Laboratory] Computational Chemistry, Materials, and Climate Group, Lawrence Berkeley National Laboratory, Berkeley, CA 94720, USA SLAC National Accelerator Laboratory] Stanford Institute for Materials and Energy Sciences, SLAC National Accelerator Laboratory, 2575 Sand Hill Road, Menlo Park, CA 94025, USA \alsoaffiliation[Stanford University] Geballe Laboratory for Advanced Materials, Departments of Physics and Applied Physics, Stanford University, Stanford, CA 94305, USA SLAC National Accelerator Laboratory] Stanford Institute for Materials and Energy Sciences, SLAC National Accelerator Laboratory, 2575 Sand Hill Road, Menlo Park, CA 94025, USA \alsoaffiliation[Stanford University] Geballe Laboratory for Advanced Materials, Departments of Physics and Applied Physics, Stanford University, Stanford, CA 94305, USA SLAC National Accelerator Laboratory] Stanford Institute for Materials and Energy Sciences, SLAC National Accelerator Laboratory, 2575 Sand Hill Road, Menlo Park, CA 94025, USA \alsoaffiliation[Stanford University] Geballe Laboratory for Advanced Materials, Departments of Physics and Applied Physics, Stanford University, Stanford, CA 94305, USA SLAC National Accelerator Laboratory] Stanford Institute for Materials and Energy Sciences, SLAC National Accelerator Laboratory, 2575 Sand Hill Road, Menlo Park, CA 94025, USA \alsoaffiliation[Stanford University] Geballe Laboratory for Advanced Materials, Departments of Physics and Applied Physics, Stanford University, Stanford, CA 94305, USA SLAC National Accelerator Laboratory] Stanford Institute for Materials and Energy Sciences, SLAC National Accelerator Laboratory, 2575 Sand Hill Road, Menlo Park, CA 94025, USA SLAC National Accelerator Laboratory] Stanford Institute for Materials and Energy Sciences, SLAC National Accelerator Laboratory, 2575 Sand Hill Road, Menlo Park, CA 94025, USA \alsoaffiliation[Stanford University] Geballe Laboratory for Advanced Materials, Departments of Physics and Applied Physics, Stanford University, Stanford, CA 94305, USA
![[Uncaptioned image]](/html/1506.01763/assets/x1.png)
This paper is published in Nano Letters, copyright American Chemical Society after peer review and technical editing by the publisher. To access the final version,
see [http://pubs.acs.org/articlesonrequest/AOR-xtHu8szuIYYXJxi6HnaD].
Ultrathin films regularly exhibit exotic electronic properties. Recent examples include the giant electron mobility in graphene 1, and the indirect-to-direct bandgap transition in metal chalcogenides2. Notably, a superconducting gap opening at high temperatures was discovered in one unit cell thick FeSe films on SrTiO substrates (1 UC FeSe/STO) 3, 4, 5, 6, 7. The gap opening temperature () of nearly K exceeds the of bulk FeSe by one order of magnitude 8, and sets a new record for Fe-based superconductors. 1 UC FeSe represents the fundamental building block of single crystal Fe-based superconductors and can provide critical information for understanding the entire material class 3, 4, 5, 6, 7.
Extensive studies on Fe-based superconductors have found that the Fe-chalcogen or Fe-pnictogen bond angle strongly impacts magnetic 9, 10, 11, 12 and superconducting properties 13, 14, 15, 16, 17. In FeSe/STO systems, these properties are also strongly dependent on the FeSe film thickness 3, 4, 5, 6, 7. It is thus essential to study lattice properties of FeSe/STO as a function of the film thickness.
Femtosecond time- and angle-resolved photoelectron spectroscopy (trARPES) is a powerful technique to investigate how electronic structures respond to lattice dynamics 18, 19, 20, 21, 22. With optical excitation, this technique drives coherent phonon oscillations and determines phonon frequencies with THz precision 19. In Fe-based superconductors, coherent excitation of the generic A phonon mode directly modulates the Fe-chalcogen or Fe-pnictogen bond angle 21, 22, 10, 11, 12, which can be related to transient tuning across the complex phase diagram 10.
In this Letter, we combine a state-of-the-art trARPES setup 23, 19 with molecular beam epitaxy (MBE) 7 to study FeSe/STO systems. We observe coherent phonon oscillations in 1 UC, 3 UC, and 60 UC FeSe films. The phonon frequency evolves from THz for the 1 UC film to THz for the 60 UC film. By comparing to a Raman scattering experiment 24, we attribute this mode to a Se A phonon. Our phonon frequency calculation based on density functional theory (DFT) suggests that the A phonon softening in 1 UC films is predominantly due to a substrate-induced lattice strain.
Details of the experimental setups for trARPES and MBE are discussed elsewhere 23, 7. We anneal -wt Nb-doped SrTiO3 substrates at C for minutes. Ultrahigh purity selenium () and iron () are then evaporated to the SrTiO3 substrates at C, resulting in high quality thin films checked by reflection high-energy electron diffraction. The films are transferred to the trARPES system via a vacuum suitcase with a base pressure of Torr. For trARPES, we use a Coherent RegA Ti:Sapphire laser system operating at 312 kHz repetition rate. We excite the thin films using 50 fs, 1.5 eV pump pulses, and probe the ensuing dynamics by photoemitting electrons at variable time delays using 100 fs, 6 eV pulses. The energy resolution is meV. For all measurements we use an incident pump fluence of mJ.cm-2, and maintain an equilibrium sample temperature of K. We do not resolve dependence of the phonon frequencies on the pump fluence within the range of . DFT calculations were performed using the Quantum-Espresso package using PAW pseudopotentials 25. For comparison, calculations were done using the PBE 26 and PBEsol 27 functionals. We used a momentum grid; the wave function and density cutoffs were Ry and Ry, respectively.
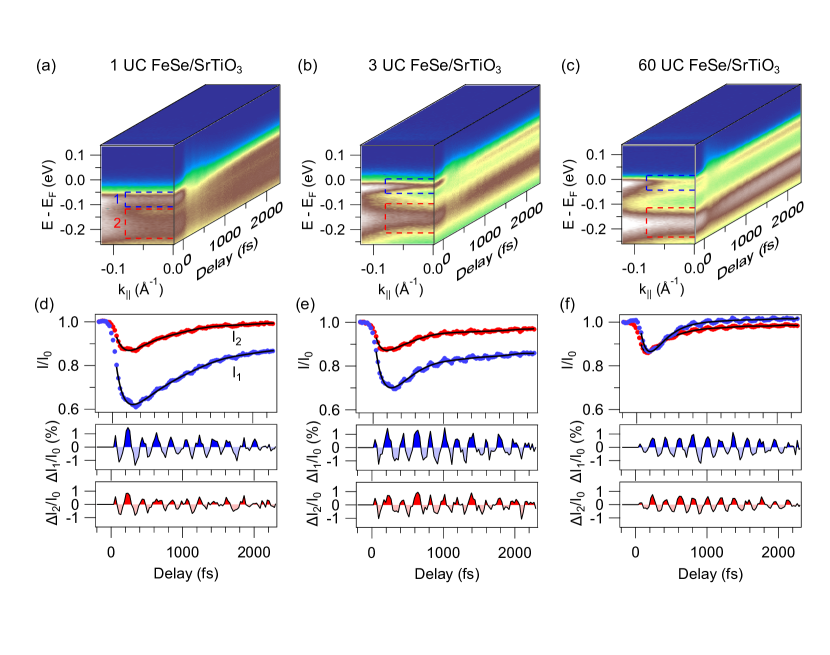
We show trARPES spectra near the Brillouin zone center for 1 UC, 3 UC, and 60 UC FeSe/STO in Fig. 1(a)(c), where the photoemission intensity is plotted as a function of electron energy, momentum, and pump-probe delay. Before time zero, the energy-momentum cut gives an ARPES spectrum in equilibrium. For the 1 UC film, two bands are identified near meV (Band 1) and meV (Band 2) below the Fermi level (). We do not observe additional features at lower binding energies as reported in the literature 6. The observed bands are shifted up towards when increasing the film thickness from 1 UC to 3 UC, which is consistent with a previous ARPES investigation and signifies a change in the charge transfer from the substrate to the film 7. According to the literature 6, 7, there are two hole-like bands in the spectral region of Band 1 in multi-layer FeSe films. In our data, a fine splitting near is indeed observed for 60 UC films before time zero, yet it is not observed for 3 UC films possibly due to the finite energy resolution.
At time zero, the optical excitation creates a non-equilibrium electron distribution. For all film thicknesses, the spectral peaks for Band 1 near are almost depleted near time zero, while those for Band 2 are partially depleted. During the relaxation process, periodic modulations of the spectral intensities can be observed for all three thicknesses. As shown in Fig. 1(a)(c), we choose energy-momentum windows to be centered at these bands, and integrate the intensities within these windows. The corresponding intensity dynamics in panels (d)(f) clearly display oscillations with periods of fs (frequencies of THz). We subtract smooth backgrounds by fitting the intensity dynamics with a 10 order polynomial. All fitting residuals exhibit these oscillations.
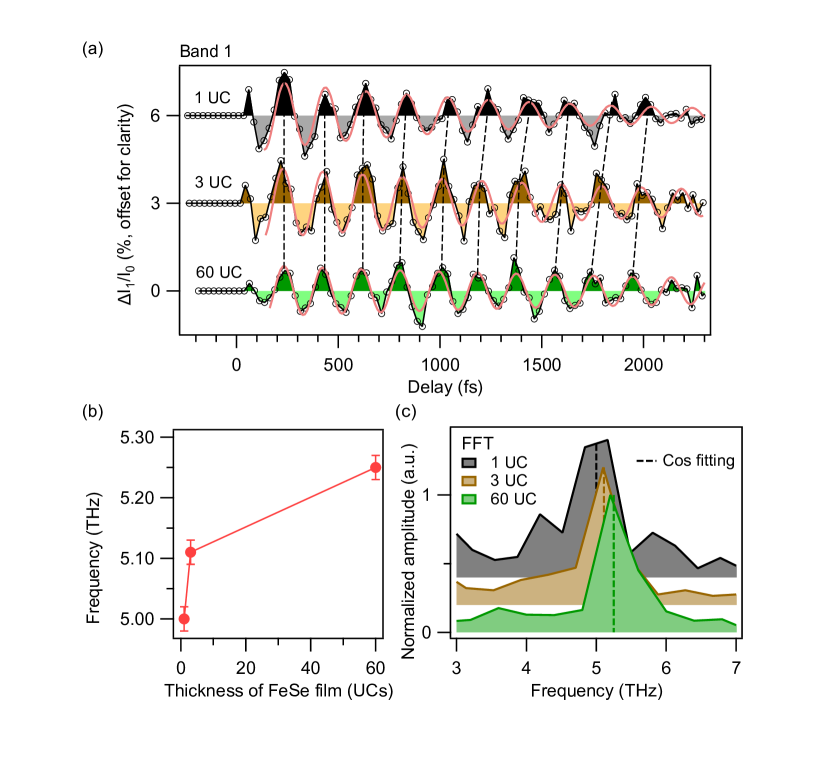
We present a more detailed frequency analysis in Fig. 2. To highlight small frequency shifts, we use dashed lines to trace the oscillation peaks in Fig. 2(a). While the oscillation peaks at early delays are temporally aligned, the peaks for the 1 UC and 3 UC films at fs are systematically delayed. This comparison suggests a softening of the oscillation frequency for thinner films. Quantitatively, we fit the residual traces with the functional form of . The frequency softens from THz for the 60 UC film to THz for the 1 UC film, in agreement with the trend in the Fourier transforms of the residual traces (Fig. 2(c)). Table 1 further demonstrates that this softening applies to both observed bands.
| Thickness (UCs) | Band 1 (THz) | Band 2 (THz) |
|---|---|---|
| 1 | 5.00 0.02 | 4.99 0.03 |
| 3 | 5.11 0.02 | 5.10 0.03 |
| 60 | 5.25 0.02 | 5.25 0.02 |
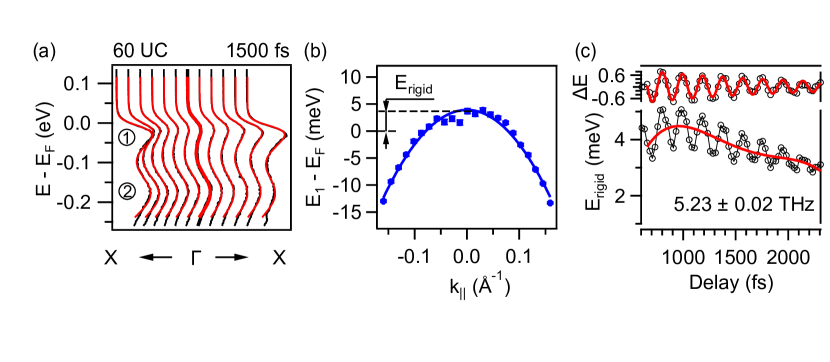
In addition to their intensities, the binding energies of the bands also exhibit THz oscillations. We demonstrate this using the 60 UC data, as the sharp bands observed therein permit a robust dispersion analysis. Since no band splitting is observed near after the pump excitation, we fit the energy distribution curves using two Gaussian peaks multiplied with a Fermi-Dirac distribution (Fig. 3(a)). In Fig. 3(b) we demonstrate the corresponding dispersion for Band 1 at fs. These transient dispersions are then fitted using a parabola with a delay-dependent rigid energy shift (Fig. 3(c)). This energy shift exhibits oscillations of frequency THz in agreement with the intensity analysis in Fig. 2.
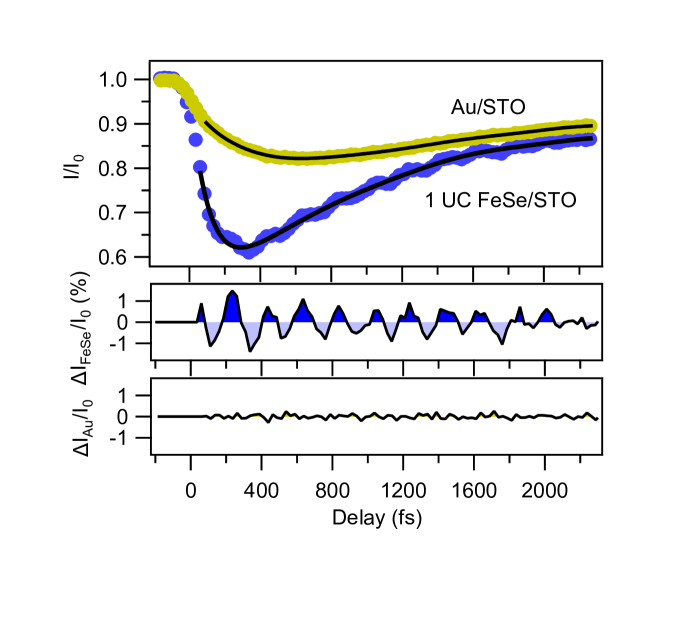
To determine whether the THz modes originate from FeSe or STO, we perform a control experiment on a Au film of a few nm thickness on a STO substrate. As shown in Fig. 4, the data on Au/STO displays no detectable oscillations, which suggests that the THz modes on FeSe/STO are primarily from FeSe thin films.
In accordance with a Raman scattering experiment on bulk FeSe 24, we assign the THz modulations to the Se A mode. A modes are in general the dominant modes coherently excited by ultrafast optical excitations 28. This has been demonstrated in a variety of materials such as Bi 20, Sb 28, Bi2Se3 19, and Fe-based superconductors 10, 21, 22, 11, 12. Our observation of a dominant A mode is consistent with this general picture.
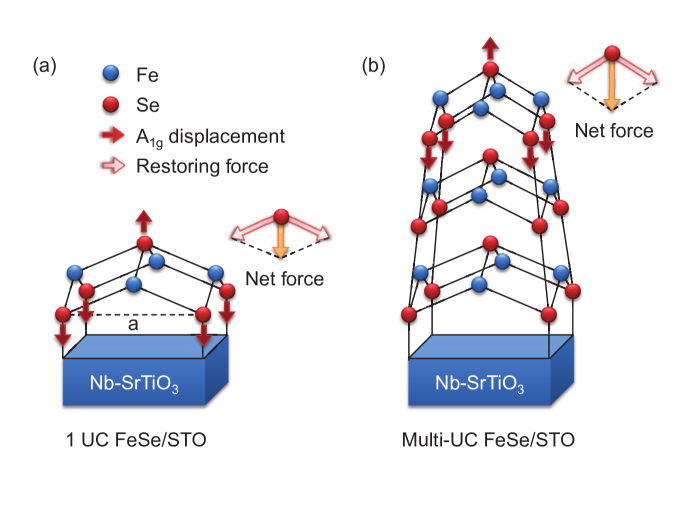
To understand the softening of the A mode with decreasing film thickness, it is important to consider the strong coupling between the first UC of FeSe and the STO substrate 3, 4, 5, 6, 7. One critical effect due to the substrate is the FeSe lattice strain 6, 29. The in-plane lattice constant of FeSe increases from Å in bulk crystals 8 to Å in 1 UC thin films matching the STO lattice constant 6. As shown in Fig. 5, this lattice strain causes the Fe-Se-Fe bond angle to increase, which results in a lower restoring force for out-of-plane Se displacements. Here we use DFT calculations to compare the A frequencies for 1 UC FeSe with a freely relaxed lattice constant, and the one with a constrained lattice constant. We find that the lattice strain produces a A phonon softening, which agrees well with our experimental value of softening. Additional mechanisms such as interlayer interactions 19, 30, 31 and interface dipole field 7, 32, 33 may also need to be incorporated for a complete understanding.
Our experiment demonstrates the high potential of integrating MBE sample growth with trARPES measurements. In particular, it allows us to resolve the phonon softening of THz ( meV) on multiple bands. This result would be difficult to obtain using traditional ARPES, and complements Raman spectroscopy by providing band sensitivity. With the capability of engineering materials on an atomic scale and studying them in non-equilibrium, this combined approach provides a platform to design and characterize electronic and lattice properties of nanoscale materials. One limitation is that the photon energy of eV does not allow us to reach the electron pocket at the Brillouin zone boundary where the superconducting gap is located 4, 5, 6, 7. This limitation can be overcome using higher energy probe photons 34.
The observation of the A mode for the chalcogen or pnictogen atoms in the Fe-based superconductors has important implications 10, 21, 22, 11, 12. In particular, this oscillation transiently modulates the Fe-chalcogen or Fe-pnictogen bond angle (Fig. 5), which in turn modifies the effective carrier density in the Fe orbitals 10, 22. A number of experiments have shown that the bond angle is correlated with for a variety of Fe-based superconductors 13, 14, 15, 16, 17. It is intriguing that the observed A phonon frequency is softened in 1 UC FeSe films, which coincides with a dramatically enhanced . Understanding the relationship between bond angle, phonon frequency, and electron-phonon coupling strength will be an important ingredient to identify the microscopic mechanism for high in 1 UC FeSe/STO.
The authors thank Hadas Soifer for stimulating discussions. This work was primarily supported by the U.S. Department of Energy, Office of Science, Basic Energy Sciences, Materials Sciences and Engineering Division under contract DE-AC02-76SF00515. S.-L. Y. acknowledges support by the Stanford Graduate Fellowship. J. A. S. acknowledges support from Zahid Hussain. D. L. acknowledges support from the Swiss National Science Foundation, under the Fellowship number P300P2-151328. P. S. K.’s contribution was supported in part by the National Science Foundation under Grant No. PHYS-1066293 and the hospitality of the Aspen Center for Physics.
References
- Geim and Novoselov 2007 Geim, A. K.; Novoselov, K. S. Nature Mater. 2007, 6, 183
- Zhang et al. 2014 Zhang, Y. et al. Nature Nanotech. 2014, 9, 111
- Wang et al. 2012 Wang, Q.-Y. et al. Chin. Phys. Lett. 2012, 29, 037402
- Liu et al. 2012 Liu, D. et al. Nature Commun. 2012, 3, 931
- He et al. 2013 He, S. et al. Nature Mater. 2013, 12, 605
- Tan et al. 2013 Tan, S. et al. Nature Mater. 2013, 12, 634
- Lee et al. 2014 Lee, J. J.; Schmitt, F. T.; Moore, R. G.; Johnston, S.; Cui, Y.-T.; Li, W.; Yi, M.; Liu, Z. K.; Hashimoto, M.; Zhang, Y.; Lu, D. H.; Devereaux, T. P.; Lee, D.-H.; Shen, Z.-X. Nature 2014, 515, 245
- Hsu et al. 2008 Hsu, F.-C.; Luo, J.-Y.; Yeh, K.-W.; Chen, T.-K.; Huang, T.-W.; Wu, P. M.; Lee, Y.-C.; Huang, Y.-L.; Chu, Y.-Y.; Yan, D.-C.; Wu, M.-K. Proc. Natl. Acad. Sci. U.S.A. 2008, 105, 14262
- García-Martínez et al. 2013 García-Martínez, N. A.; Valenzuela, B.; Ciuchi, S.; Cappelluti, E.; Calderón, M. J.; Bascones, E. Phys. Rev. B 2013, 88, 165106
- Kim et al. 2012 Kim, K. W.; Pashkin, A.; Schäfer, H.; Beyer, M.; Porer, M.; Wolf, T.; Bernhard, C.; Demsar, J.; Huber, R.; Leitenstorfer, A. Nature Mater. 2012, 11, 497
- Gerber et al. 2014 Gerber, S. et al. arXiv 2014, 1412.6842
- Rettig et al. 2014 Rettig, L.; Mariager, S. O.; Ferrer, A.; Grübel, S.; Johnson, J. A.; Rittmann, J.; Wolf, T.; Johnson, S. L.; Ingold, G.; Beaud, P.; Staub, U. arXiv 2014, 1411.0718
- Margadonna et al. 2009 Margadonna, S.; Takabayashi, Y.; Ohishi, Y.; Mizuguchi, Y.; Takano, Y.; Kagayama, T.; Nakagawa, T.; Takata, M.; Prassides, K. Phys. Rev. B 2009, 80, 064506
- Liu et al. 2011 Liu, Q. et al. J. Am. Chem. Soc. 2011, 133, 7892
- Zhao et al. 2008 Zhao, J.; Huang, Q.; De La Cruz, C.; Li, S.; Lynn, J. W.; Chen, Y.; Green, M. A.; Chen, G. F.; Li, G.; Li, Z.; Luo, J. L.; Wang, N. L.; Dai, P. Nature Mater. 2008, 7, 953
- Lee et al. 2008 Lee, C.-H.; Iyo, A.; Eisaki, H.; Kito, H.; Fernandez-Diaz, M. T.; Ito, T.; Kihou, K.; Matsuhata, H.; Braden, M.; Yamada, K. J. Phys. Soc. Jpn. 2008, 77, 083704
- Kimber et al. 2009 Kimber, S. A. J.; Kreyssig, A.; Zhang, Y.-Z.; Jeschke, H. O.; Valentí, R.; Yokaichiya, F.; Colombier, E.; Yan, J.; Hansen, T. C.; Chatterji, T.; McQueeney, R. J.; Canfield, P. C.; Goldman, A. I.; Argyriou, D. N. Nature Mater. 2009, 8, 471
- Schmitt et al. 2008 Schmitt, F.; Kirchmann, P. S.; Bovensiepen, U.; Moore, R. G.; Rettig, L.; Krenz, M.; Chu, J.-H.; Ru, N.; Perfetti, L.; Lu, D. H.; Wolf, M.; Fisher, I. R.; Shen, Z.-X. Science (New York, N.Y.) 2008, 321, 1649
- Sobota et al. 2014 Sobota, J. A.; Yang, S.-L.; Leuenberger, D.; Kemper, A. F.; Analytis, J. G.; Fisher, I. R.; Kirchmann, P. S.; Devereaux, T. P.; Shen, Z.-X. Phys. Rev. Lett. 2014, 113, 157401
- Leuenberger et al. 2013 Leuenberger, D.; Yanagisawa, H.; Roth, S.; Dil, J. H.; Wells, J. W.; Hofmann, P.; Osterwalder, J.; Hengsberger, M. Phys. Rev. Lett. 2013, 110, 136806
- Avigo et al. 2013 Avigo, I.; Cortés, R.; Rettig, L.; Thirupathaiah, S.; Jeevan, H. S.; Gegenwart, P.; Wolf, T.; Ligges, M.; Wolf, M.; Fink, J.; Bovensiepen, U. J. Phys.: Condens. Matter 2013, 25, 094003
- Yang et al. 2014 Yang, L. X. et al. Phys. Rev. Lett. 2014, 112, 207001
- Sobota et al. 2012 Sobota, J. A.; Yang, S.; Analytis, J. G.; Chen, Y. L.; Fisher, I. R.; Kirchmann, P. S.; Shen, Z.-X. Phys. Rev. Lett. 2012, 108, 117403
- Kumar et al. 2010 Kumar, P.; Kumar, A.; Saha, S.; Muthu, D. V. S.; Prakash, J.; Patnaik, S.; Waghmare, U. V.; Ganguli, A. K.; Sood, A. K. Solid State Commun. 2010, 150, 557
- Giannozzi et al. 2009 Giannozzi, P. et al. J. Phys.: Condens. Matter 2009, 21, 395502
- Perdew et al. 1996 Perdew, J. P.; Burke, K.; Ernzerhof, M. Phys. Rev. Lett. 1996, 77, 3865
- Perdew et al. 2008 Perdew, J. P.; Ruzsinszky, A.; Csonka, G. I.; Vydrov, O. A.; Scuseria, G. E.; Constantin, L. A.; Zhou, X.; Burke, K. Phys. Rev. Lett. 2008, 100, 136406
- Li et al. 2013 Li, J. J.; Chen, J.; Reis, D. A.; Fahy, S.; Merlin, R. Phys. Rev. Lett. 2013, 110, 047401
- Li et al. 2014 Li, B.; Xing, Z. W.; Huang, G. Q.; Xing, D. Y. J. Appl. Phys. 2014, 115, 193907
- Zhang et al. 2011 Zhang, J.; Peng, Z.; Soni, A.; Zhao, Y.; Xiong, Y.; Peng, B.; Wang, J.; Dresselhaus, M. S.; Xiong, Q. Nano Lett. 2011, 11, 2407
- Ishioka et al. 2015 Ishioka, K.; Kitajima, M.; Misochko, O. V.; Nagao, T. Phys. Rev. B 2015, 91, 125431
- Cui et al. 2015 Cui, Y.-T. et al. Phys. Rev. Lett. 2015, 114, 037002
- Xiang et al. 2012 Xiang, Y.-Y.; Wang, F.; Wang, D.; Wang, Q.-H.; Lee, D.-H. Phys. Rev. B 2012, 86, 134508
- Rohwer et al. 2011 Rohwer, T.; Hellmann, S.; Wiesenmayer, M.; Sohrt, C.; Stange, A.; Slomski, B.; Carr, A.; Liu, Y.; Avila, L. M.; Kalläne, M.; Mathias, S.; Kipp, L.; Rossnagel, K.; Bauer, M. Nature 2011, 471, 490