A Massive, Distant Proto-cluster at Caught in a Phase of Rapid Formation?
Abstract
Numerical simulations of cosmological structure formation show that the Universe’s most massive clusters, and the galaxies living in those clusters, assemble rapidly at early times (). While more than twenty proto-clusters have been observed at based on associations of 5–40 galaxies around rare sources, the observational evidence for rapid cluster formation is weak. Here we report observations of an asymmetric, filamentary structure at containing seven starbursting, submillimeter-luminous galaxies and five additional AGN within a comoving volume of 15000 Mpc3. As the expected lifetime of both the luminous AGN and starburst phase of a galaxy is 100 Myr, we conclude that these sources were likely triggered in rapid succession by environmental factors or, alternatively, the duration of these cosmologically rare phenomena is much longer than prior direct measurements suggest. The stellar mass already built up in the structure is 1012 M⊙ and we estimate that the cluster mass will exceed that of the Coma supercluster at . The filamentary structure is in line with hierarchical growth simulations which predict that the peak of cluster activity occurs rapidly at .
Subject headings:
galaxies: clusters: general galaxies: starburst galaxies: quasars: general cosmology: large-scale structure of universe1. Introduction
An outstanding question on the study of massive galaxy clusters in the Universe is how and when the member galaxies built most of their mass: in a cascade before the cluster coalesces, gradually as the cluster accretes mass, or predominantly after the formation of the cluster. While galaxies in nearby coalesced clusters have suppressed star-formation rates due to “cluster quenching,” (Cooper et al., 2008) it is unclear whether or not a reversal occurs at high-redshift (Elbaz et al., 2007), whereby galaxies in more massive structures have enhanced star-formation rates, in line with expectation from hierarchical growth formation (Moster et al., 2013). Dense environments that are undergoing a rapid formation in the form of proto-clusters are difficult to detect because the intracluster medium at has not yet been heated sufficiently to emit in the X-rays or absorb cosmic microwave background photons via the Sunyaev-Zel’dovich effect. The existing discoveries of high-redshift dense structures do not provide adequate observational evidence to interpret how and when the galaxies in those regions formed.
Here we present data on a distant proto-cluster at found serendipitously during a redshift survey of dusty star-forming galaxies (DSFGs) in the Scuba-2-imaged portion of the COSMOS field (Casey et al., 2013). We discuss data and observations in § 2, present relevant results and calculations in § 3, and discuss the implications on the formation of early proto-clusters in § 4.
2. Data & Observations
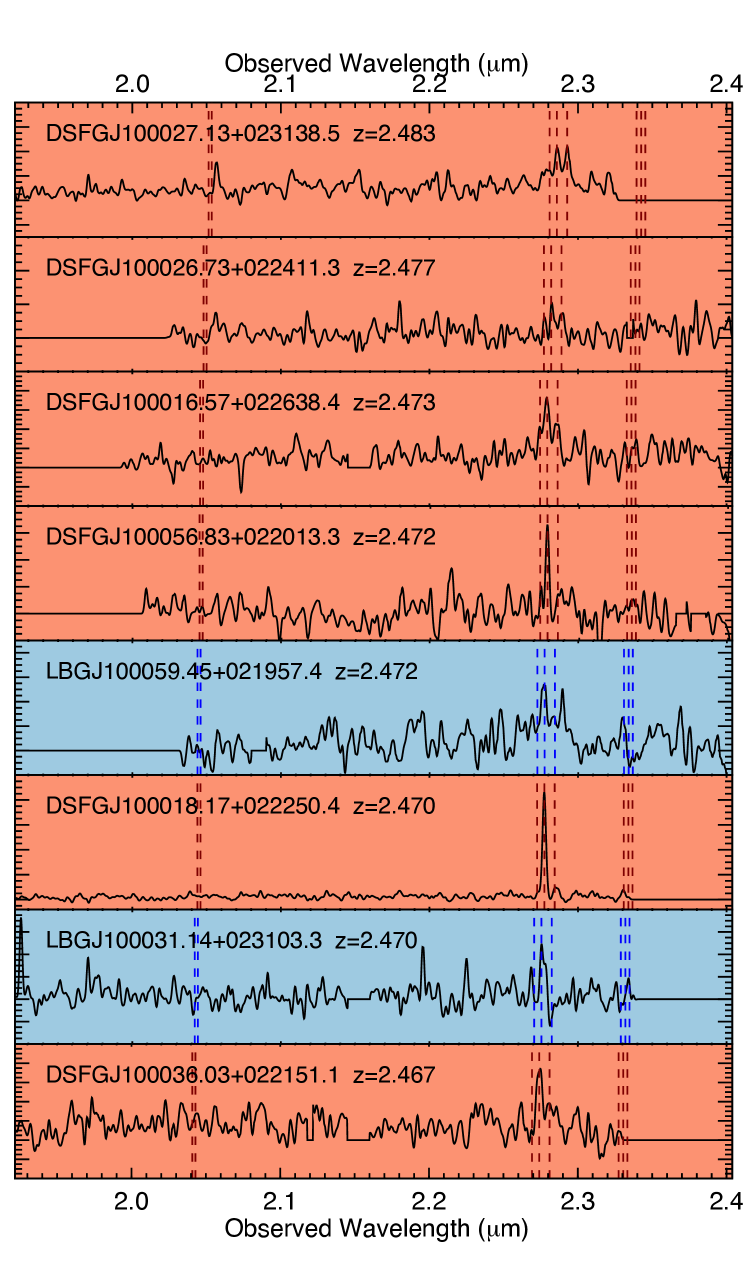
This structure, which we call PCL1002, was found serendipitously in Keck MOSFIRE (21-Dec-2012, 31-Dec-2013 and 19-Jan-2014) spectroscopic follow-up of Scuba-2-selected DSFGs in the COSMOS field. The DSFGs’ FIR-photometry is given in Table 1. Observing conditions for MOSFIRE nights were favorable, with clear skies and 0.5–0.7″ seeing. Six DSFGs were spectroscopically confirmed with H redshifts within 0.007 of . The DSFGs’ near-infrared counterparts are very secure for 4/6 DSFGs, driven by precise 450m positions (all given in Casey et al., 2013, except DSFG J100026.73+022411.3 with mJy). Two others have more ambiguity due to 850m-selection. DSFGJ100018.17022250.4 resembles a major-merger spanning 2′′ with multiple knots. DSFGJ100027.14023140.8 has both 24m/radio emission overlapping with IRAC emission towards the identified counterpart, given by source name. Two other MOSFIRE targets were confirmed in this same redshift interval. The one-dimensional H spectra are shown in Figure 1.
| Name | ||||||||||
|---|---|---|---|---|---|---|---|---|---|---|
| [Jy] | [mJy] | [mJy] | [mJy] | [mJy] | [mJy] | [mJy] | [mJy] | [Jy] | [ L⊙] | |
| DSFG J100036.03+022151.1… | 19417 | 11.32.2 | 15.62.7 | 11.34.9 | 14.53.1 | 4.61.1 | (3.12)1012 | |||
| DSFG J100018.17+022250.4… | 12816 | 11.32.2 | 3.94.1 | 3.31.0 | (3.84) | |||||
| DSFG J100016.57+022638.4… | 89017 | 6.71.9 | 19.23.6 | 24.52.2 | 21.52.7 | 17.34.7 | 11.63.0 | 3.71.0 | 571673 | (7.52)1012 |
| DSFG J100056.83+022013.3… | 9027 | 9.112.9 | 18.36.0 | 10.91.1 | (2.06) | |||||
| DSFG J100026.73+022411.3… | 8414 | 11.42.2 | 14.82.7 | 10.35.0 | 17.83.0 | 0.40.8 | (2.99) | |||
| DSFG J100018.21+023456.7… | 15311 | 16.62.0 | 19.53.4 | 12.08.8 | 11.24.2 | 2.571.74 | 4610 | (4.23) | ||
| DSFG J100027.14+023140.8… | 421152 | 13.61.8 | 24.43.6 | 36.92.2 | 30.82.8 | 3.95.0 | 17.03.4 | 5.81.4 | 6712 | (1.15) |
One additional Herschel-SPIRE-detected galaxy, COLDz J100018.21023456.7, sits at (Lentati et al., 2015), confirmed via detection of CO(1-0) in a 6.5 arcmin2 blank-field CO search program north of PCL1002 (D. Riechers et al., in prep).
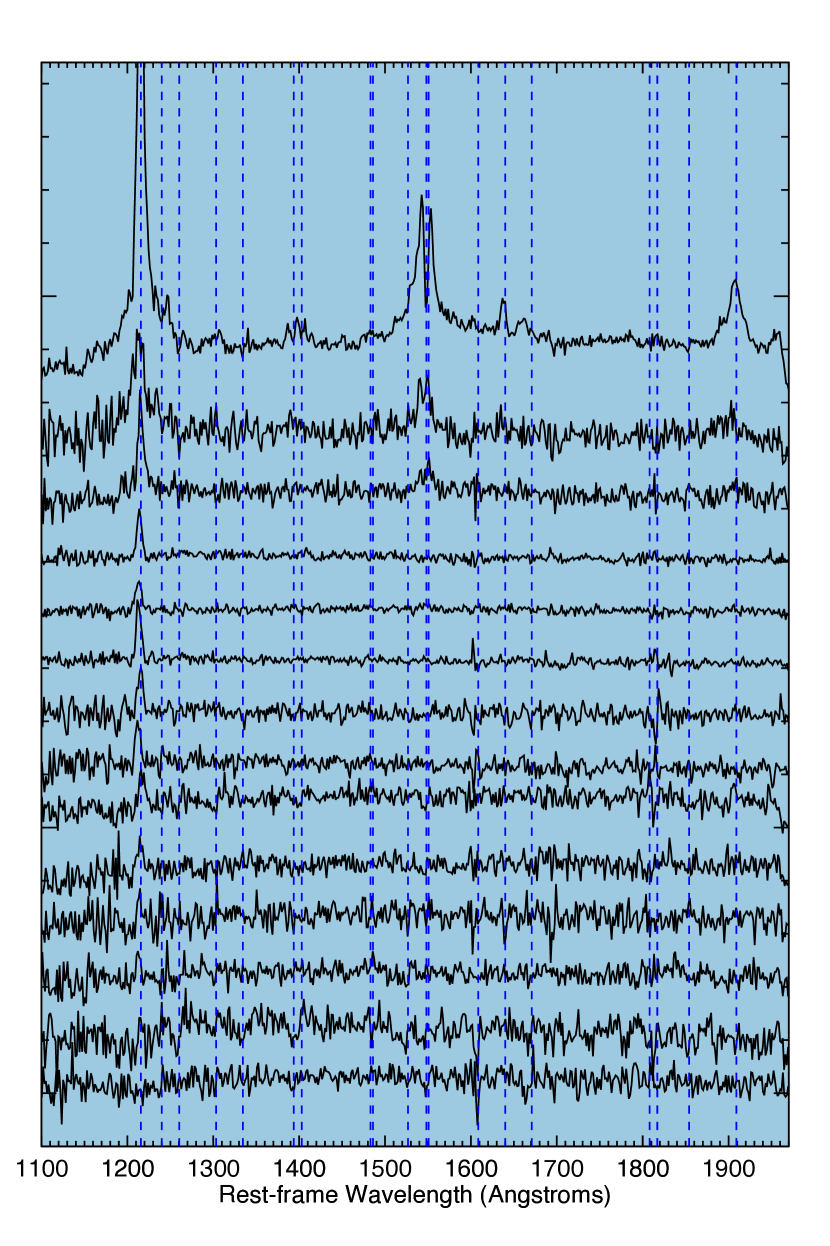
Supplementary data are pooled from a repository of legacy ancillary data in COSMOS. An additional 34 spectroscopically-confirmed sources in the COSMOS survey are within (Lilly et al., 2009), identified via Ly emission, Feii, Siii and Cii absorption, also shown in Figure 1. We also make use of the 30 photometric bands of imaging data available in the field (Ilbert et al., 2013). We also draw on the COSMOS Chandra X-ray 0.5–10 keV catalog (Civano et al., 2012), radio 1.4 GHz catalog (Schinnerer et al., 2007), and Herschel PEP/PACS and HerMES/SPIRE 100–500m catalogs (Lee et al., 2013).
We calculate the significance of this over-density using methods used for other structures (Steidel et al., 1998; Chapman et al., 2009) by computing the likelihood of observing 7 DSFGs within a interval with the Erlang distribution function (Eadie et al., 1971),
| (1) |
where is the probability that galaxies spanning a redshift range is drawn by chance. The expectation for the density of galaxies per unit redshift interval is described by and the calculation of the probability assumes no clustering as the null hypothesis. Assuming a volume-density of 710-5 Mpc-3 for L⊙ DSFGs at (taken from the best to-date luminosity functions of DSFGs; Casey, Narayanan, & Cooray, 2014), we infer that the number of DSFGs expected in a redshift slice of within a 150 arcmin2 box is (in a volume 10000 Mpc3). This implies the probability of observing seven DSFGs in this interval is 0.002%. This corresponds to a DSFG over-density of . For comparison, the most analogous structures in the literature are in HDF at (Blain et al., 2004, which has ), and the SSA22 proto-cluster at with 5–6 DSFGs. MRC1138256 at (Dannerbauer et al., 2014) contains 5 DSFGs, within a potentially much more compact volume (). With only 0.6 DSFGs expected in the given volume, this over-density only has a 0.0001% chance of occurring by chance, implying that PCL1002 is unlikely to be an artifact of incompleteness or survey bias.
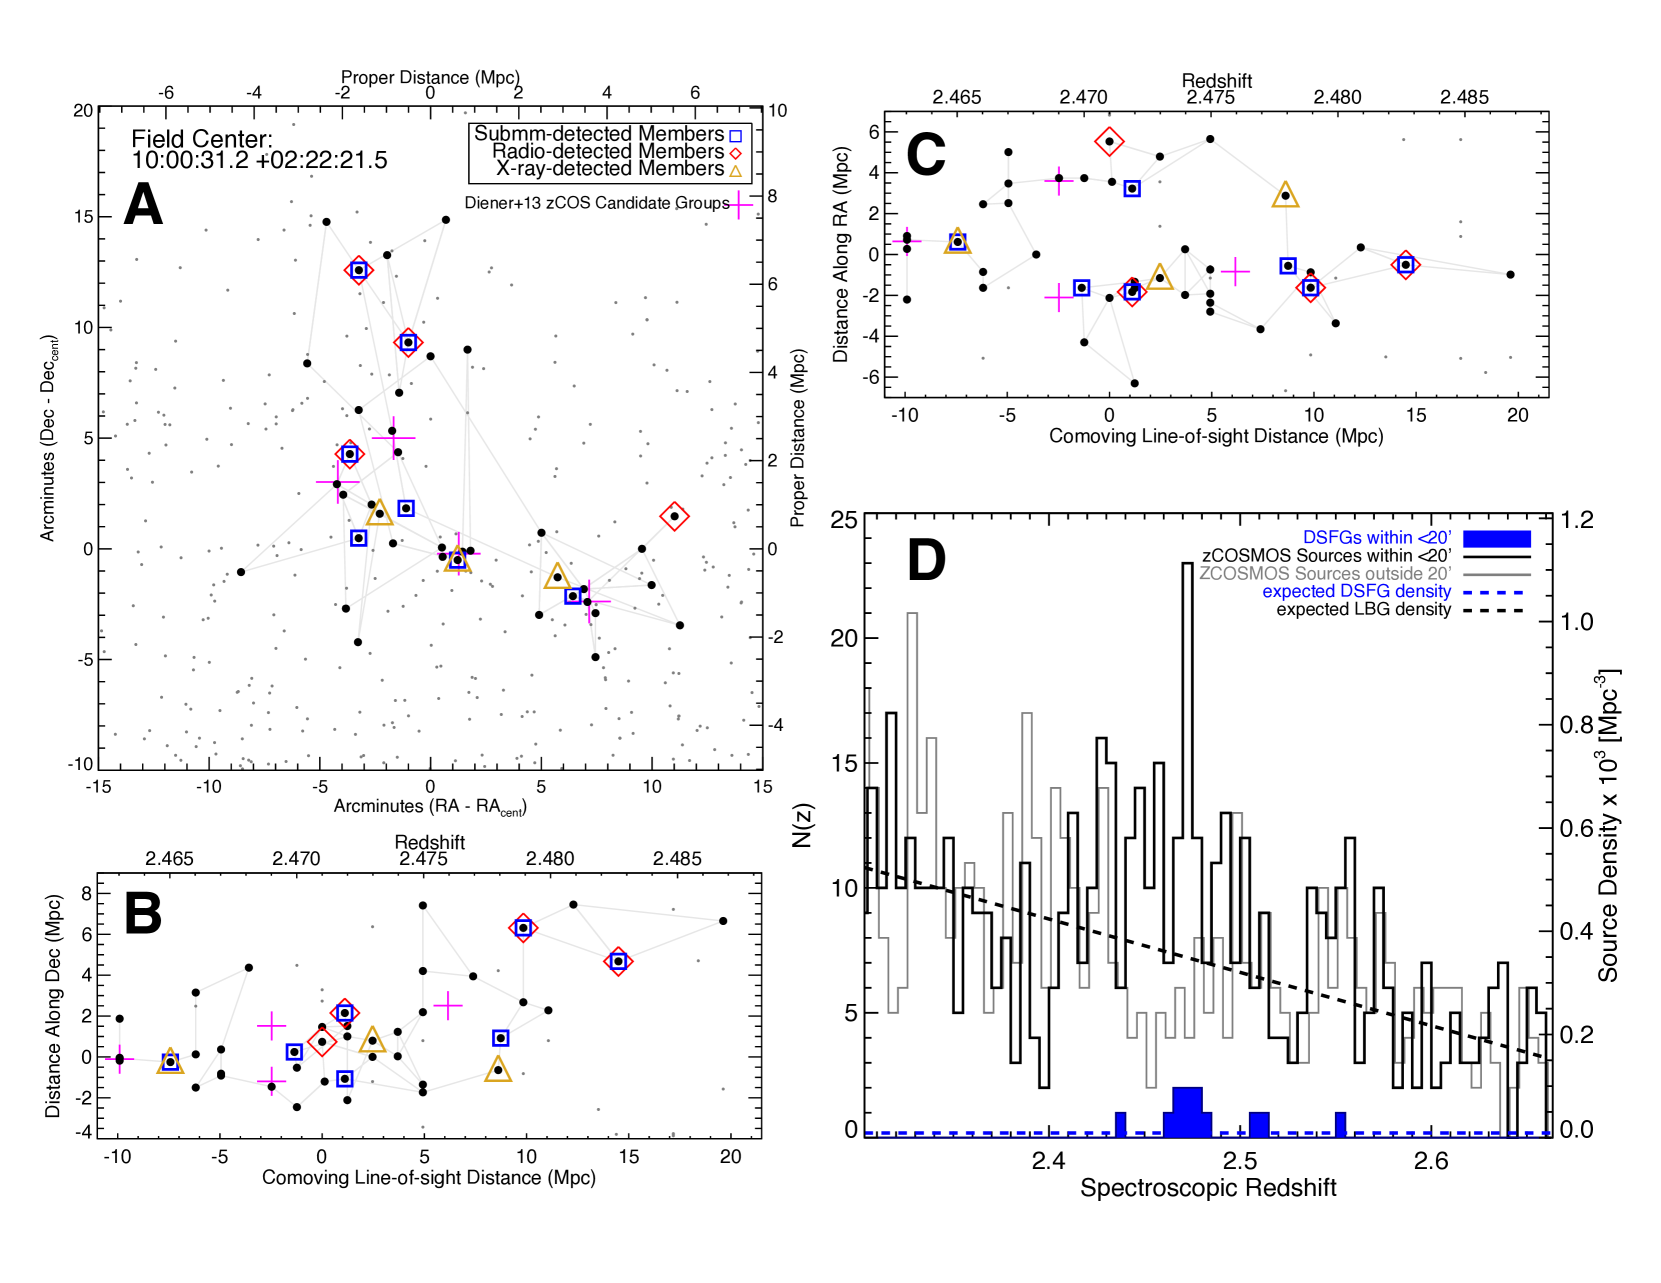
A similar peak is seen in the redshift distribution of COSMOS Lyman-Break Galaxies (LBGs) with a maximum . Although less pronounced than the DSFG over-density, the over-density of Lyman Break Galaxies are also spatially clustered on the sky in a filamentary structure. We use a friends-of-friends (FOF; Huchra & Geller, 1982) algorithm to formally determine which LBGs are in fact members of the DSFG over-density by selecting sources which are within 2 Mpc proper (projected on the sky and line-of-sight distance) of the DSFGs or their immediate neighbors, or within 3 Mpc of the DSFGs. This is similar to low- cluster member identification techniques but with longer ‘linking length’ accommodating high- non-virialized structures (Chiang et al., 2013). Table 2 lists PCL1002 members.
| Name | z | Type | LUV | SFR | M⋆ | Morph | AGN |
| (L⊙) | ( M⊙ yr-1) | (M⊙) | Class | indicator | |||
| LBG J100013.62+022604.9 | 2.463 | UV | (4.26) | 6.67 | (1.14) | Disk/Int | |
| LBG J100033.33+022159.9 | 2.463 | UV | (4.36) | 49.5 | (4.65) | Sph | |
| LBG J100036.90+022213.8 | 2.463 | Ly/UV | (2.24) | 3.17 | (5.74) | Sph | |
| LBG J100038.35+022216.4 | 2.463 | UV | (5.86) | 25.9 | (7.92) | Sph/Int | |
| DSFG J100036.03+022151.1 | 2.465 | H | 3.01010 | 296 | (1.01) | Disk/Int | X-ray |
| LBG J100018.18+022837.7 | 2.466 | UV | (4.28) | 12.7 | (2.37) | Sph/Int | |
| LBG J100024.36+022236.3 | 2.466 | UV | (4.88) | 25.5 | (8.79) | Sph/Int | |
| LBG J100050.73+021922.4 | 2.466 | UV | (6.61) | 98.2 | (1.44) | ||
| LBG J100031.14+023103.3 | 2.467 | H/Ly | (2.61) | 8.21 | (3.22) | Sph | |
| LBG J100051.16+022305.1 | 2.467 | Ly | (2.86) | 17.8 | (2.01) | ||
| LBG J100058.80+022032.4 | 2.467 | UV | (4.90) | 63.1 | (5.94) | ||
| LBG J100111.03+022043.4 | 2.467 | UV | (5.69) | 45.0 | (1.65) | ||
| LBG J100100.91+021927.3 | 2.469 | UV | (5.07) | 32.3 | (3.46) | ||
| LBG J095956.93+022118.5 | 2.470 | UV | (2.48) | 15.7 | (1.77) | ||
| LBG J100059.45+021957.4 | 2.470 | H/Ly | (3.75) | 16.9 | (2.66) | Opt/X-ray | |
| LBG J100100.91+021728.1 | 2.470 | Ly | (7.18) | 30.7 | (2.84) | ||
| DSFG J100018.17+022250.4 | 2.470 | H | (1.01)1011 | 365 | (1.91) | Merg | |
| LBG J100014.24+022516.7 | 2.471 | UV | (3.24) | 46.7 | (1.13) | Sph/Int | |
| LBG J100115.18+022349.7 | 2.471 | Ly/UV | (3.48) | 17.8 | (5.54) | Radio | |
| DSFG J100016.57+022638.4 | 2.472 | H | (8.82)109 | 714 | (1.09) | Disk | Radio |
| DSFG J100056.83+022013.3 | 2.472 | H | (3.71)1010 | 196 | (8.13) | ||
| LBG J100018.04+021808.6 | 2.472 | UV | (4.58) | 71.7 | (7.44) | Sph/Int | |
| LBG J100020.50+022421.5 | 2.472 | UV | (4.37) | 33.1 | (1.94) | Sph | |
| LBG J100109.29+022221.5 | 2.473 | Ly/UV | (3.73) | 52.6 | (1.04) | ||
| LBG J100015.38+022448.3 | 2.474 | Ly/[Civ] | (4.93) | 11.8 | (1.32) | Sph | UV |
| LBG J100033.20+022225.0 | 2.474 | Ly/UV | (2.48) | 63.2 | (1.52) | Sph | |
| LBG J100008.88+023044.1 | 2.475 | UV | (4.45) | 16.2 | (1.93) | ||
| LBG J100012.37+023707.6 | 2.475 | UV | (3.05) | 131 | (2.16) | ||
| LBG J100015.87+021939.5 | 2.475 | UV | (3.31) | 79.4 | (3.15) | Disk/Int | |
| LBG J100025.28+022643.3 | 2.475 | UV | (4.58) | 45.2 | (2.01) | Merg | |
| LBG J100116.15+021854.2 | 2.475 | UV | (3.86) | 23.3 | (4.99) | ||
| LBG J100002.03+023012.9 | 2.477 | Ly/UV | (5.46) | 23.3 | (4.38) | ||
| LBG J100054.07+022104.4 | 2.478 | Ly/[Civ] | (4.37) | 22.9 | (2.00) | UV/X-ray | |
| DSFG J100026.73+022411.3 | 2.478 | H | (7.55)109 | 284 | (1.64) | Disk | Opt |
| LBG J100024.21+022741.3 | 2.479 | UV | (5.47) | 18.0 | (1.04) | Sph | |
| DSFG J100018.21+023456.7 | 2.479 | CO(1-0) | 3.01010 | 400 | (2.13) | ||
| QSO J100021.96+022356.7 | 2.480 | Ly | (2.62) | … | (6.59) | QSO/Sph | UV/X-ray |
| DSFG J100027.14+023140.8 | 2.483 | H | (6.04)1010 | 1090 | (4.10) | Sph | Opt |
| LBG J100004.33+022654.1 | 2.480 | UV | (6.22) | 37.9 | (4.03) | ||
| LBG J100033.91+022713.2 | 2.481 | UV | (2.17) | 27.3 | (2.57) | ||
| LBG J100023.31+023537.5 | 2.487 | UV | (3.69) | 27.9 | (3.96) |
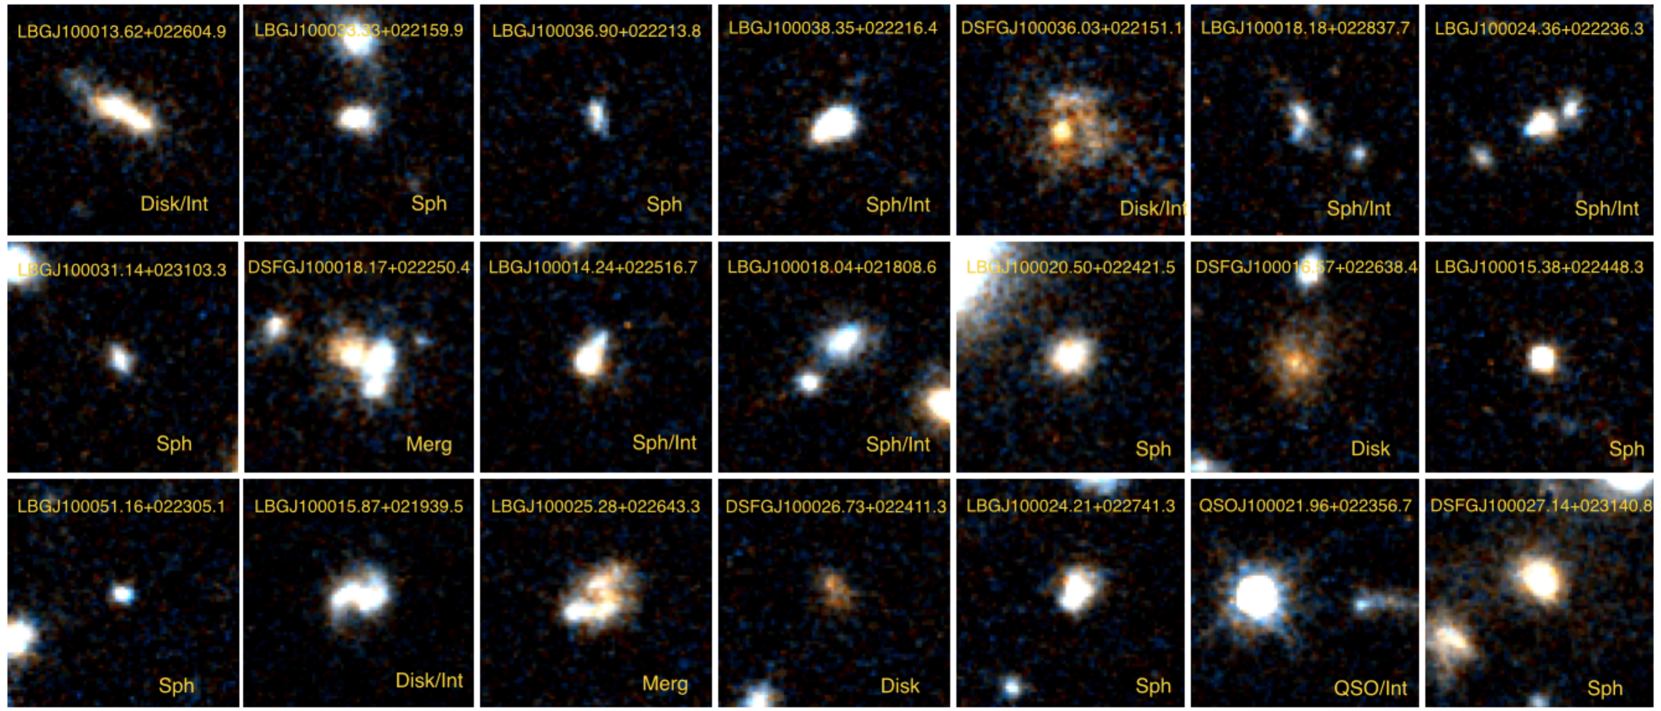
Source names indicate the selection method: submillimeter selection by DSFG, optical by LBG, and one unequivocal quasar by QSO. LUV is the rest-frame ultraviolet luminosity computed from an extrapolated apparent magnitude at rest-frame 1600Å. Morph Class refers to the CANDELS visual classification scheme applied to HST H-band imaging. ’Sph’ refers to spheroids, ’Disk’ refers to disk-like galaxies, ‘QSO’ refers to an unresolved point source, ‘Merg’ refers to a galaxy merger, and ’Int’ refers to some signature of galaxy interactions taking place.
PCL1002 sweeps out an effective area of 200 arcmin2 (distributed over an area extended 25′25′) and 28 Mpc comoving along the line of sight, and a volume 15000 Mpc3 comoving (or 400 Mpc3 proper). The range of redshifts translates to a total end-to-end line-of-sight velocity range of km s-1. Figure 2 maps the structure. Note that another over-dense structure (Chiang et al., 2014, 2015; Diener et al., 2015) at sits nearby (at distances of 50–100 Mpc).
This structure also hosts an over-density of luminous active galactic nuclei (AGN), an important signature of accreting supermassive black holes. Four galaxies (9.5%) are luminous X-ray sources in this structure (at 1043.7 erg s-1; Civano et al., 2012), a factor of 21 higher than the expected volume density of AGN of similarly high luminosities (Silverman et al., 2008). Even among the seven DSFGs, four exhibit unequivocal AGN characteristics in either the X-ray, radio, optical or ultraviolet (57%): a fraction nearly twice as high as expected from previous work on AGN in non-clustered DSFGs (Alexander et al., 2005). The depth of the Chandra-COSMOS observations is only sufficient to detect the most X-ray luminous AGN, so we stack the undetected population to search for possible low-luminosity AGN, but found no X-ray emission.
One of the seven DSFGs and one member LBG host radio-loud AGN (Schinnerer et al., 2007). DSFG J100016.57+022638.4 has a radio luminosity of W Hz-1, nearly analogous to a local Fanaroff-Riley class II AGN (Fanaroff & Riley, 1974). It has the potential to become the brightest cluster galaxy (BCG) when the structure matures to , consistent with other high- over-densities that host single radio-loud quasars (Venemans et al., 2007).
Beyond X-ray and radio signatures of AGN, we find that three DSFGs and one LBG either have very broad H lines or high [Nii]/ H ratios consistent with AGN. In summary, this structure hosts 6 luminous AGN, 9 galaxies with strong signatures of AGN, 7 submillimeter-luminous DSFGs, for a total of 12 exceptionally rare galaxies.
3. Results
3.1. Control Galaxies outside of PCL1002.
To draw comparisons between PCL1002’s member galaxies and field galaxies, we define a set of spectroscopically-confirmed galaxies that lack close physical associations. The redshift range of the control sample is restricted to Myr of the observed structure () to prevent confusion between redshift evolution and environmentally-driven differences. Of the 1072 COSMOS sources which satisfy , we remove sources within 20 Mpc of PCL1002 (a factor of two in comoving distance beyond the boundary of the structure itself) and any sources with more than two neighbors within 5 Mpc. The resulting sample consists of 401 galaxies; the vast majority of these are selected via optical-color and appear to only differ with the PCL1002 LBGs by environment.
3.2. Stellar Masses & Star-Formation Rates.
We use the MAGPHYS spectral energy distribution (SED) code (da Cunha et al., 2008) to constrain the UV-through-far-infrared SED empirically using energy balance techniques. We use a stellar synthesis template library as input, and attenuation is determined from a mix of hot/cool/PAH dust grains. Our interest in using MAGPHYS is threefold: to measure star-formation rates for galaxies not directly detected in the far-infrared, to estimate stellar masses for all galaxies (comparing stellar mass estimates of DSFGs with other techniques), and to compare physical properties of PCL1002 members with field galaxies. One galaxy, QSO J100021.96022356.7, lacks a SFR estimate due to lack of far-infrared detection or disambiguation of quasar-dominated optical SED from stellar emission.
Star formation rates for DSFGs are measured by fitting simple modified blackbodies (plus mid-infrared powerlaws, , ; Casey, 2012) to all available far-infrared/submillimeter photometry (Spitzer, Herschel, Scuba-2). We integrate under the SED from 8–1000m to get the total infrared luminosity, and convert to a star-formation rate using SFR/ M⊙ yr-1= 9.510-11 LIR/ L⊙ (Kennicutt, 1998) adjusted for a Chabrier initial mass function (Chabrier, 2003).
LBGs in PCL1002 are more massive in stars than control LBGs by a factor of 1.50.3. Given the uncertain star-formation histories of DSFGs, we check that the MAGPHYS-generated stellar mass estimates are not systematically biased by computing a rest-frame H-band magnitude for each DSFG, removing any mid-infrared dusty power-law (on average, 50% contribution), and converting to stellar mass using a range of appropriate mass-to-light ratios ( L⊙/mag; Hainline et al., 2011). Two DSFGs lack stellar mass estimates; DSFG J100016.57+022638.4 is dominated by a mid-infrared powerlaw (with no constraint on the underlying stellar emission) and DSFG J100027.14+023140.8 is blended in the near-infrared with several nearby sources. For the remainder, we find consistency between the MAGPHYS-derived stellar masses and the H-band derived stellar masses.
3.3. Submillimeter Stacking.
To investigate low-level submillimeter emission in the proto-cluster’s LBGs, we stack our 450m and 850m submillimeter maps at the positions of known galaxies, both in PCL1002 and in the control sample. Stacking analysis in the submillimeter requires the removal of bright, significantly-detected point sources (Webb et al., 2003) so that real DSFGs do not bias the measurement. Thirty-one of 34 LBG members fall within the sensitive area of the submillimeter maps (71 of 401 control sample LBGs). Flux densities are measured by inverse-variance weighting (Viero et al., 2013; Coppin et al., 2015). At 850m, we measure a flux density of mJy for PCL1002 LBGs, and 0.110.13 mJy for control LBGs. In other words LBGs in PCL1002 are brighter at 850m by a factor of 2.33.0 (although consistent with equal flux density, the likelihood of greater 850m in PCL1002 is 76%). At 450m, we measure a flux density of mJy for LBGs in PCL1002, and 1.660.69 mJy for control LBGs.
Although low signal-to-noise due to the small number of coadded sources, these measurements together are suggestive that the mass of cold dust and interstellar medium (ISM) is potentially higher for galaxies in the dense structure, despite their comparable star-formation rates. Since galaxies’ ISM masses scale directly to their gas masses (with roughly constant dust-to-gas ratio; Scoville et al., 2014), we deduce that the molecular gas reservoirs of the structure’s galaxies are probably deeper, thus their potential for heightened star-formation relative to similar galaxies living outside of it. Follow-up molecular gas measurements are needed to confirm this intriguing lead.
3.4. Rest-frame Optical Morphologies.
With Hubble Space Telescope (HST) H-band imaging available for 21/42 PCL1002 members (and 25/401 control galaxies), we investigate morphology and interaction state of rest-frame optical emission using the CANDELS visual classification scheme (Kocevski et al., 2012; Kartaltepe et al., 2012). The scheme classifies galaxies into a morphology class (disk, spheroid, irregular, or unclassifiable) and an interaction class (merger, interacting pair, or non-interacting). Full details of both morphology and interaction class for member galaxies are given Table 2 and Figure 3. Before visual classification was carried out, galaxy cutouts for cluster members and control were scrambled to ensure unbiased results. Although limited by small numbers, we find that 10 of 21 proto-cluster member galaxies (4810%) appear to be irregular or undergoing interaction while only 5 of 25 control galaxies exhibit interaction (208%). Even with removal of the DSFGs, a high interaction fraction (7/16=44%), is found for the proto-cluster members.
3.5. Estimating Halo Mass.
To estimate the net dark matter halo mass of this structure, we use abundance matching techniques from large-volume simulations (Behroozi, Wechsler, & Conroy, 2013). Due to PCL1002’s filamentary structure, we estimate the total halo mass by summing the estimated halo masses for each galaxy in the structure using its stellar mass. We estimate a lower limit of M(83) M⊙ at . Using a model for mass-dependent exponential growth, we estimate the halo mass to be (21) M⊙ (Wechsler et al., 2002; Chiang et al., 2013), about twice as large as the Coma Supercluster (which has a mass of 11015 M⊙). Note that this dark matter halo mass estimation method differs from others which assume linear bias and spherical collapse models (Mo & White, 1996; Peacock, 1999) which we suggest are not applicable to filamentary structures.
Some works (Chapman et al., 2009; Miller et al., 2015) suggest that significant over-densities in DSFGs do not trace massive proto-clusters. They argue that such significant over-densities are due to “merger bias” whereby the submillimeter-luminous phase is too short-lived and rare to be a useful probe of the most massive halos at high-. Indeed, there are several massive proto-clusters at that contain no DSFGs, and some structures of only moderate mass which appear to contain a few DSFGs (Capak et al., 2011; Hodge et al., 2012; Walter et al., 2012). The Miller et al. (2015) work argues that DSFG over-densities are poor tracers of the most massive over-densities at high-redshift because Poisson noise dominates for low numbers of DSFGs. While this is likely the case for 1–3 DSFGs, our results (and our interpretation of their Figure 3) imply that the opposite is actually true for sufficiently large numbers of DSFGs per proto-cluster. Instead we suggest that spectroscopic incompleteness in both LBG and submillimeter samples around high- proto-clusters has potentially hindered the discovery of more starburst-enriched and AGN-enriched proto-clusters. If this is the case, aggressive spectroscopic follow-up of DSFGs might substantially help the effort to identify high- proto-cluster environments, where the spectroscopic investment needed for LBG samples is prohibitive on large scales (i.e. identification of 40 spectroscopically-identified LBGs, with a resulting ). With the identification of four 20–30 arcminute-scale over-densities containing 6 DSFGs (HDF, PCL1002 and SSA22) in only a few degrees of deep submillimeter surveys, the potential to identify further massive cluster progenitors via their member DSFGs and AGN is quite promising.
4. Discussion & Conclusions
The over-abundance of what are thought to be short-duration, 100 Myr, phenomena (both DSFGs and luminous AGN; Bothwell et al., 2013; Marconi et al., 2004) in an extended proto-cluster structure is conspicuously rare. Even scaling density estimates proportional to the LBG overenhancement, the DSFG/AGN presence is excessive. The extra DSFG/AGN can be explained with only two possible physical interpretations: either the DSFGs and AGN are short-lived and triggered simultaneously via a process related to the over-dense environment or the DSFGs and AGN must be much longer lived than expected by existing observations of similar phenomena in the field.
The evidence we present here is suggestive of the former, that DSFGs and AGN are short-lived, and in that case, their triggering must be environmentally driven. This is supported by the increased interaction fraction seen in proto-cluster members’ optical morphologies, larger ISM masses in proto-cluster members (albeit a marginal distinction requiring confirmation), and the lack of physical motivation for long QSO lifetimes (Martini, 2004; Hopkins & Hernquist, 2009) beyond the increased gas-feeding argument often argued for DSFGs. If correct, these observations provide the first concrete evidence that environmental triggering can occur over extraordinarily large volumes (15000 Mpc3 comoving) at .
It should be noted that the structure’s member LBGs do not appear to have sufficiently different observational characteristics than LBGs in the field. Comparison against the control sample indicates that proto-cluster LBGs have slightly higher stellar masses (by a factor of 1.50.3) and similar star-formation rates. Nevertheless, as a sheer consequence of their number, LBGs dominate the calculation of the structure’s net dark matter halo mass which is estimated to be significant at 81013 M⊙. This is predicted to mature to a few M⊙at .
Cosmological dark-matter simulations suggest that today’s most massive clusters occupied volumes several hundred times larger (Oñorbe et al., 2014) at , having not yet virialized into the compact structures we see today. PCL1002 affirms these predictions, as its 15000 Mpc3 volume is predicted to collapse to a volume of 50 Mpc3 at , which is consistent with all nearby M⊙ clusters. While this confirms the notion of a genuine massive cluster in formation, this volume-scaling also implies that most clusters will have similarly large sizes at , subtending areas half a degree across on the sky. Observationally isolating massive clusters in formation then comes down to accurate redshift identification to within , because other observational characteristics are not sufficiently environmentally distinct at these epochs.
Identifying and correctly classifying PCL1002 as a massive galaxy cluster progenitor would not have been possible without the concentrated presence of cosmologically rare phenomena like dusty starbursts and luminous AGN. Future large and deep 100 deg2 submillimeter surveys could play a crucial part in statistically characterizing the population of such large structures during their formation epoch, as groups of DSFGs and luminous AGN can act as signposts to the largest mass concentrations. Equally important is complete spectroscopic follow-up at over those wide-areas, like large optical campaigns similar to HETDEX (Chiang et al., 2014) and potential future large millimeter line searches targeting CO or [Cii] with a wide-bandwidth spectrometer. The discovery of more high-, starbursting over-densities will be inevitable, but it will be the constraints on their volume density and assembly timescale that will have significant repercussions on cosmological hydrodynamic simulations and the formation mechanisms of the Coma-like superclusters we see today.
References
- Alexander et al. (2005) Alexander, D. M., Bauer, F. E., Chapman, S. C., Smail, I., Blain, A. W., Brandt, W. N., & Ivison, R. J. 2005, ApJ, 632, 736
- Behroozi et al. (2013) Behroozi, P. S., Wechsler, R. H., & Conroy, C. 2013, ApJ, 770, 57
- Blain et al. (2004) Blain, A. W., Chapman, S. C., Smail, I., & Ivison, R. 2004, ApJ, 611, 725
- Bothwell et al. (2013) Bothwell, M. S., et al.2013, MNRAS, 429, 3047
- Capak et al. (2011) Capak, P. L., et al.2011, Nature, 470, 233
- Casey (2012) Casey, C. M. 2012, MNRAS, 425, 3094
- Casey et al. (2013) Casey, C. M., et al. 2013, MNRAS, 436, 1919
- Casey et al. (2014) Casey, C. M., Narayanan, D., & Cooray, A. 2014, Phys. Rep., 541, 45
- Chabrier (2003) Chabrier, G. 2003, PASP, 115, 763
- Chapman et al. (2009) Chapman, S. C., Blain, A., Ibata, R., Ivison, R. J., Smail, I., & Morrison, G. 2009, ApJ, 691, 560
- Chiang et al. (2013) Chiang, Y.-K., Overzier, R., & Gebhardt, K. 2013, ApJ, 779, 127
- Chiang et al. (2014) —. 2014, ApJ, 782, L3
- Chiang et al. (2015) Chiang, Y.-K., et al. 2015, ArXiv e-prints
- Civano et al. (2012) Civano, F., et al. 2012, ApJS, 201, 30
- Cooper et al. (2008) Cooper, M. C., Tremonti, C. A., Newman, J. A., & Zabludoff, A. I. 2008, MNRAS, 390, 245
- Coppin et al. (2015) Coppin, K. E. K., et al. 2015, MNRAS, 446, 1293
- da Cunha et al. (2008) da Cunha, E., Charlot, S., & Elbaz, D. 2008, MNRAS, 388, 1595
- Dannerbauer et al. (2014) Dannerbauer, H., et al. 2014, A&A, 570, A55
- Diener et al. (2013) Diener, C., et al. 2013, ApJ, 765, 109
- Diener et al. (2015) Diener, C., et al. 2015, ApJ, 802, 31
- Eadie et al. (1971) Eadie, W. T., Drijard, D., & James, F. E. 1971, Statistical methods in experimental physics
- Elbaz et al. (2007) Elbaz, D., et al. 2007, A&A, 468, 33
- Fanaroff & Riley (1974) Fanaroff, B. L. & Riley, J. M. 1974, MNRAS, 167, 31P
- Hainline et al. (2011) Hainline, L. J., Blain, A. W., Smail, I., Alexander, D. M., Armus, L., Chapman, S. C., & Ivison, R. J. 2011, ApJ, 740, 96
- Hodge et al. (2012) Hodge, J. A., Carilli, C. L., Walter, F., de Blok, W. J. G., Riechers, D., Daddi, E., & Lentati, L. 2012, ApJ, 760, 11
- Hopkins & Hernquist (2009) Hopkins, P. F. & Hernquist, L. 2009, ApJ, 698, 1550
- Huchra & Geller (1982) Huchra, J. P. & Geller, M. J. 1982, ApJ, 257, 423
- Ilbert et al. (2013) Ilbert, O., et al. 2013, A&A, 556, A55
- Kartaltepe et al. (2012) Kartaltepe, J. S., et al. 2012, ApJ, 757, 23
- Kennicutt (1998) Kennicutt, Jr., R. C. 1998, ARA&A, 36, 189
- Kocevski et al. (2012) Kocevski, D. D., 2012, ApJ, 744, 148
- Lee et al. (2013) Lee, N., et al.2013, ApJ, 778, 131
- Lentati et al. (2015) Lentati, L., et al. 2015, ApJ, 800, 67
- Lilly et al. (2009) Lilly, S. J., et al. 2009, ApJS, 184, 218
- Marconi et al. (2004) Marconi, A., Risaliti, G., Gilli, R., Hunt, L. K., Maiolino, R., & Salvati, M. 2004, MNRAS, 351, 169
- Martini (2004) Martini, P. 2004, Coevolution of Black Holes and Galaxies, 169
- Miller et al. (2015) Miller, T. B., Hayward, C. C., Chapman, S. C., & Behroozi, P. S. 2015, ArXiv e-prints
- Mo & White (1996) Mo, H. J. & White, S. D. M. 1996, MNRAS, 282, 347
- Moster et al. (2013) Moster, B., Naab, T., & White, S. D. M. 2013, MNRAS, 428, 312
- Oñorbe et al. (2014) Oñorbe, J., Garrison-Kimmel, S., Maller, A. H., Bullock, J. S., Rocha, M., & Hahn, O. 2014, MNRAS, 437, 1894
- Peacock (1999) Peacock, J. A. 1999, Royal Society of London Philosophical Transactions Series A, 357, 133
- Schinnerer et al. (2007) Schinnerer, E., et al. 2007, ApJS, 172, 46
- Scoville et al. (2014) Scoville, N., et al. 2014, ApJ, 783, 84
- Silverman et al. (2008) Silverman, J. D., et al. 2008, ApJ, 679, 118
- Steidel et al. (1998) Steidel, C. C., Adelberger, K. L., Dickinson, M., Giavalisco, M., Pettini, M., & Kellogg, M. 1998, ApJ, 492, 428
- Venemans et al. (2007) Venemans, B. P., et al. 2007, A&A, 461, 823
- Viero et al. (2013) Viero, M. P., et al. 2013, ApJ, 772, 77
- Walter et al. (2012) Walter, F., et al. 2012, Nature, 486, 233
- Webb et al. (2003) Webb, T. M., et al. 2003, ApJ, 582, 6
- Wechsler et al. (2002) Wechsler, R. H., Bullock, J. S., Primack, J. R., Kravtsov, A. V., & Dekel, A. 2002, ApJ, 568, 52