The Many Faces of Graph Dynamics
Abstract
The topological structure of complex networks has fascinated researchers for several decades, resulting in the discovery of many universal properties and reoccurring characteristics of different kinds of networks. However, much less is known today about the network dynamics: indeed, complex networks in reality are not static, but rather dynamically evolve over time.
Our paper is motivated by the empirical observation that network evolution patterns seem far from random, but exhibit structure. Moreover, the specific patterns appear to depend on the network type, contradicting the existence of a “one fits it all” model. However, we still lack observables to quantify these intuitions, as well as metrics to compare graph evolutions. Such observables and metrics are needed for extrapolating or predicting evolutions, as well as for interpolating graph evolutions.
To explore the many faces of graph dynamics and to quantify temporal changes, this paper suggests to build upon the concept of centrality, a measure of node importance in a network. In particular, we introduce the notion of centrality distance, a natural similarity measure for two graphs which depends on a given centrality, characterizing the graph type. Intuitively, centrality distances reflect the extent to which (non-anonymous) node roles are different or, in case of dynamic graphs, have changed over time, between two graphs.
We evaluate the centrality distance approach for five evolutionary models and seven real-world social and physical networks. Our results empirically show the usefulness of centrality distances for characterizing graph dynamics compared to a null-model of random evolution, and highlight the differences between the considered scenarios. Interestingly, our approach allows us to compare the dynamics of very different networks, in terms of scale and evolution speed.
Keywords: Network dynamics, Graph evolution.
pacs:
89.20.Ff: Computer science and technology, 05.10.-a: Computational methods in statistical physics and nonlinear dynamics1 Introduction
How do real-world networks evolve with time? While empirical studies provide many intuitions and expectations, many questions remain open. In particular, we lack tools to characterize and quantitatively compare temporal graph dynamics. In turn, such tools require good observables to quantify the (temporal) relationships between networks.
In particular, the few network dynamics models that currently exist are often oblivious of the network type. This is problematic, as complex networks come in many different flavors, including social networks, biological networks, or physical networks. It seems highly unlikely that these very different graphs evolve in a similar manner.
A natural prerequisite to measure evolutionary distances are good metrics to compare graphs. The classic similarity measure for graphs is the Graph Edit Distance (GED) [1]: the graph edit distance between two graphs and is defined as the minimal number of graph edit operations that are needed to transform into . The specific set of allowed graph edit operations depends on the context, but typically includes node and link insertions and deletions. While graph edit distance metrics play an important role in computer graphics and are widely applied to pattern analysis and recognition, GED is not well-suited for measuring similarities of networks in other contexts [2]: the set of graphs at a certain graph edit distance from a given graph exhibit very diverse characteristics and seem unrelated; being oblivious to semantics, the GED does not capture any intrinsic structure typically found in real-world networks.
A similarity measure that takes into account the inherent structure of a graph may however have many important applications. A large body of work on graph similarities focusing on a variety of use cases have been developed in the past (see our discussion in Section 6). Depending on the context in which they are to be used, one or another is more suitable. In particular, we argue that graph similarities and graph distance measures are also an excellent tool for the analysis, comparison and prediction of temporal network traces, allowing us to answer questions such as: Do these two networks have a common ancestor? Are two evolution patterns similar? or What is a likely successor network for a given network? However, we argue that in terms of graph similarity measures, there is no panacea: rather, graphs and their temporal patterns, come with many faces. Accordingly, we in this paper, propose to use a parametric, centrality-based approach to measure graph similarities and distances, which in turn can be used to study the evoluation of networks.
More than one century ago, Camille Jordan introduced the first graph centrality measure in his attempt to capture “the center of a graph”. Since then the family of centrality measures has grown larger and is commonly employed in many graph-related studies. All major graph-processing libraries commonly export functionality for degree, closeness, betweenness, clustering, pagerank and eigenvector centralities. In the context of static graphs, centralities have proven to be a powerful tool to extract meaningful information on the structure of the networks, and more precisely on the role every participant (node) has in the network. In social network analysis, centralities are widely used to measure the importance of nodes, e.g., to determine key players in social networks, or main actors in the propagation of diseases, etc.
Today, there is no consensus on “good” and “bad” centralities: each centrality captures a particular angle of a node’s topological role, some of which can be either crucial or insignificant, depending on the application. Am I important because I have many friends, because I have important friends, or because without me, my friends could not communicate together? The answer to this question is clearly context-dependent.
In this paper, we argue that the perceived quality of network similarities or distances measuring the difference between two networks depends on the focus and application just as much. Instead of debating the advantages and disadvantages of a set of similarities and distances, we provide a framework to apply them to characterize network evolution from different perspectives. In particular, we leverage centralities to provide a powerful tool to quantify network changes. The intuition is simple: to measure how a network evolves, we measure the change of the nodes’ roles and importance in the network, by leaving the responsibility to quantify node importance to centralities.
Our Contributions
This paper is motivated by the observation that centralities can be useful to study the dynamics of networks over time, taking into account the individual roles of nodes (in contrast to, e.g., isomorphism-based measures, as they are used in the context of anonymous graphs), as well as the context and semantics (in contrast to, e.g., graph edit distances). In particular, we introduce the notion of centrality distance for two graphs , a graph similarity measure based on a node centrality .
We demonstrate the usefulness of our approach to identify and characterize the different faces of graph dynamics. To this end, we study five generative graph models and seven dynamic real world networks in more details. Our evaluation methodology comparing the quality of different similarity measures to a random baseline using data from actual graph evolutions, may be of independent interest.
In particular, we demonstrate how centrality distances provide interesting insights into the structural evolution of these networks and show that actual evolutionary paths are far from being random. Moreover, we build upon the centrality distance concept to construct dynamic graph signatures. The intuition is simple: we measure the probability of an update to be considered as an outlier compared to a uniformly random evolution. This allows us to quantify the deviation of a given dynamic network from a purely random evolution (our null-model) of the same structure for a set of centrality distances. The signature consisting of the resulting deviation values enables the comparison of different dynamisms on a fair basis, independently from scale and sampling considerations.
Examples
To motivate the need for tools to analyse network evolution, we consider two simple examples.
Example 1. [Local/Global Scenario] Consider three graphs , , over five nodes : is a line, where and are connected; is a cycle, i.e., with an additional link ; and is with an additional link . In this example, we first observe that and have the same graph edit distance to : , as they contain one additional edge. However, in a social network context, one would intuitively expect to be closer to than . For example, in a friendship network a short-range “triadic closure” [3] link may be more likely to emerge than a long-range link: friends of friends may be more likely to become friends themselves in the future. Moreover, more local changes are also expected in mobile environments (e.g., under bounded human mobility and speed). As we will see, the centrality distance concept of this paper can capture such differences.
Example 2. [Evolution Scenario] As a second synthetic example, consider two graphs and , where is a line topology and is a “shell network” (see also Figure 1). How can we characterize evolutionary paths leading from the topology to ? Note that the graph edit distance does not provide us with any information about the likelihood or the role changes of evolutionary paths from to , i.e., on the order of edge insertions: there are many possible orders in which the missing links can be added to , and these orders do not differ in any way when comparing them with the graph edit distance. In reality, however, we often have some expectations on how a graph may have evolved between two given snapshots and . For example, applying the triadic closure principle to our example, we would expect that the missing links are introduced one-by-one, from left to right.
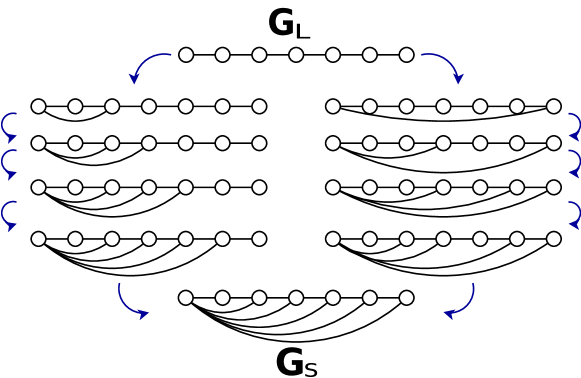
The situation may look different in technological, man-made networks. Adding links from left to right only slowly improves the “routing efficiency” of the network: after the addition of edges from left to right, the longest shortest path is hops, for . A more efficient evolution of the network is obtained by connecting to the furthest node, adding links to the middle of the network, resulting in a faster distance reduction: after edge insertions, the distance is roughly reduced by a factor .
Thus, different network evolution patterns can be observed in real networks. Instead of defining application-dependent similarities with design choices focusing on which evolution patterns are more expected from a certain network, we provide a framework that allows the joint characterization of graph dynamics along different axes.
Organization
The remainder of this paper is organized as follows. Section 2 provides the reader with the necessary background. Section 3 introduces our centrality distance framework and Section 4 our methodology to study the different graph dynamics empirically. Section 5 reports on results from analyzing real and generated networks. After reviewing related work in Section 6, we conclude our contribution in Section 7.
2 Preliminaries
This paper considers labeled graphs , where vertices have unique identifiers and are connected via undirected edges . In the following, we denote as the set of neighbors of node : . A temporal network trace is a sequence , where represents the network at the snapshot.
We focus on node centralities, a centrality being a real-valued function assigning “importance values” to nodes. Obviously, the notion of importance is context-dependent, which has led to many different definitions of centralities. We refer to [4] for a thorough and formal discussion on centralities.
Definition 1 (Centrality)
A centrality is a function that, given a graph and a vertex , returns a non-negative value . The centrality function is defined over all vertices of a given graph .
By convention, we define the centrality of a node without edges to be 0. We write to refer to the vector in where the element is for a given order of the identifiers.
Centralities are a common way to characterize networks and their vertices. Frequently studied centralities include the degree centrality (DC), the betweenness centrality (BC), the closeness centrality (CC), and the pagerank centrality (PC) among many more. A node is DC-central if it has many edges: the degree centrality is simply the node degree; a node is BC-central if it is on many shortest paths: the betweenness centrality is the number of shortest paths going through the node; a node is CC-central if it is close to many other nodes: the closeness centrality measures the inverse of the distances to all other nodes; and a node is PC-central if the probability that a random walk on visits this node is high. We use the classical definitions for centralities, and the exact formulas are presented in A for the sake of completeness.
Finally, throughout this paper, we will define the graph edit distance GED between two graphs and as the minimum number of operations to transform into (or vice versa), where an operation is one of the following: link insertion and link removal.
3 Centrality Distance
The canonical distance measure is the graph edit distance, GED. However, GED often provides limited insights into the graph dynamics in practice. Figure 1 shows an example with two evolutionary paths: an incremental (left) and a binary (right) path that go from to . With respect to GED, there are many equivalent shortest paths for moving from to . However, intuitively, not all traces are equally likely for dynamic networks, as the structural roles that nodes in networks have are often preserved and do not change arbitrarily. Clearly, studying graph evolution with GED thus cannot help us to understand how structural properties of graphs evolve.
Observation 1
The graph edit distance GED does not provide much insights into graph evolution.
We in this paper aim to enrich the graph similarity measure with semantics. At the heart of our approach lies the concept of centrality distance: a simple and flexible tool to study the similarity of graphs. Essentially, the centrality distance measures the similarity between two centrality vectors. It can be used to measure the distance between two arbitrary graphs, not only between graphs with graph edit distance 1.
Definition 2 (Centrality Distance)
Given a centrality , we define the centrality distance between any two graphs as the sum of the node-wise difference of the centrality values:
Thus, the centrality distance intuitively measures the magnitude by which the roles of different nodes change. While we focus on the 1-norm in this paper, the concept of centrality distance can be useful also for other norms.
Both the importance of node roles as well as the importance of node role changes is application-dependent. Due to the large variety of processes dynamic graphs can capture, there is no one-size-fits-it-all measure of importance. To illustrate this point, let us consider the “intuitive” similarity properties proposed by Faloutsos et al. [5]. For instance, the proposed edge importance property should penalize changes that create disconnected components more than changes that maintain the connectivity properties of the graphs. Now imagine a cycle graph of 100 nodes , and a single additional node connected to . According to the proposed edge importance property the most important link is . Indeed, it is the only link whose removal would create a disconnected component (containing alone). Yet the removal of any other link would double the diameter of the structure. Or in an information dissemination network all nodes would have to update half of their routing tables. So which link is more important? The answer clearly depends on the context. Similar examples can be found for other properties proposed in [5], e.g., regarding submodularity and focus-awareness. Not only are these properties hard to formalize, their utility varies from application to application.
We conclude by noting that given two centralities and and two arbitrary graphs and with nodes, the respective distances are typically different, i.e., . Hence, using a set of different centrality distances, we can explore the variation of the graph dynamics in more than one “dimension”.
4 Methodology
In order to characterize the different faces of graph dynamics and to study the benefits of centrality-based measures, we propose a simple methodology. Intuitively, given a centrality capturing well the roles of different nodes in a real-world setting, we expect the centrality distance between two consecutive graph snapshots and to be smaller than the typical distance from to other graphs that have the same GED.
To verify this intuition, we define a null model for evolution. A null model generates networks using patterns and randomization, i.e., certain elements are held constant and others are allowed to vary stochastically. Ideally, the randomization is designed to mimic the outcome of a random process that would be expected in the absence of a particular mechanism [6]. Applied to our case, this means that starting from a given snapshot that represents the fixed part of the null model, if the evolution follows a null model, then any graph randomly generated from at the given GED is evenly likely to appear.
Concretely, for all consecutive graph pairs and of a network trace, we determine the graph edit distance (or “radius”) . Then, we generate a set of sample graphs at the same GED from uniformly at random. That is, to create , we first start from a copy of and select node pairs, , uniformly at random. For each of these pairs we add the edge to if it does not exist in or we remove it if it was in originally. Such randomly built sample graphs at the same graph edit distance allow us to assess the impact of a uniformly random evolution of the same magnitude from the same starting graph : In other words, is the pattern and the evolution to at graph edit distance is the randomized part of the null model111This is the least constrained randomization of network evolution w.r.t. the graph edit distance. More refined null models may preserve other structural graph properties in the sample graphs, e.g., their densities. B describes results obtained for a null model that guarantees the average degree of in the sample graphs..
As a next step, given a centrality , we compare with the set that samples the evolution following the null model. We consider that does not follow the null model if it is an outlier in the set for the centrality . Practically, is considered an outlier if the absolute value of its distance from minus the mean distance of to is at least twice the standard deviation, i.e., if
Given a temporal trace , we define as the fraction of outliers in the trace for centrality . An ensemble of such values for a set of centralities is called a dynamic signature of .
5 Experimental Case Studies
Based on our centrality framework and methodology, we can now shed some light on the different faces of graph dynamics, using real world data sets.
-
•
Caida (AS): This data captures the Autonomous Systems relationships as captured by the Caida project. Each of the snapshots represents the daily interactions of the first AS identifiers from August 1997 until December 1998 [7].
-
•
ICDCS (ICDCS): We extracted the most prolific authors in the ICDCS conference (IEEE International Conference on Distributed Computing Systems) and the co-author graph they form from the DBLP publication database (http://dblp.uni-trier.de). This trace contains 33 snapshots of 691 nodes and 1076 collaboration edges. The timestamp assigned to an edge corresponds to the first ICDCS paper the authors wrote together. Clearly, the co-authorship graph is characterized by a strictly monotonic densification over time.
-
•
UCI Social network (UCI): The third case study is based on a publicly available dataset [8], capturing all the messages exchanges realized on an online Facebook-like social network between 1882 students at University of California, Irvine over 7 months. We discretized the data into a dynamic graph of 187 time steps representing the daily message exchanges among users.
-
•
Hypertext (HT): Face-to-face interactions of the ACM Hypertext 2009 conference attendees. 113 participants were equipped with RFID tags. Each snapshot represents one hour of interactions [7].
-
•
Infectious (IN): Face-to-face interactions of the “Infectious: Stay away” exhibition held in 2009. 410 Participants were equipped with RFID tags. Each snapshot represents 5 minutes of the busiest exhibition day [7].
-
•
Manufacture (MA): Daily internal email exchange network of a medium-size manufacturing company (167 nodes) over 9 months of 2010 [7].
- •
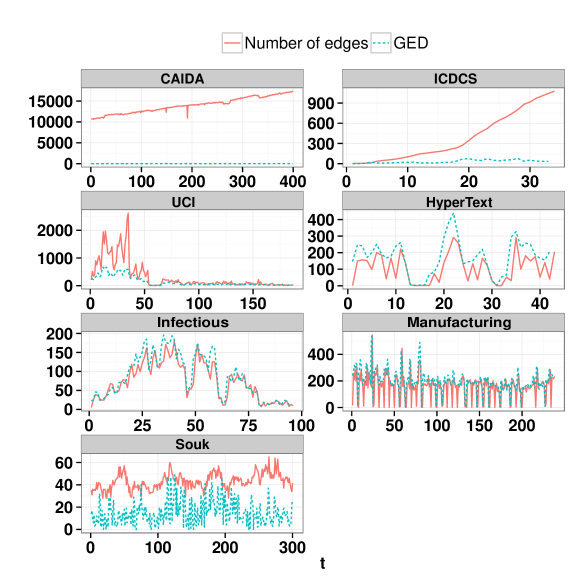
Figure 2 provides a temporal overview on the evolution of the number of edges in the network and the GED between consecutive snapshots. Some of the seven datasets exhibit very different dynamics: one can observe the time-of-day effect of attendees interactions on Hypertext, and the day-of-week effect on Manufacture. UCI, Hypertext, Infectious and Manufacture all exhibit a high level of dynamics with respect to their number of links. This is expected for Infectious, as visitors come and leave regularly and rarely stay for long, but rather surprising for Manufacture.
The density of Caida slowly increases, and with a steady GED. Similarly, the number of co-author edges of ICDCS steadily increases over the years, while the number of new edges per year is relatively stable. The number of days of the conference Hypertext and the fact that conference participants sleep during the night and do not engage in social activity is evident in the second trace. The dynamic pattern of the online social network UCI has two regimes: it has a high dynamics for the first 50 timestamps, and is then relatively stable, whereas Souk exhibits a more regular dynamics. Generally, note that GED can be at most twice as high as the maximal edge count of two consecutive snapshots.
5.1 Centrality Distances over Time
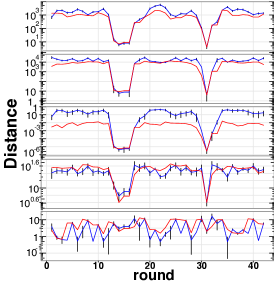
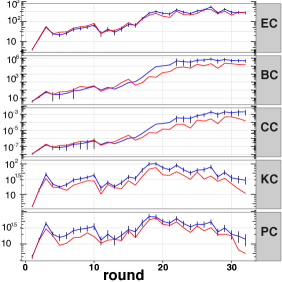
Hypertext Infectious ICDCS
Figure 3 presents examples of the results of our comparison of random graphs with the same graph edit distance GED as real-world network traces. The red dashed lines represent the centrality distances of and . The distribution of values from to the randomly sampled graphs of is represented as follows: the blue line is the median, while the gray lines represent the outlier detection window.
For most graphs under investigation and for most centralities it holds that the induced centrality distance between and is often lower than between and an arbitrary other graph with the same distance. There are however a few noteworthy details.
Hypertext and Infectious exhibit very similar dynamics compared from a GED perspective as shown in Figure 2. Yet from the other centralities’ perspective, their dynamism is very different. Consider for instance Infectious for PC, where the measured distance is consistently an order of magnitude less than the sampled one. This can be understood from the link creation mechanics: in Infectious, visitors at different time periods never meet. By connecting these in principle very remote visitors, the null model dynamics creates highly important links. This does not happen in Hypertext where the same group of researchers meet repeatedly. In the monotonically growing co-authorship network of ICDCS, we can observe that closeness and (ego) betweenness distances grow over time, which is not the case for the other networks in Figure 3.
When looking at other centrality distances, we observe that even though the local structure changes, a different set of properties remains mostly unaltered across different networks. Moreover, for some (graph, distance) pairs, like KC on ICDCS, CC on Hypertext, or PC on Infectious, the measured distance is orders of magnitude lower than the median of the sampled ones. This underlines a clear difference between random evolution and the observed one from this centrality perspective: the link update dynamics is biased.
5.2 Dynamics Signature
Figure 4 summarizes the signatures for applied to 7 real and 5 synthetic graphs in the form of a histogram chart—for synthetic graphs, each point is the average of 50 independent realizations of the model, and . That is, each chart represents the probability of having graph evolutions being outliers with respect to the null model for the corresponding centralities. Interestingly, this “distinction ratio” is not uniform among datasets. On Caida, Infectious and UCI, the ratio is high for local centralities such as PageRank and Clustering, and low for global centralities such as Closeness or Betweenness. On the contrary, Hypertext and Manufacture exhibit large ratios for global centralities and small ratios for local centralities. Both local and global centralities perform well on Souk. The difference of these behaviors show that these graphs adhere to different types of dynamics.
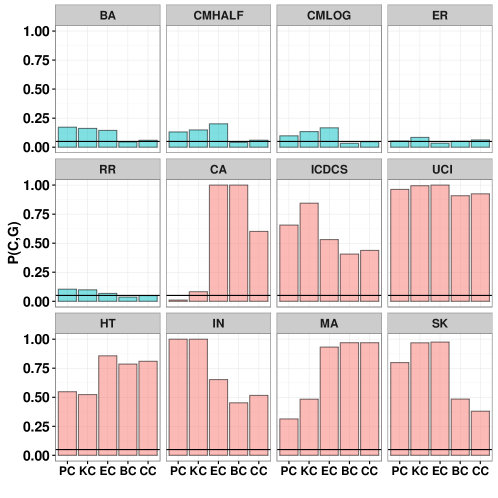
To complement our observations on real networks with graph snapshots produced according to a model, we investigated graph traces generated by some of the most well-known models: Erdős-Rényi ER [10], random regular RR [12], Barabasi-Albert BA [13] and preferential attachment [14] graphs with an equal number of node and edge events (CMHALF) and with the number of node events depending logarithmically on the time (CMLOG). Perhaps the most striking observation is that all tested dynamic network models have low values for all . This is partly due to the fact that the graph edit distance between two subsequent snapshots is one and thus the centrality vectors do not vary as much as between the snapshots and the sampled graphs of the same graph edit distance for the real networks. Moreover, these randomized synthetic models are closer to the null model, and lack some of the characteristics (like link locality) of real world networks. Furthermore, we observe that each random network model exhibits distinct dynamics signatures, with ER being closest to the null model.
6 Related Work
To the best of our knowledge, our paper is the first to combine the concepts of centralities and graph distances. In the following, we review related work in the two fields in turn, and subsequently discuss additional literature on dynamic graphs.
Graph characterizations and centralities. Graph structures are often characterized by the frequency of small patterns called motifs [15, 16, 17, 18], also known as graphlets [19], or structural signatures [20]. Another important graph characterization, which is studied in this paper, are centralities [21]. Dozens of different centrality indices have been defined over the last years, and their study is still ongoing, with no unified theory yet. We believe that our centrality distance framework can provide new inputs for this discussion.
Graph similarities and distances. Graph edit distances have been used extensively in the context of inexact graph matchings in the field of pattern analysis. We refer the reader to the good survey by Gao et al. [1]. Soundarajan et al [22] compare twenty network similarities for anonymous networks. They distinguish between comparison levels (node, community, network level) and identify vector-based, classifier-based, and matching-based methods. Surprisingly they are able to show that the results of many methods are highly correlated. NetSimile [23] allows to assess the similarity between networks, possibly with different sizes and no overlaps in nodes or links. NetSimile uses different social theories to compute similarity scores that are size-invariant, enabling mining tasks such as clustering, visualization, discontinuity detection, network transfer learning, and re-identification across networks. The Deltacon method [5] is based on the normed difference of node-to-node affinity according to a Belief Propagation method. More precisely, the similarity between two graphs is the Root Euclidean Distance of their two affinity matrices or an approximation thereof. The authors provide three axioms that similarities should satisfy and demonstrate using examples and simulations that their similarity features the desired properties of graph similarity functions. Our work can be understood as an attempt to generalize the interesting approach by Faloutsos et al. in [5], which derives a distance from a normed matrix difference, where each element depends on the relationships among the nodes. In particular, are argue that there is no one-size-fits-it-all measure, and propose an approach parametrized by centralities. Interestingly, we also prove that distances derived in our framework satisfy the axioms postulated in [5].
Dynamic graphs. Among the most well-known evolutionary patterns are the shrinking diameter and densification [24]. A lot of recent work studies link prediction algorithms [25, 26, 27]. Others focus on methods for finding frequent, coherent or dense temporal structures [28, 29, 30], or the evolution of communities and user behavior [31, 32].
Another line of research attempts to extend the concept of centralities to dynamic graphs [33, 34, 35, 36]. Some researchers study how the importance of nodes changes over time in dynamic networks [36]. Others define temporal centralities which to rank nodes in dynamic networks and study their distribution over time [34, 35]. Time centralities which describe the relative importance of time instants in dynamic networks are proposed in [33]. In contrast to this existing body of work, our goal is to facilitate the direct comparison of entire networks and their dynamics, not only parts thereof.
A closely related work but using a different approach is by Kunegis [37]. Kunegis studies the evolution of networks from a spectral graph theory perspective. He argues that the graph spectrum describes a network on the global level, whereas eigenvectors describe a network at the local level, and uses these results to devise link prediction algorithms.
Bibliographic note. An early version of this work appeared at the ACM FOMC 2013 workshop [38].
7 Conclusion
This paper was motivated by the observation that in terms of graph similarity measures, there is no “one size fits it all”. In particular, we have proposed a centrality-based distance measure, and introduced a simple methodology to study the different faces of graph dynamics. Indeed, our experiments confirm that the evolution patterns of dynamic networks are not universal, and different networks need different centrality distances to describe their behavior. We observe that the edges in networks represent structural characteristics that are inherently connected to the roles of the nodes in these networks. These structures are maintained under changes, which explains the inertia of centrality distance which capture these properties. This behavior can be used to distinguish between natural and random network evolution. After analyzing a temporal network trace with a set of distance centralities, one can guess with confidence for future snapshots if they belong to the trace.
We believe that our work opens a rich field for future research. In this paper, we focused on five well-known centralities and their induced distances, and showed that they feature interesting properties when applied to the use case of dynamic social networks. However, we regard our approach as a similarity framework, which can be configured with various additional centralities and metrics, which may not even be restricted by distance metrics, but can be based on the angles between centrality vectors or use existing correlation metrics (e.g., Pearson correlation, Tanimoto coefficient, log likelihood). Finally, exploiting the properties of centrality distances, especially their ability to distinguish and quantify between similar evolutionary traces, also opens the door to new applications, such as graph interpolation (what is a likely graph sequence between two given snapshots of a trace) and extrapolation, i.e., for link prediction algorithms based on centralities.
8 Acknowledgements
The authors would like to thank Clément Sire for insightful remarks on a previous version of this document.
Appendix A Centrality Definitions
Degree Centrality DC: Recall that is the set of neighbors of a node . The degree centrality is defined as:
Betweenness Centrality BC: Given a pair , let be the number of shortest paths between and , and be the number of shortest paths between and that pass through . The betweenness centrality is:
For consistency reasons, we consider that a node is on its own shortest path, i.e., , and, by convention, . If is not connected, each connected component is treated independently ().
Ego Centrality EC: Let be the subgraph of induced by . The ego centrality is:
Closeness Centrality CC: Let be the length of a shortest path between vertices and in . The closeness centrality is defined as:
Pagerank Centrality PC: Let be a damping factor (e.g., the probability that a random person clicks on a link [39]). The pagerank centrality of is defined as:
Cluster Centrality KC: The cluster centrality of a node is the cluster coefficient of , i.e., the number of triangles in which is involved divided by all possible triangles in ’s neighborhood. By convention, for , and for . For higher degrees:
Appendix B Alternate Null Model Preserving Average Degree
We present here some additional results related to an alternative choice of the null model. As described in the article, we base our methodology on a uniformly random evolutionary null model that is based on the graph edit distance and hence may not preserve some of intrinsic characteristics of networks under study, such as their density.
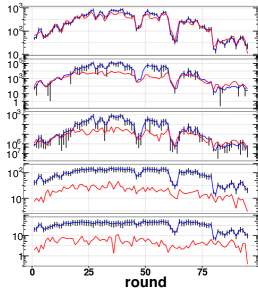
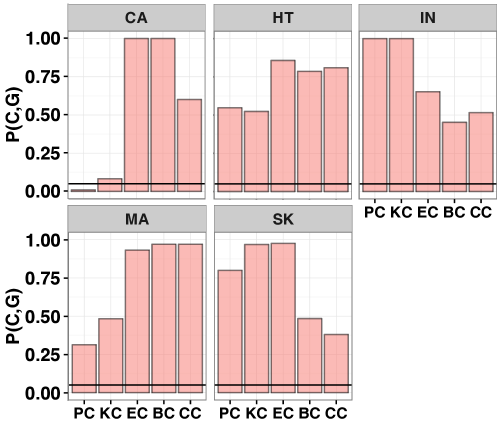
To complete our study, Figure 5 provides the results of applying the methodology described in the article using such an alternative null model. More precisely, we ran the same experiments where the null model is a random process that ensures that the average degree of all sample graphs is the same as for . Figure 6 recalls the results we obtained for the uniformly random null model for comparison.
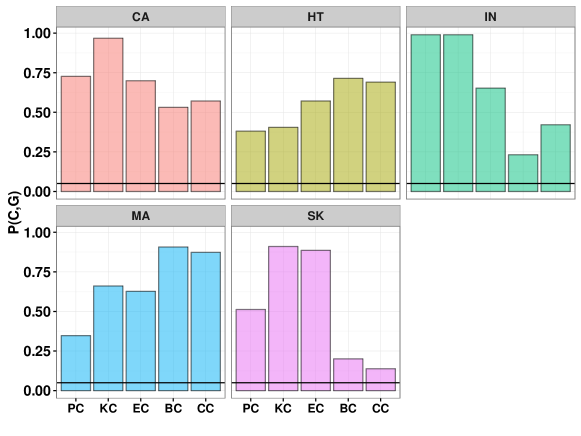
For 4 out of 5 datasets, namely HT (Hypertext conference), IN (Infectious), MA (Manufacture mails) and SK (Souk cocktail), results obtained in both cases are very similar. For all networks the dynamic signatures are strong, in the sense that the networks are outliers for many of the studied centralities and the signatures of different networks vary, illustrating their unique evolution paths. As expected, the ability of the presented method to distinguish the real network evolution compared to the networks generated according to the more refined null model decreases for most network traces and centralities.
Yet, results are strikingly different from the more general null model in the main part of the paper for the case of CA, the Caida dataset. Caida differs from the other datasets in the sense that it does not directly derive from human activity (Caida captures Autonomous Systems relationships), and the density in this dataset is much higher than in other considered datasets, while the graph edit distance between different snapshots does not vary much.
References
- [1] Gao, X., Xiao, B., Tao, D., and Li, X. A survey of graph edit distance. Pattern Anal. Appl. 13, 1 (2010), 113–129.
- [2] Faloutsos, M., Faloutsos, P., and Faloutsos, C. On power-law relationships of the Internet topology. Proc. ACM SIGCOMM (1999).
- [3] Kossinets, G., and Watts, D. J. Empirical analysis of an evolving social network. Science 311, 5757 (2006), 88–90.
- [4] Borgatti, S., and Everett, M. A graph-theoretic perspective on centrality. Social Networks 28, 4 (2006), 466–484.
- [5] Faloutsos, C., Koutra, D., and Vogelstein, J. T. DELTACON: A principled massive-graph similarity function. Proc. 13th SIAM International Conference on Data Mining (SDM) (2013), pp. 162–170.
- [6] Gotelli, N. J., and Graves, G. R. Null models in ecology. online resources (1996).
- [7] Kunegis, J. KONECT – The Koblenz Network Collection. Proc. Int. Conf. on World Wide Web Companion (2013), pp. 1343–1350.
- [8] Opsahl, T., and Panzarasa, P. Clustering in weighted networks. Social networks 31, 2 (2009), 155–163.
- [9] Killijian, M.-O., Roy, M., Trédan, G., and Zanon, C. SOUK: Social Observation of hUman Kinetics. Proc. ACM International Joint Conference on Pervasive and Ubiquitous Computing (UbiComp) (2013).
- [10] Erdős, P., and Rényi, A. On the evolution of random graphs. Publ. Math. Inst. Hungar. Acad. Sci 5 (1960), 17–61.
- [11] Newman, M. E., Watts, D. J., and Strogatz, S. H. Random graph models of social networks. Proceedings of the National Academy of Sciences 99, suppl 1 (2002), 2566–2572.
- [12] Steger, A., and Wormald, N. C. Generating random regular graphs quickly. Combinatorics, Probability and Computing 8, 04 (1999), 377–396.
- [13] Barabási, A.-L., and Albert, R. Emergence of Scaling in Random Networks. Science 286 (1999).
- [14] Chung, F. R., and Lu, L. Complex graphs and networks, vol. 107. American mathematical society Providence, 2006.
- [15] Boccaletti, S., Latora, V., Moreno, Y., Chavez, M., and Hwang, D.-U. Complex networks: Structure and dynamics. Physics Reports 424, 4:5 (2006), 175 – 308.
- [16] Milo, R., Shen-Orr, S., Itzkovitz, S., Kashtan, N., Chklovskii, D., and Alon, U. Network motifs: Simple building blocks of complex networks. SCIENCE (2001).
- [17] Schreiber, F., and Schwöbbermeyer, H. Frequency concepts and pattern detection for the analysis of motifs in networks. Transactions on Computational Systems Biology 3 (2005), 89–104.
- [18] Wernicke, S. Efficient detection of network motifs. IEEE/ACM Trans. Comput. Biol. Bioinformatics 3, 4 (Oct. 2006), 347–359.
- [19] Przulj, N. Biological network comparison using graphlet degree distribution. Bioinformatics (2007).
- [20] Contractor, N. S., Wasserman, S., and Faust, K. Testing multitheoretical organizational networks: An analytic framework and empirical example. Academy of Management Review (2006).
- [21] Brandes, U., and Erlebach, T. Network Analysis: Methodological Foundations. LNCS 3418, Springer-Verlag New York, Inc., 2005.
- [22] Soundarajan, S., Eliassi-Rad, T., and Gallagher, B. A guide to selecting a network similarity method. SIAM.
- [23] Berlingerio, M., Koutra, D., Eliassi-Rad, T., and Faloutsos, C. Network similarity via multiple social theories. Proc. IEEE/ACM International Conference on Advances in Social Networks Analysis and Mining (ASONAM) (2013), pp. 1439–1440.
- [24] Leskovec, J., Kleinberg, J., and Faloutsos, C. Graph evolution: Densification and shrinking diameters. ACM Transactions on Knowledge Discovery from Data (TKDD) 1, 1 (2007), 2.
- [25] Allali, O., Magnien, C., and Latapy, M. Internal link prediction: A new approach for predicting links in bipartite graphs. Intelligent Data Analysis 17, 1 (2013), 5–25.
- [26] Liben-Nowell, D., and Kleinberg, J. The link prediction problem for social networks. Proc. 12th International Conference on Information and Knowledge Management (CIKM) (2003).
- [27] Yang, S. H., Long, B., Smola, A., Sadagopan, N., Zheng, Z., and Zha, H. Like like alike: joint friendship and interest propagation in social networks. Proc. 20th International Conference on World Wide Web (WWW) (2011), pp. 537–546.
- [28] Jin, R., Wang, C., Polshakov, D., Parthasarathy, S., and Agrawal, G. Discovering frequent topological structures from graph datasets. Proc. ACM SIGKDD (2005), ACM, pp. 606–611.
- [29] Shah, N., Koutra, D., Zou, T., Gallagher, B., and Faloutsos, C. Timecrunch: Interpretable dynamic graph summarization. Proc. ACM SIGKDD (2015), ACM, pp. 1055–1064.
- [30] Sun, J., Faloutsos, C., Papadimitriou, S., and Yu, P. S. Graphscope: parameter-free mining of large time-evolving graphs. Proc. ACM SIGKDD (2007), ACM, pp. 687–696.
- [31] Ferlez, J., Faloutsos, C., Leskovec, J., Mladenic, D., and Grobelnik, M. Monitoring network evolution using mdl. Proc. IEEE 24th International Conference on Data Engineering (ICDE) (2008), pp. 1328–1330.
- [32] Zhao, X., Sala, A., Wilson, C., Wang, X., Gaito, S., Zheng, H., and Zhao, B. Y. Multi-scale dynamics in a massive online social network. Proc. ACM Internet Measurement Conference (IMC) (2012), pp. 171–184.
- [33] Costa, E. C., Vieira, A. B., Wehmuth, K., Ziviani, A., and da Silva, A. P. C. Time centrality in dynamic complex networks. arXiv preprint arXiv:1504.00241 (2015).
- [34] Kim, H., and Anderson, R. Temporal node centrality in complex networks. Physical Review E 85, 2 (2012), 026107.
- [35] Lerman, K., Ghosh, R., and Kang, J. H. Centrality metric for dynamic networks. Proc. 8th Workshop on Mining and Learning with Graphs (2010), pp. 70–77.
- [36] Tabirca, T. M., Brown, K. N., and Sreenan, C. J. Snapshot centrality indices in dynamic fifo networks. Journal of Mathematical Modeling and Algorithms 10, 4 (2011), 371–391.
- [37] Kunegis, J. On the spectral evolution of large networks. PhD thesis (2011).
- [38] Roy, M., Schmid, S., and Tredan, G. Modeling and measuring graph similarity: The case for centrality distance. Proc. 10th ACM International Workshop on Foundations of Mobile Computing (FOMC) (2014).
- [39] Page, L., Brin, S., Motwani, R., and Winograd, T. The pagerank citation ranking: Bringing order to the web. Stanford InfoLab; 1999 Nov 11.