ALMA imaging of SDP.81 – II. A pixelated reconstruction of the CO emission lines
Abstract
We present a sub-100 pc-scale analysis of the CO molecular gas emission and kinematics of the gravitational lens system SDP.81 at redshift 3.042 using Atacama Large Millimetre/submillimetre Array (ALMA) science verification data and a visibility-plane lens reconstruction technique. We find clear evidence for an excitation dependent structure in the unlensed molecular gas distribution, with emission in CO (5-4) being significantly more diffuse and structured than in CO (8-7). The intrinsic line luminosity ratio is 0.30 0.04, which is consistent with other low-excitation starbursts at 3. An analysis of the velocity-fields shows evidence for a star-forming disk with multiple velocity components that is consistent with a merger/post-coalescence merger scenario, and a dynamical mass of ( 1.56 kpc) = 1.6 0.6 1010 M⊙. Source reconstructions from ALMA and the Hubble Space Telescope show that the stellar component is offset from the molecular gas and dust components. Together with Karl G. Jansky Very Large Array CO (1-0) data, they provide corroborative evidence for a complex 2 kpc-scale starburst that is embedded within a larger 15 kpc structure.
keywords:
gravitational lensing: strong – galaxies: high redshift – submillimetre: galaxies.1 Introduction
Recent large-area surveys have revealed a population of dusty sub-millimetre (sub-mm) galaxies at high redshift (e.g. Greve et al., 2004; Weiß et al., 2009) that are believed to be the progenitors of present-day massive early-type galaxies (Swinbank et al., 2006). These galaxies are characterized by their extreme far-infrared (FIR) luminosities, considerable stellar masses and large star-formation rates (e.g. Coppin et al. 2008). On the basis of morphological and kinematic studies at ultraviolet (UV) and optical wavelengths, it has been suggested that most of these galaxies are undergoing a major merger event (e.g. Swinbank et al., 2006; Engel et al., 2010). In this scenario, their extreme luminosities are the result of merger-induced star formation. A competing mechanism, in which star formation is predominantly driven by in-falling gas-rich material has also been proposed (e.g. Dekel et al. 2009a; Carilli et al. 2010).
By using high angular-resolution observations of the molecular gas component of these galaxies, it is possible to constrain their kinematic and morphological properties, and establish the origin of their intense star-formation in a way that is neither affected by dust extinction nor biased by outflows (Tacconi et al., 2008; Engel et al., 2010; Karim et al., 2013). While most of these studies have so far been hampered by the limited spatial resolution of the observations, the advent of the Atacama Large Millimetre/submillimetre Array (ALMA) has made it possible to make sensitive studies of sub-mm galaxies on arcsec-scales (Karim et al., 2013). The recent addition of the long baseline capacity of ALMA has further improved the imaging quality (30 to 300 mas resolution; e.g. ALMA Partnership 2015a). At the same time, strong gravitational lensing has allowed the study of high-redshift sub-mm galaxies on 50-100 pc-scales, which is comparable to what is achieved at lower redshift (Swinbank et al., 2010).
In this Letter, we take advantage of the enhanced spatial resolution provided by the long baseline capability of ALMA, in combination with the magnifying power of strong gravitational lensing to study the molecular gas distribution and kinematics of the starburst galaxy SDP.81 (H-ATLAS J090311.6+003906; 3.042 0.001; Negrello et al. 2010, 2014; Frayer et al. 2011; Bussmann et al. 2013; Dye et al. 2014). In a previous paper (Rybak et al. 2015; referred to as Paper I), we presented an analysis of the gravitational lens mass model and a study of the reconstructed heated dust continuum emission at a resolution better than 50 pc. Here, we focus on a detailed analysis of the CO emission line data that were also taken during the science verification of the ALMA long baseline array. These data are coupled with high angular resolution imaging from the Hubble Space Telescope (HST) and Karl G. Jansky Very Large Array (VLA) to investigate the conditions that produced the intense burst of star-formation within SDP.81.
2 Observations & lens modelling
2.1 ALMA CO emission line imaging
The ALMA spectral line observations of SDP.81 and the image processing are discussed in detail by the ALMA Partnership (2015b). To summarize, the CO (5-4), CO (8-7), CO (10-9) and H2O (202-111) transitions were observed for between 4.4 and 5.9 h in Bands 4, 6 and 7. The array consisted of between 22 and 36 antennas with baselines ranging from 15 m to 15 km. During our analysis, we found that the CO (10-9) and H2O emission was too weak to provide reliable velocity and velocity dispersion maps, so we do not consider them further here, and instead we focus on the CO (5-4) and CO (8-7) transitions.
The gravitational lens mass model for SDP.81 was derived in Paper I by applying a Bayesian pixelated modelling technique (Rybak et al., in prep.) to the visibility data of the Band 6 and 7 continuum emission. This lens model is used for the analysis of the CO emission line data here, that is, the lens parameters are kept fixed at the most probable values derived in Paper I, while the emission line structure and its regularization level are left as free parameters. In order to model the two-dimensional spectral maps of the CO lines we first subtracted the continuum emission from the uv-dataset using the line-free channels. As the emission lines are quite broad, we averaged the data by 2 channels resulting in a velocity resolution lines of 41 km s-1 for both lines. This was found to be a reasonable compromise between velocity space sampling (to study the structure of the lines) and signal-to-noise ratio (SNR) for a robust source reconstruction. Also, to limit the number of visibilities used in our analysis and to ensure that we compare the various transitions on the same angular-scale, a 1 M cut in the uv-distance was imposed. For a Briggs weighting scheme with Robust = 0, this corresponds to a synthesised beam with a full width at half-maximum (FWHM) of 180 131 mas at a position angle of 77.7 deg.
2.2 Archival HST-WFC3 infrared imaging
SDP.81 was observed with the Wide Field Camera 3 aboard the HST on 2011 April 4 (GO: 12194; PI: Negrello). The data were taken through the F110W and F160W filters, with exposure times of 712 and 4418 s, respectively (see Negrello et al. 2014 for further details). The HST imaging detected a single dominant lensing galaxy, two gravitational arcs from the background source and extended low-surface brightness structures around the system.
The data were reprocessed using the standard astrodrizzle pipeline (using a pixel size of 65 mas) and the subtraction of the lensing galaxy emission was done using galfit (Peng et al., 2010). The image-plane structure of the HST and ALMA continuum emission (the latter from Paper I) are shown in Fig. 1. Although the arcs are offset, due to their different positions in the source-plane (see below), the separation between the main and counter-arc is the same in both the infrared and mm components, which demonstrates that they are at the same redshift. We model the infrared emission using the pixelated gravitational lensing code of Vegetti & Koopmans (2009). Consistent with previous studies (see Dye et al. 2014, 2015; Tamura et al. 2015; Wong et al. 2015), we find that the infrared emission has a magnification of 11.3 0.1. We discuss the source-plane properties of the rest-frame UV/optical emission, with respect to the dust and gas components, in Section 4.
2.3 Archival VLA imaging
Spectral line imaging of the CO (1-0) emission from SDP.81 was carried out using the VLA in D-configuration on 2010 July 18 (PI: Ivison; 3.3 2.3 arcsec beam-size at position angle 10.1 degr). The integration time was 1.5 h and 16 VLA antennas that had been upgraded with the new receiver systems were used. Further details about these observations are describe by Valtchanov et al. (2011). We obtained these data from the VLA archive and reprocessed them in the standard manner using the Common Astronomy Software Applications (casa) package. In Fig. 1, we show the image-plane emission of the CO (1-0) transition, with respect to the infrared and mm-continuum emission (see above and Paper I). It is clear that the CO (1-0) emission is co-located with the infrared-arcs and low-surface brightness infrared emission to the south, demonstrating that these extended infrared components are at the same redshift as SDP.81. The SNR of the VLA dataset is too low to provide a reliable source reconstruction using our visibility lens modelling technique or to determine if the infrared component to the north of SDP.81 is also associated with the lens system.
3 Reconstructions & Analysis
The source-plane velocity integrated emission of the CO (5-4) and CO (8-7) transitions from ALMA are presented in Fig. 2. These maps show clear excitation dependent structure in the molecular gas distribution of SDP.81. The CO (5-4) emission has both diffuse and multiple compact structures that extend over 3 kpc in the north-south direction, with an additional low surface brightness component that is 1–2 kpc in size towards the north-east of the source. The emission from the CO (8-7) transition is much more compact, with an extent of about 1.5 kpc, and there is only a single brightness clump. There is also evidence of a faint tail of emission that extends by 2 kpc to the south-west; this tail is not seen in the CO (5-4) transition, which implies there is higher excitation gas in that region, possibly due to shocks.
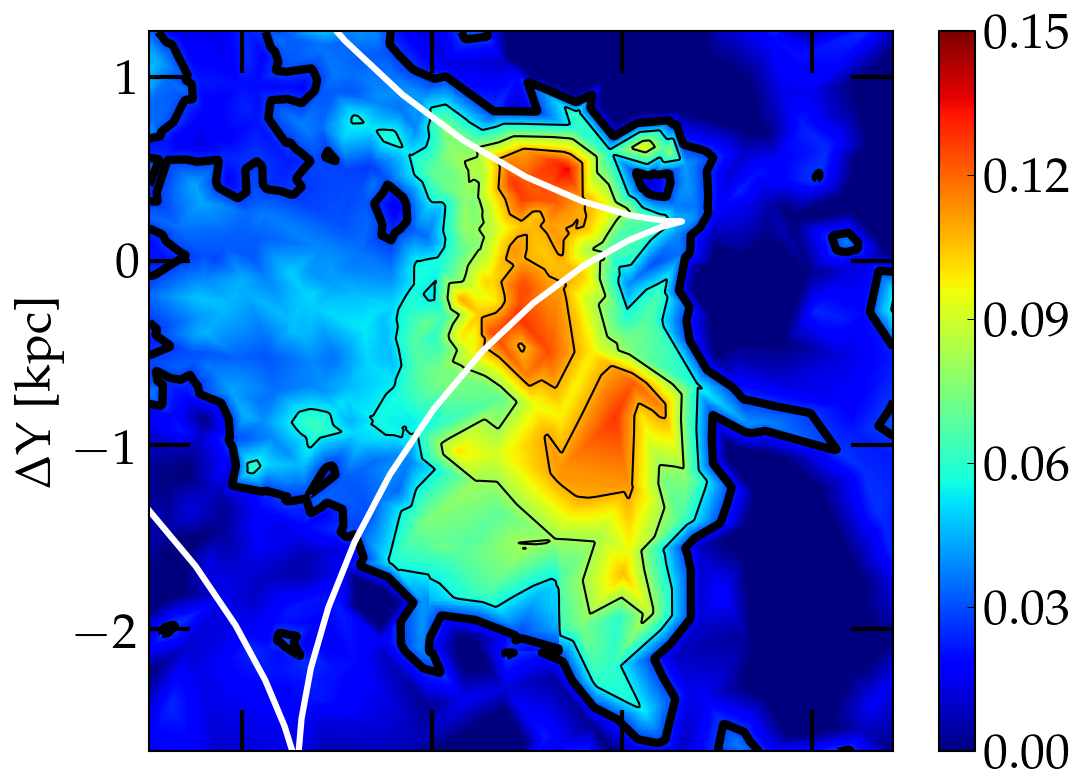
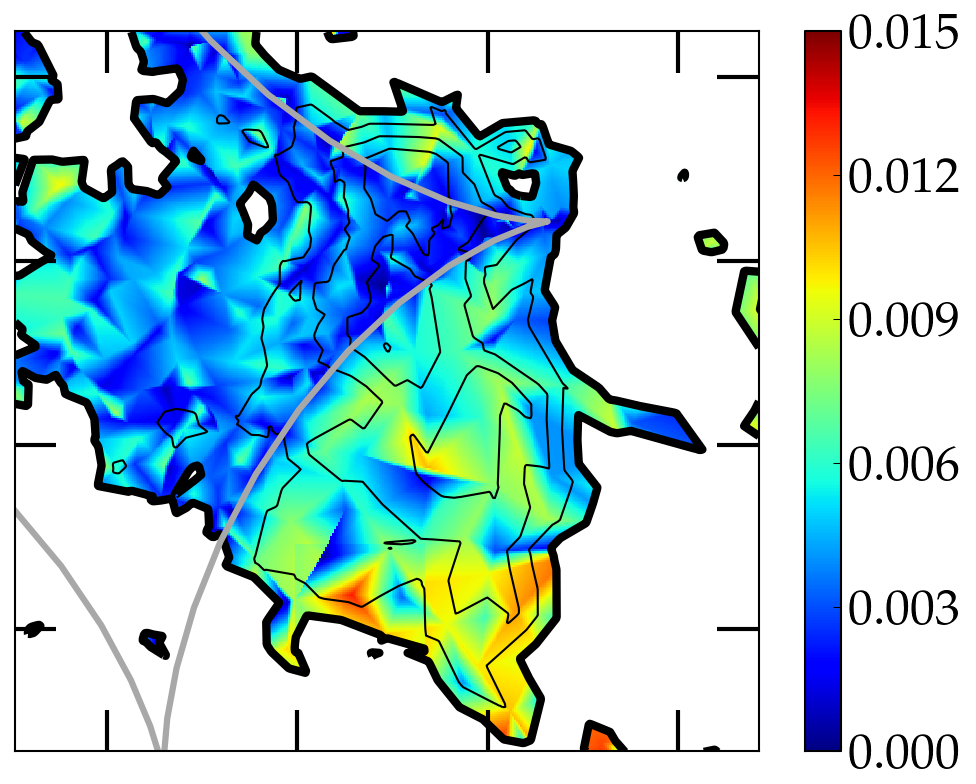
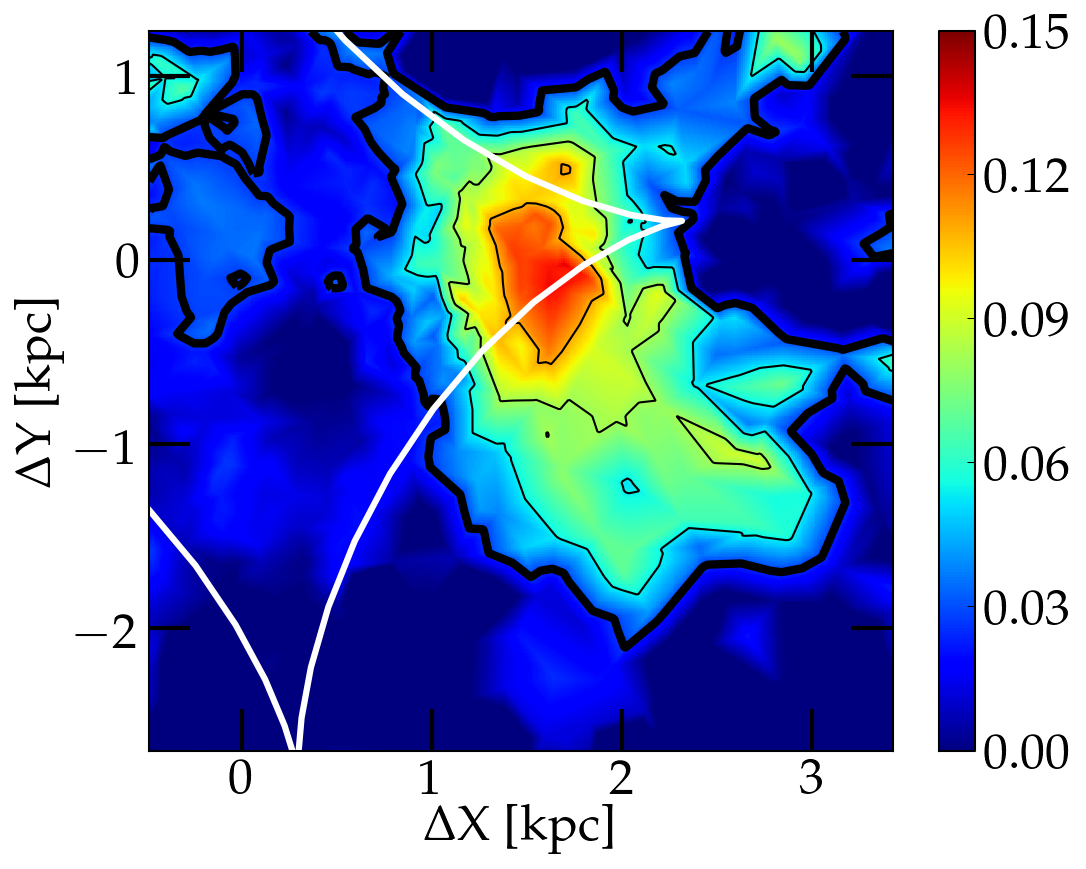
As a check, we compare our reconstructions with the image-plane zeroth-moment maps of the counter-arc (ALMA Partnership, 2015b); the counter-arc does not cross a critical curve (see Paper I) and so the magnification is roughly constant across this image. We find that our source-plane reconstructions are in good agreement with the observed image-plane structure of the counter-arc. The total magnification of the CO (5-4) and CO (8-7) gas components are 17.0 0.4 and 16.9 1.1, respectively.
The total velocity integrated emission from the CO (5-4) and CO (8-7) transitions has been determined by directly integrating the zeroth-moment maps over the total extent of the reconstructed source. We find the velocity integrated line intensities are 0.54 0.06 and 0.45 0.03 Jy km s-1 for the CO (5-4) and CO (8-7), respectively. These correspond to line luminosities of 0.91 0.10 1010 K km s-1 pc2 and 0.27 0.02 1010 K km s-1 pc2. This gives an intrinsic line luminosity ratio of 0.30 0.04, which is consistent with other starburst galaxies at redshift 2–3 that typically show low excitation (e.g. Scott et al., 2011).
Ideally, we would like to compare with the line luminosity of the CO (1-0) emission. However, simply applying our magnification of the CO (5-4) or CO (8-7) transitions to the observed CO (1-0) spectrum would be incorrect; the CO (1-0) line is offset from the dust continuum emission and so does not have the same magnification (see Fig. 1). Also, the CO (1-0) emission from starburst galaxies has been found to be extended by up to 16 kpc (FWHM; Ivison et al. 2011), and so the magnification of this gas component is likely much smaller than for the CO (5-4) or CO (8-7) emission.
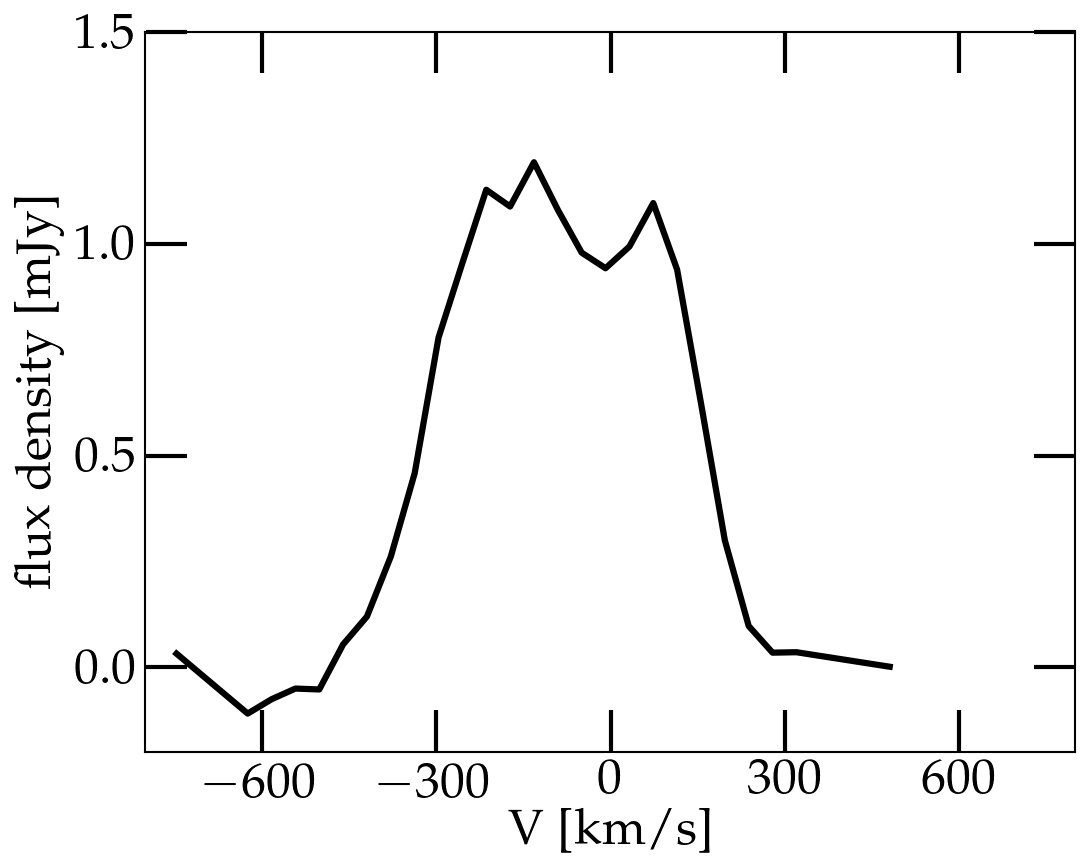
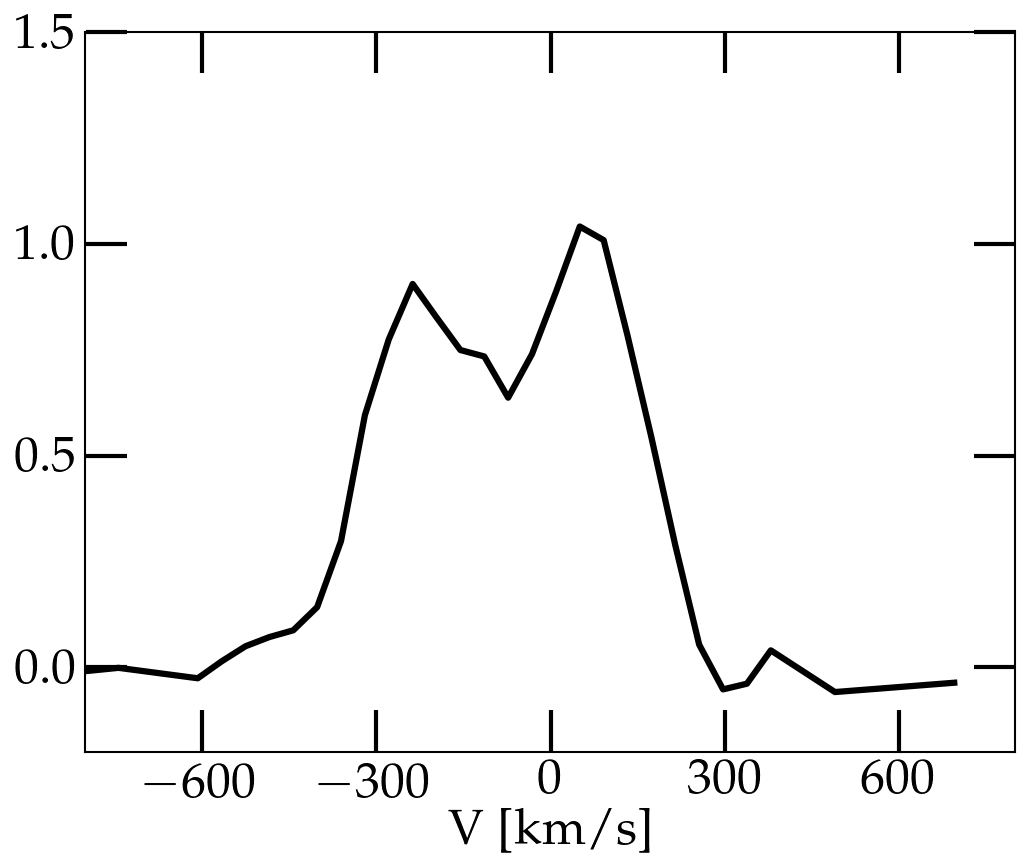
The spatially dependent structure of the CO emission lines extends over the caustic curves, which explains the complex velocity structure that has been observed in the main arc of SDP.81 (see ALMA Partnership 2015b); for example, the image-plane line profile of both transitions are highly asymmetric. In Fig. 3, we present the intrinsic line profiles of both the CO (5-4) and CO (8-7) transitions that are corrected for the differential magnification. We find that both transitions actually have more symmetric profiles, consisting of a double-horn profile, typical of rotating disks, with velocity peaks that are separated by 290 km s-1. Again, this result is consistent with the image-plane line profiles of the counter arc. The CO (5-4) and CO (8-7) emission lines are also offset by about 80 km s-1 from the systemic velocity, as defined by the CO (1-0) measurement (Frayer et al., 2011). This could be due to there being turbulent in/out flowing higher excitation gas, or that the CO (1-0) line also undergoes differential magnification.
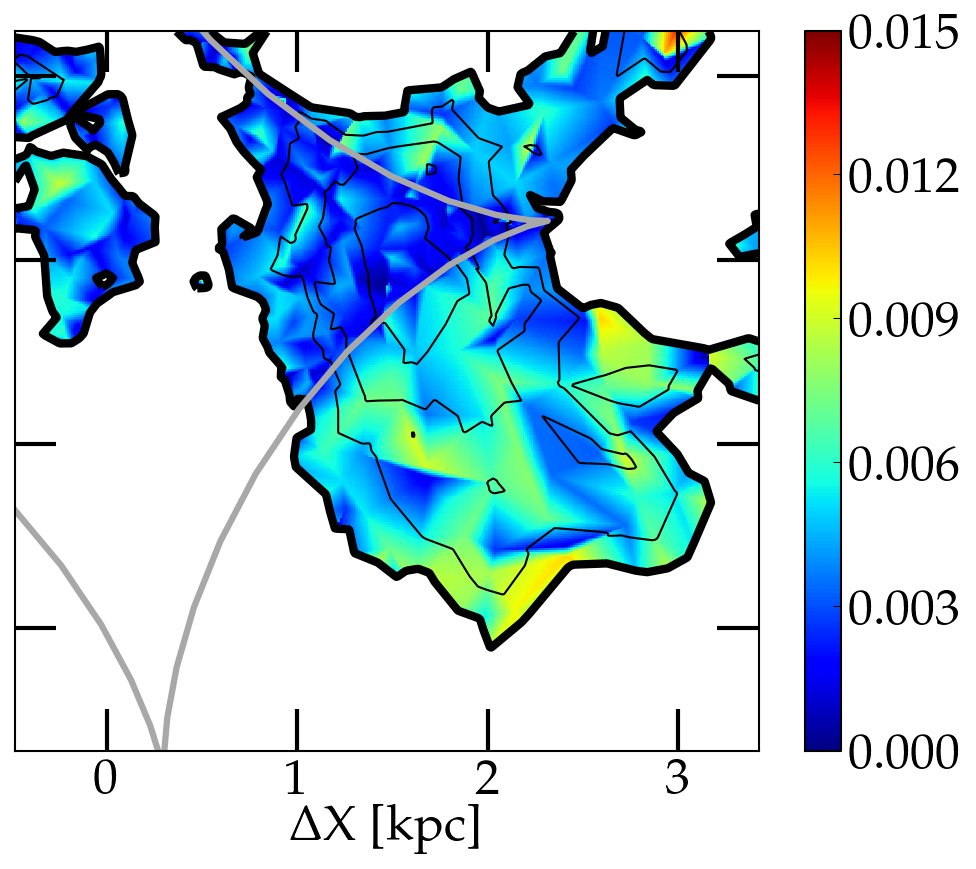
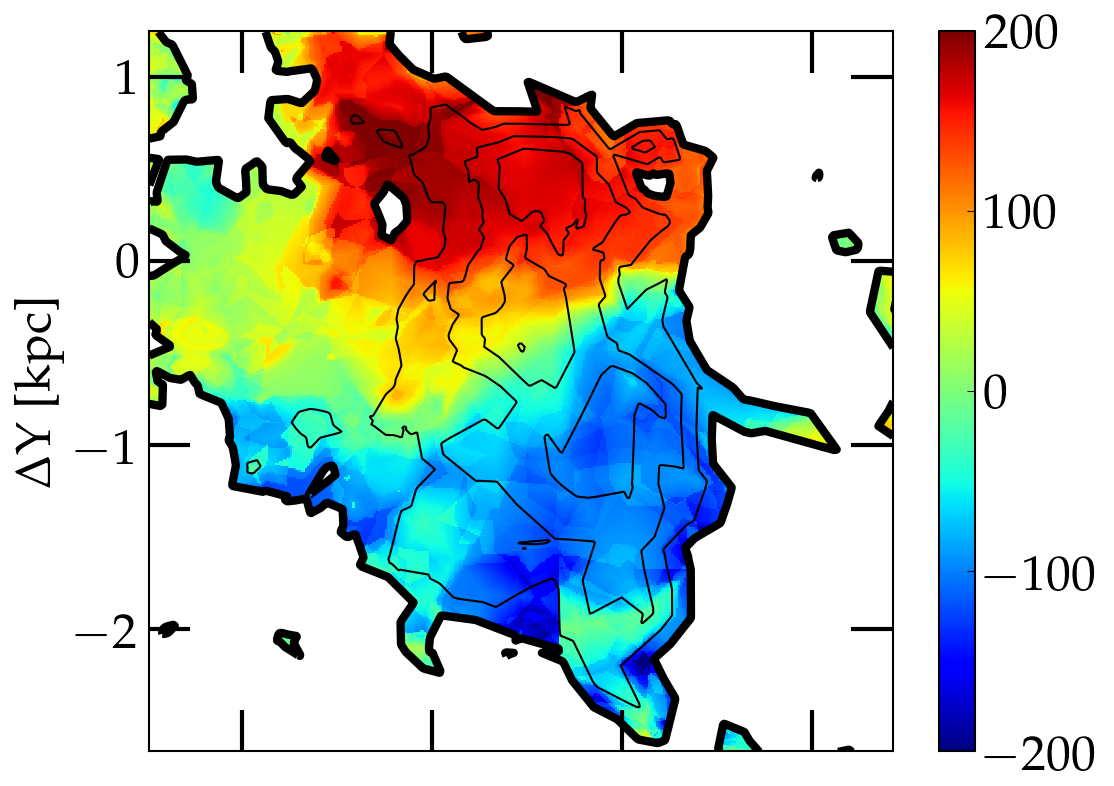
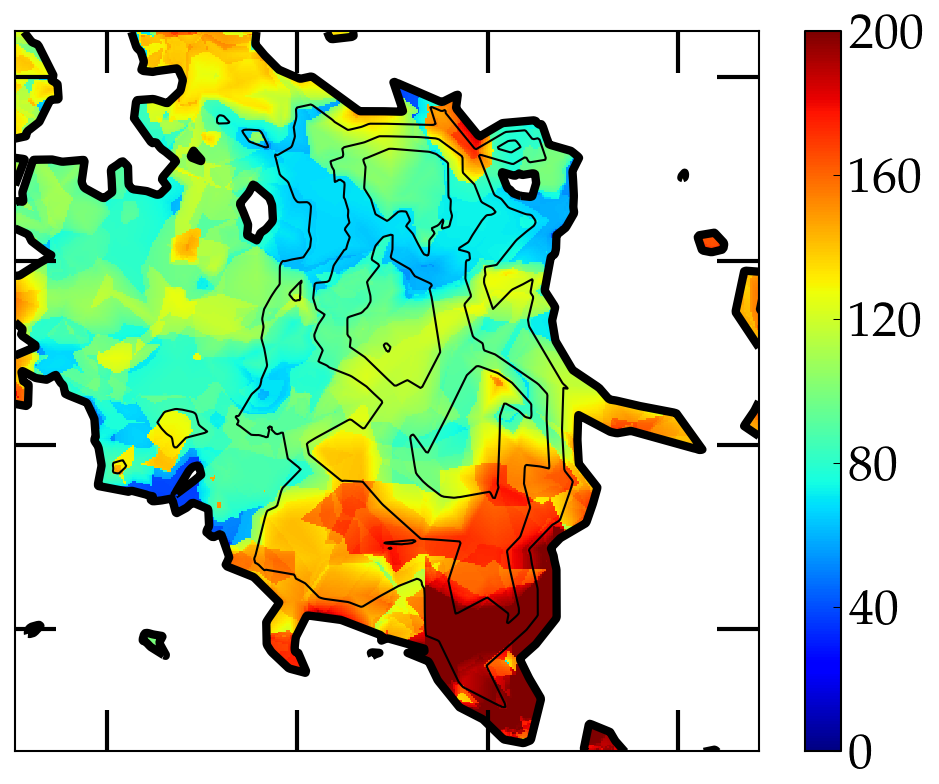
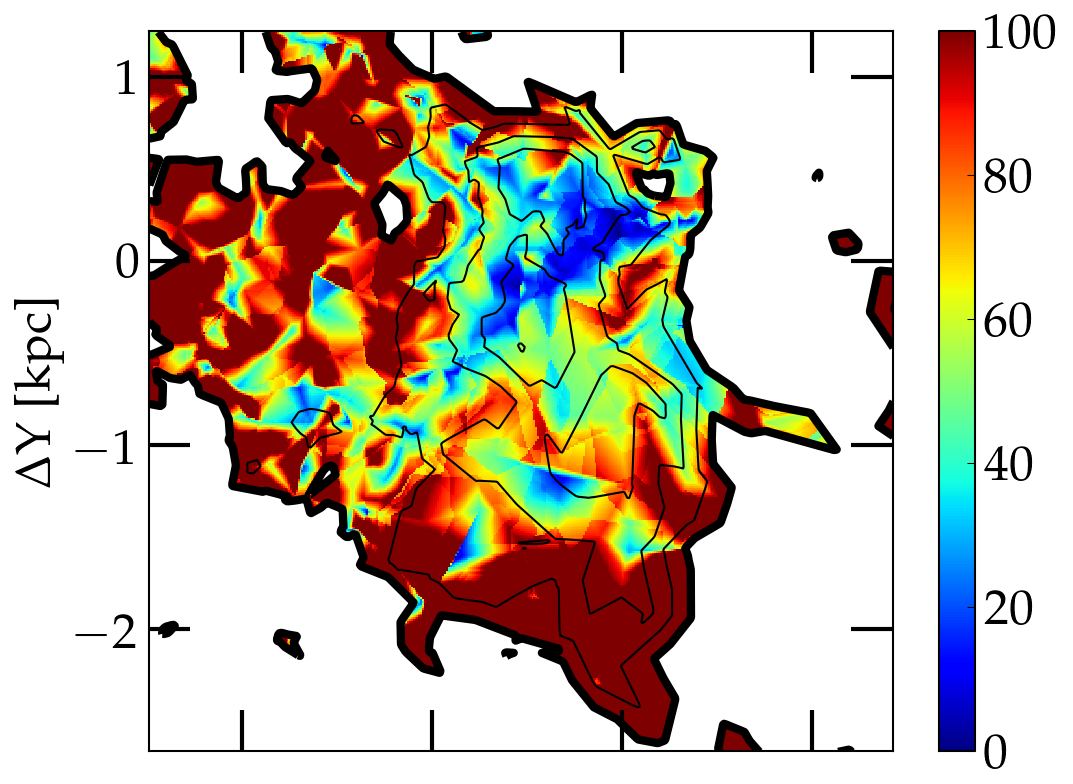
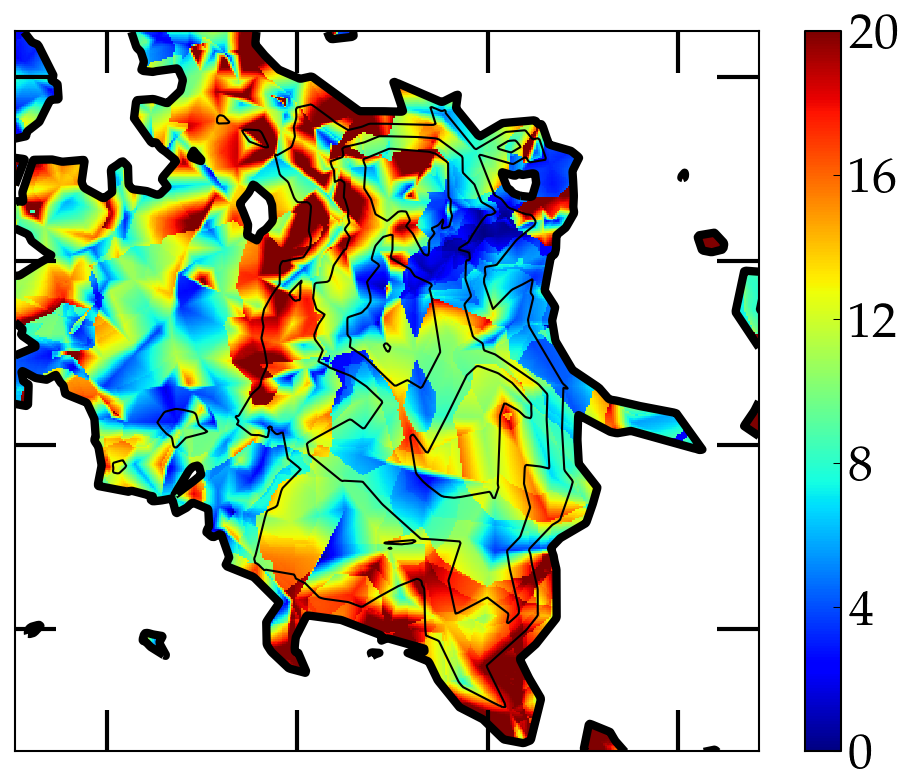
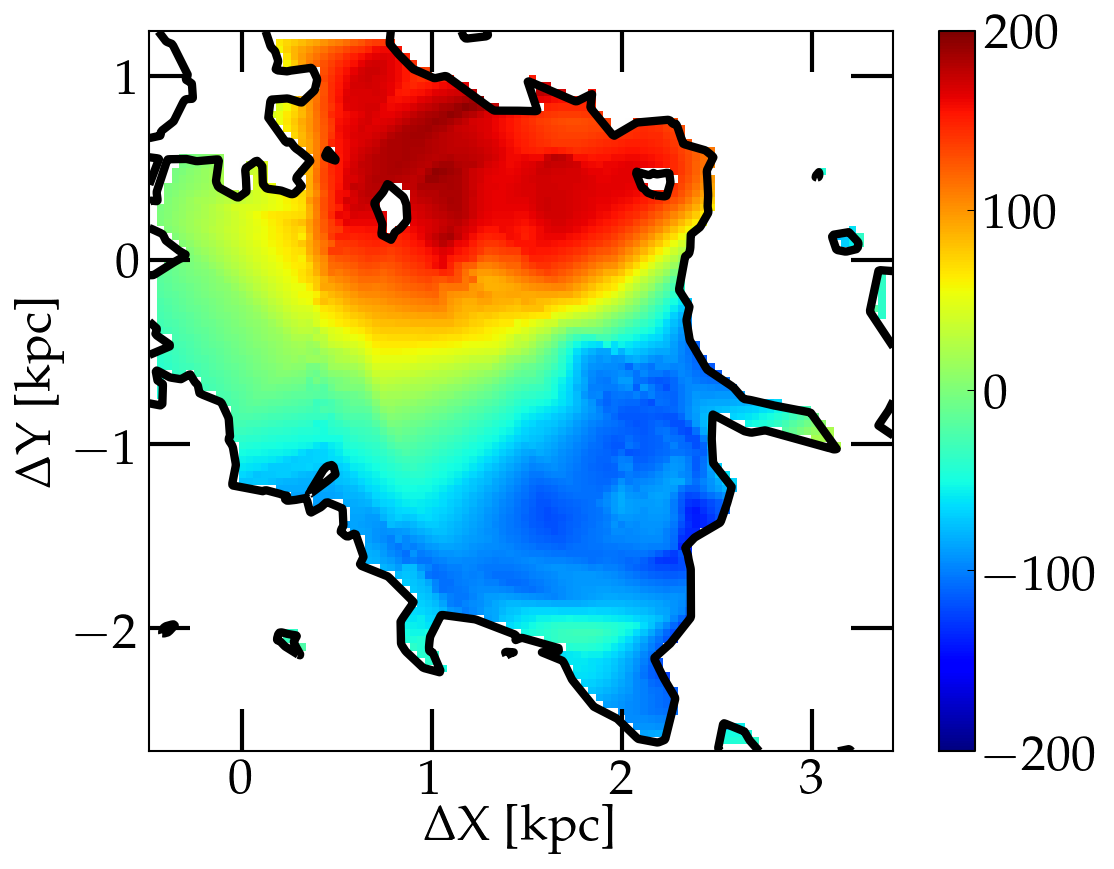
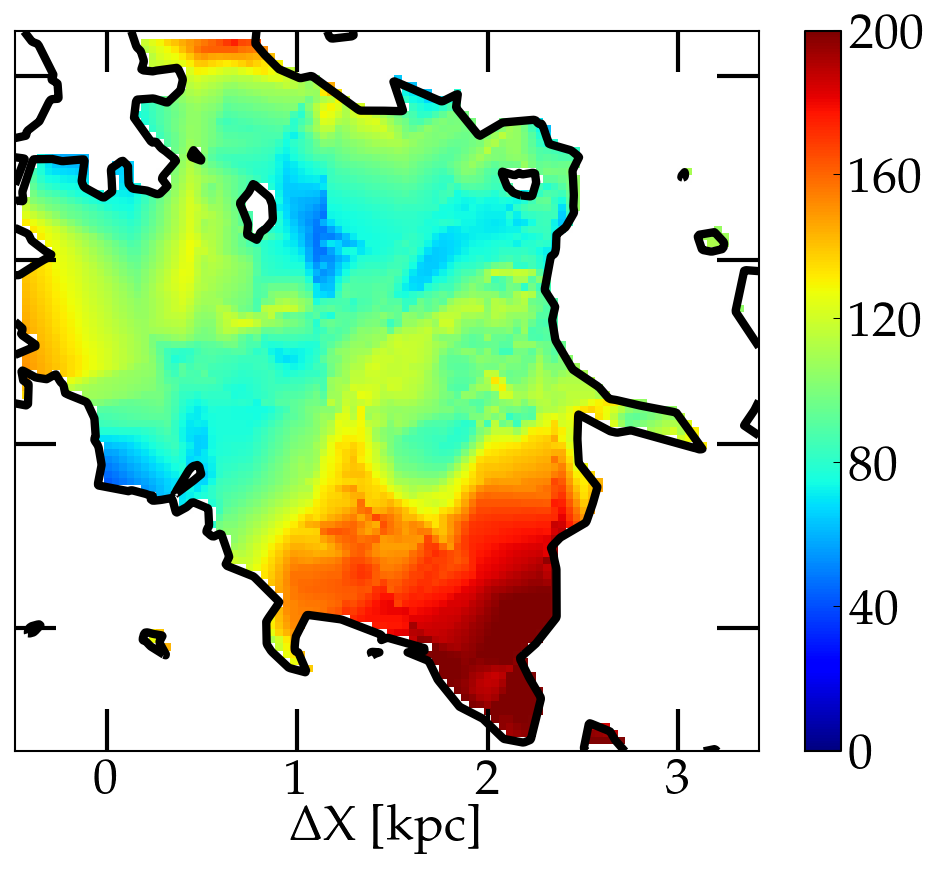
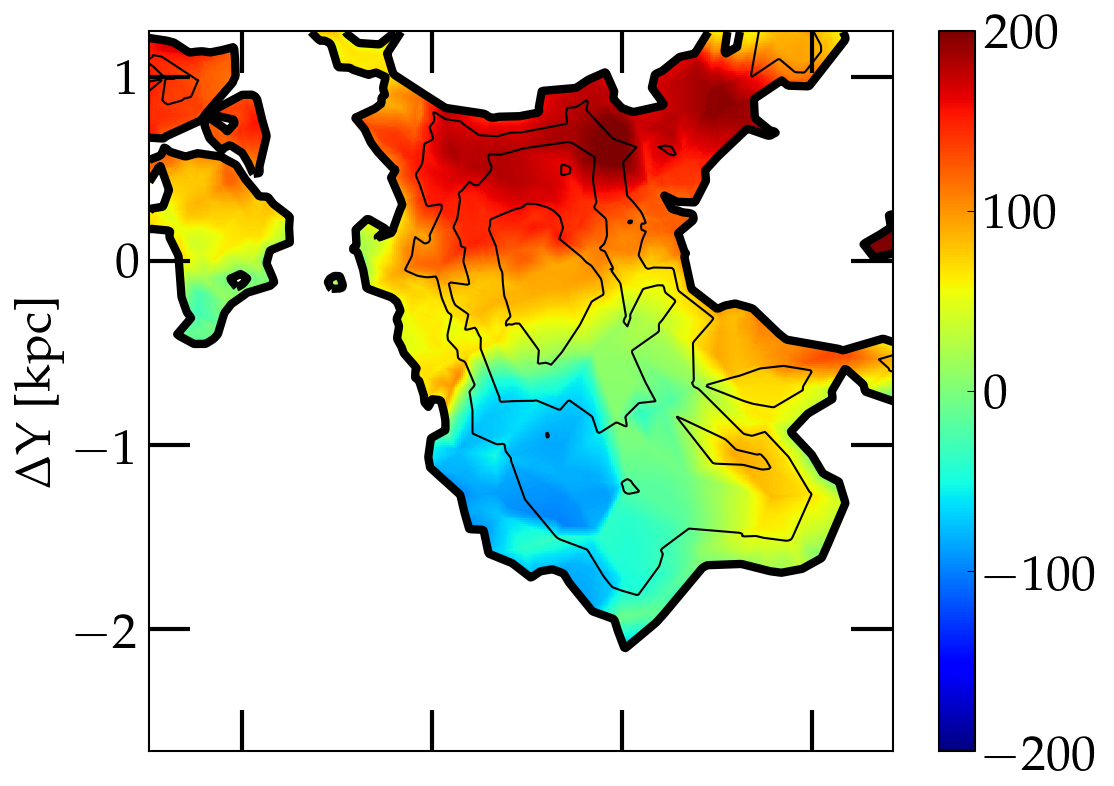
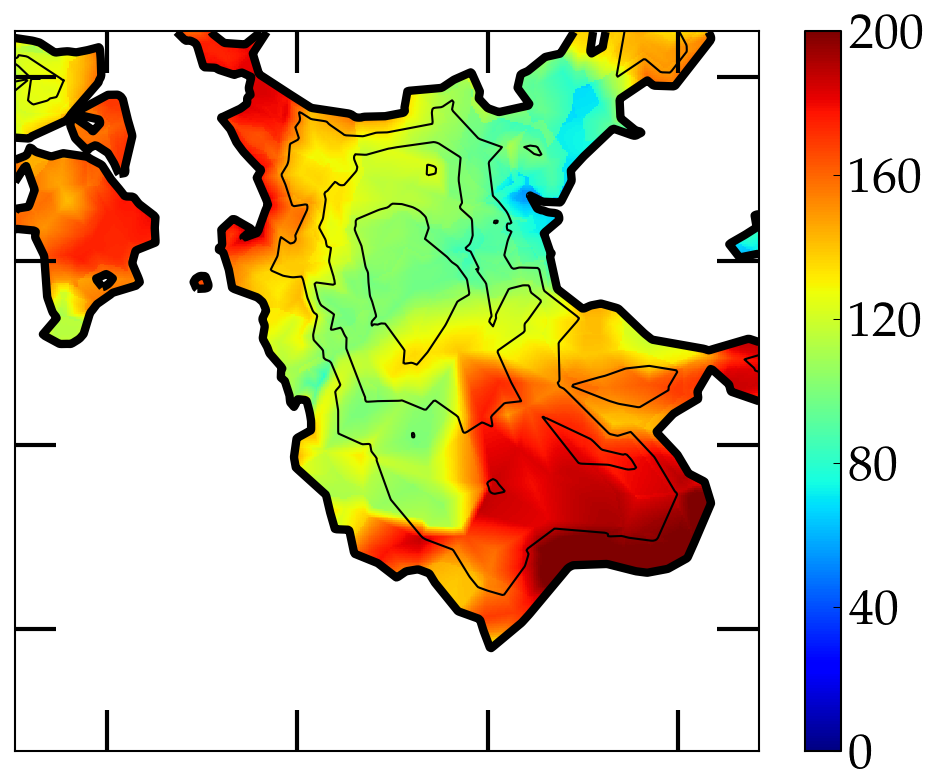
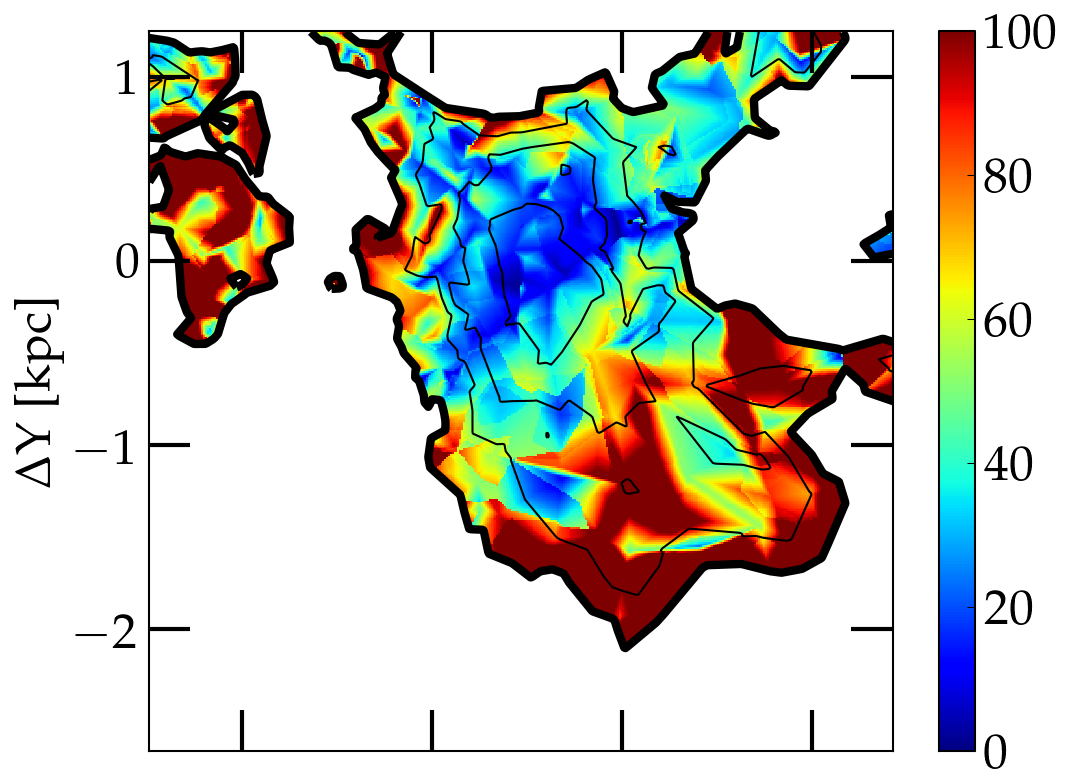
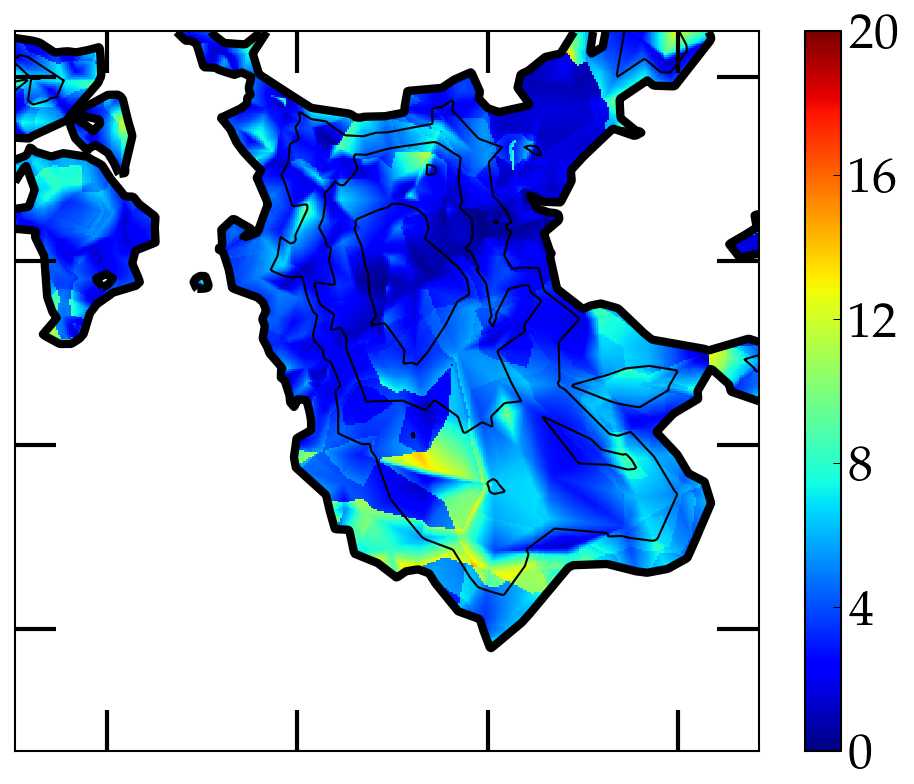
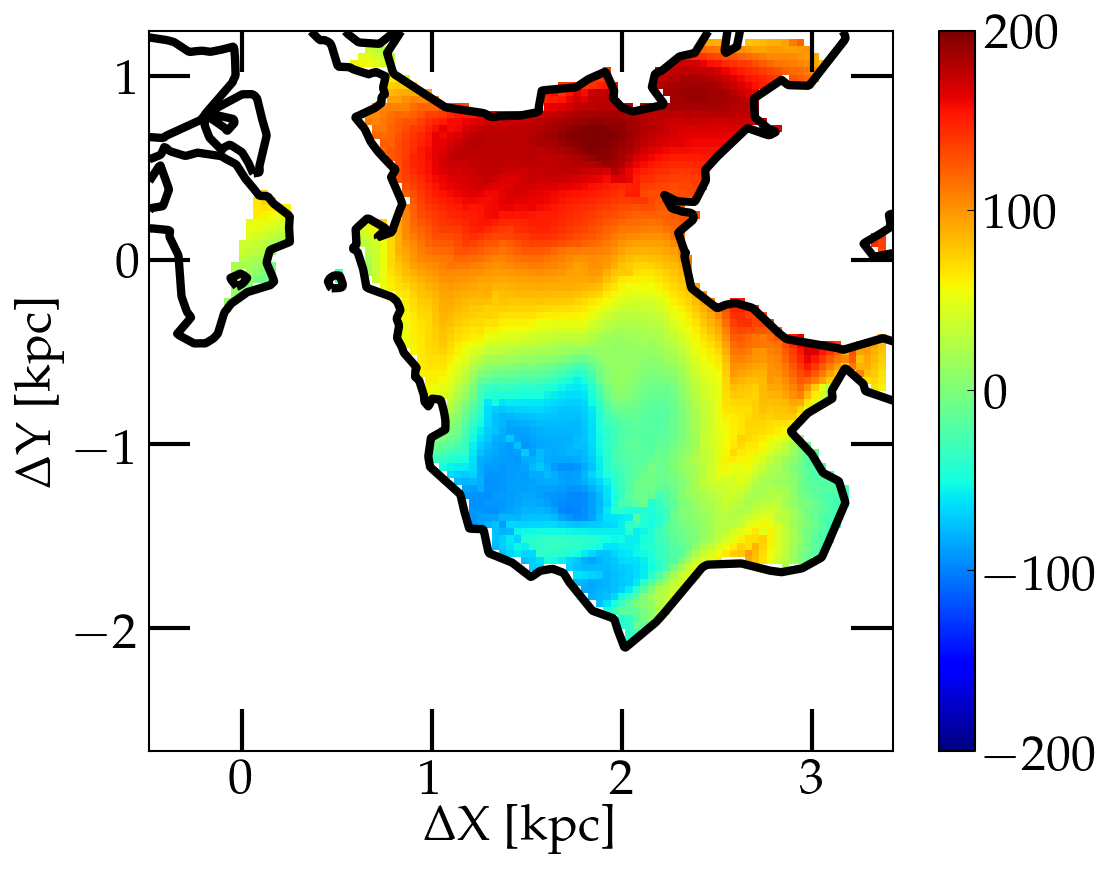
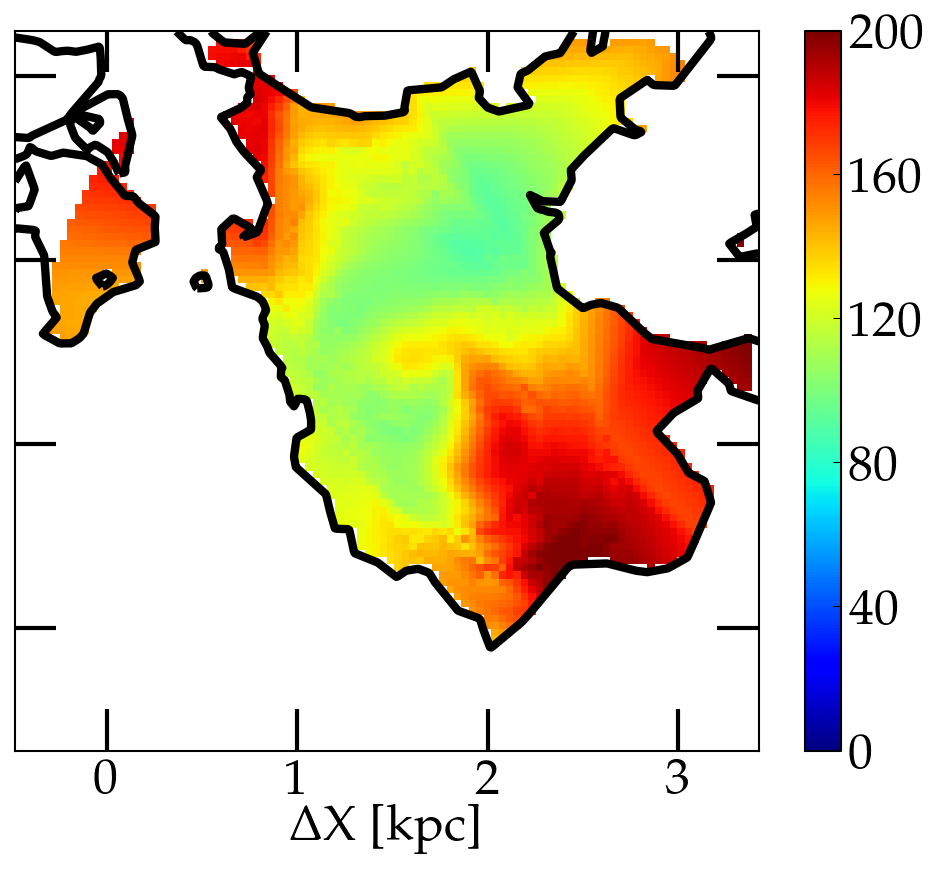
The first- and second-moment maps (velocity and velocity dispersion) of the CO (5-4) and CO (8-7) transitions are presented in Figs. 4 and 5, respectively. The velocity maps for both emission lines show a common central solid-body-like component in the north-south axis. However, the diffuse and extended component of the CO (5-4) and the extended tail of the CO (8-7) show a different velocity than expected for solid body rotation. Although the CO (5-4) extended feature has a slightly higher velocity dispersion than the rest of the emission, the velocity dispersion of the CO (8-7) tail feature is significantly different; the large 200 km s-1 velocity dispersion is not due to a single broad velocity component, but is due to two velocity components along the same line-of-sight. We find that, the velocity dispersion of the CO (8-7) is overall higher than the CO (5-4) by about 40 km s-1.
In order to quantify the asymmetry of the reconstructed velocity (dispersion) structure, we model the moment maps using the kinemetry method by Krajnović et al. (2006). This is based on the idea that higher-order moments can be described by a series of concentric ellipses of increasing major-axis length; the moment profile along each ellipse is then decomposed into a Fourier series with a finite number of harmonic terms. From this analysis we find that both transitions are characterized by a significant level of rotation as well as a significant level of asymmetry at large radii. In the central regions of both transitions, the first harmonic term, , which describes the rotational motion, is found to be substantial and the ratio , which represents higher-order deviations from simple rotation, is consistent with zero, as expected for a disk-like rotation. However, in the outer regions, the term abruptly drops and at the same time the term significantly increases, as expected for multiple kinematical components or for post-coalescence perturbed disks (Krajnović et al., 2006; Bellocchi et al., 2012, B12).
Using kinemetry, Shapiro et al. (2008, S08) have devised a criterion to assess whether a galaxy is disk or merger dominated, based on the total kinematic asymmetry () in the dynamical state of the molecular gas. This criterion has been subsequently revised by B12, in order to better distinguish between isolated disks and post-coalescence mergers on the basis of large asymmetries at large radii. We quantify the total kinematic asymmetry to be 0.65 0.10 and 0.63 0.14 for the CO (5-4) transition and 0.65 0.14 and 0.72 0.20 for the CO (8-7) transition (the uncertainties are a combination of the errors on the Fourier coefficients and the uncertainty due to the choice of centre). These values are consistent with a merger/post-coalescence merger interpretation according to both criteria ( 0.50 and 0.15). Note that although the classification criteria have been derived for data with angular resolutions that are much lower than the data presented here, we find that downgrading our resolution does not affect the derived values. Finally, the visual criteria by Bellocchi et al. (2013) would classify SDP.81 as a perturbed disk; while the velocity maps show a clear disk-like velocity gradient, the velocity dispersion map is relatively smooth without an obvious central peak, indicating that the disk is offset from the actual centre of mass.
We estimate the dynamical mass of the disk structure by considering the maximum radius (1.56 0.07 kpc), maximum velocity (150 20 km s-1) and the inclination angle (45 8 deg) of the outermost kinemetry ellipse that is consistent with an ordered rotation. We find an enclosed dynamical mass of ( 1.56 kpc) = 1.6 0.6 1010 M⊙, which although a factor 2 smaller than that determined by Swinbank et al. (2015), is consistent at the 2-level. However, as the system is far from being in equilibrium, such dynamical mass estimates should be interpreted with care.
We find significant differences in our visibility-plane reconstructions (this letter; Rybak et al. 2015) and the image-plane reconstructions of Dye et al. (2015, see also ). Our reconstructions detect more extended structure within the molecular gas distribution that are not seen in the image-plane analysis. Also, the position and intensity of the compact components are seen to vary between the two methods (note the compact structure varies significantly even within the individual image-plane analyses of the 1, 1.3 and 2 mm continuum data). These differences between the visibility- and image-plane results are likely due to the choice of weighting and deconvolution errors in the low SNR images of the image-plane channel data; the uv-taper and weighting that were applied to the image-plane data produces a point spread function with significant side-lobe structure that can introduce spurious artefacts in the channel images. For these reasons we believe that visibility-plane reconstructions are more robust and less biased, and the interpretation of intensity and velocity maps from image-plane reconstructions requires caution.
4 Discussion & Conclusions
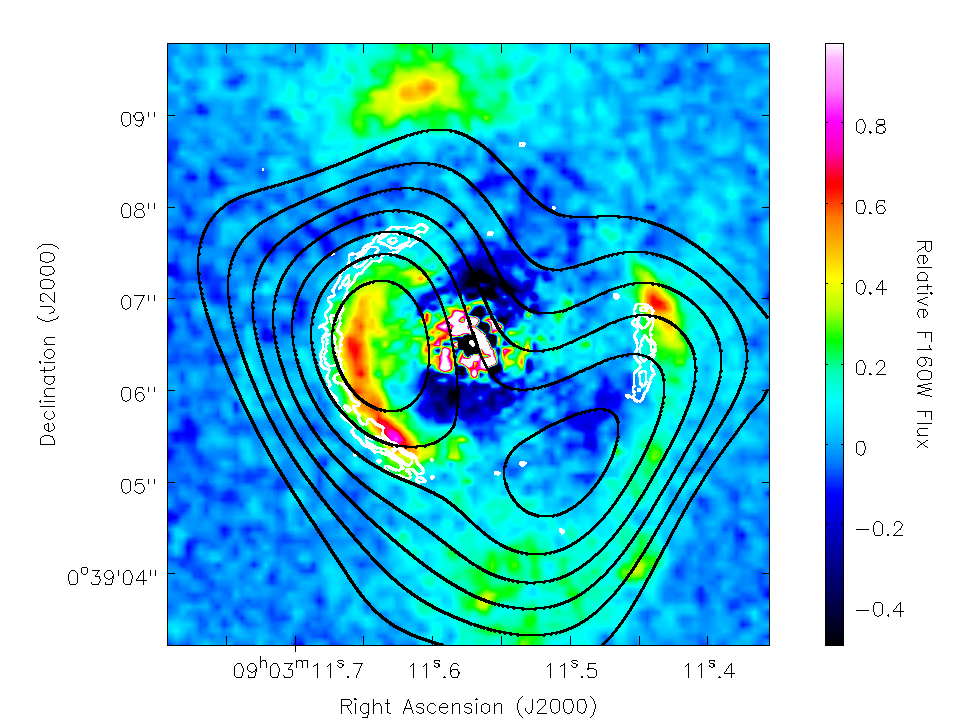
The morphological state of SDP.81 is shown in Fig. 6, where it is apparent that the reconstructed rest-frame UV/optical stellar component (HST F160W) and the combined CO (5-4) and CO (8-7) molecular gas component (both from this paper), and the heated dust from the rest-frame FIR continuum emission presented in Paper I form a complex structure. Taking the UV/optical stellar emission first, we see that this component is dominated by an elongated 4 kpc structure that is oriented by 45 degrees with respect to the north-south axis. There is another brightness peak about 4 kpc south of the main UV/optical peak, and they are connected by a low-surface brightness bridge. Note that the diffuse UV/optical structure that is also coincident with the CO (1-0) emission extends about 10 kpc south, as shown in Fig. 6. The CO (5-4) and (8-7) molecular gas distribution also looks disturbed, with the region to the east being much more diffuse, whereas there is a sharp cut-off (shown by the small distance between the intensity contours) in the gas towards the west, which forms a ridge at the contact point with the stellar component. Interestingly, the extended tail that is seen in the CO (8-7) molecular gas distribution neatly fits into the area between the main UV/optical component and the bridge feature.
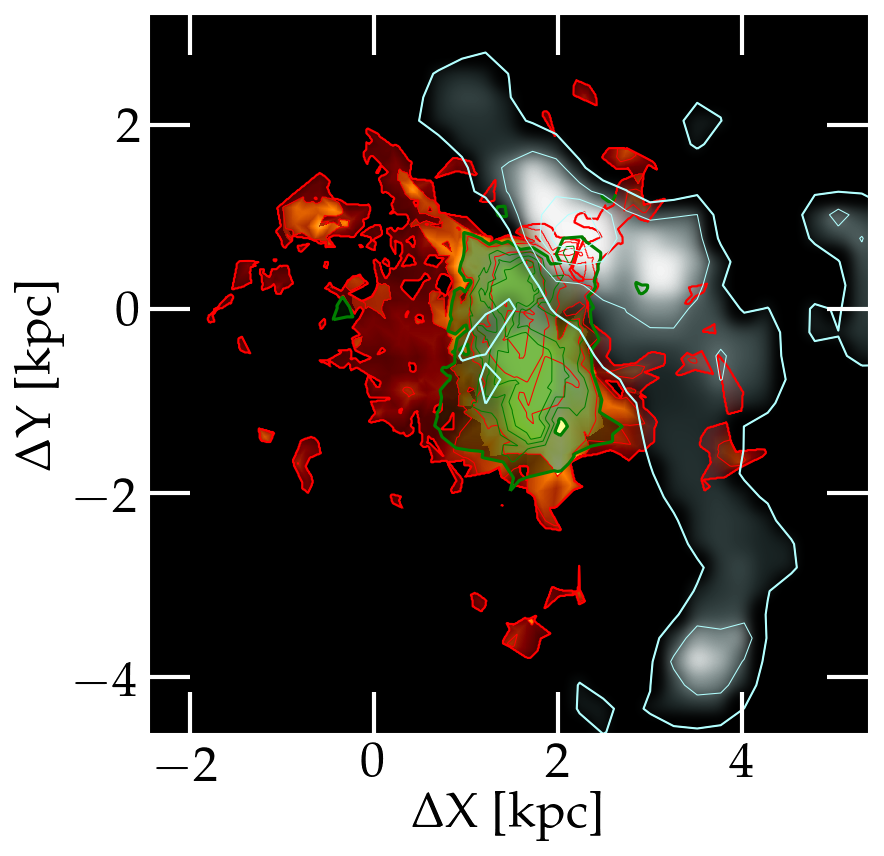
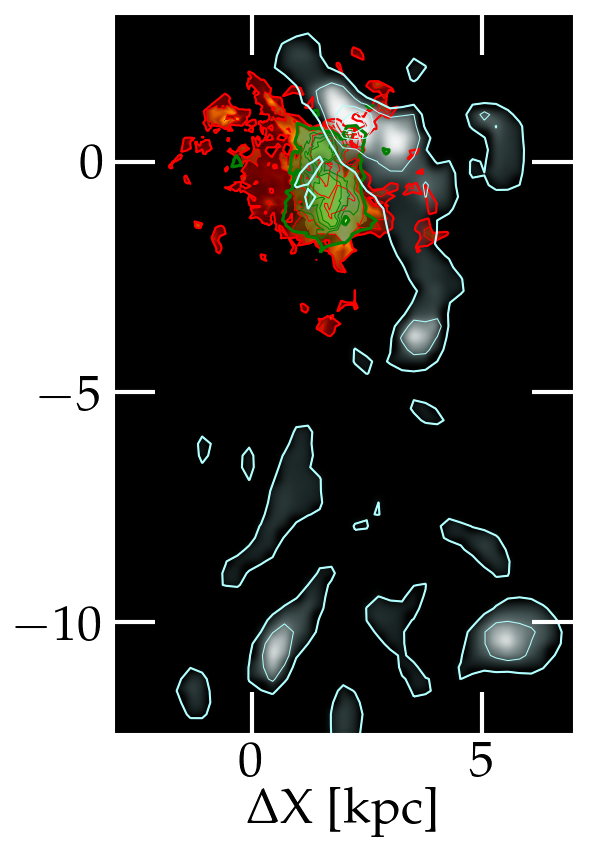
The ongoing star-formation, as traced by the heated dust emission, is concentrated to a region of about 2 kpc in size, and is coincident with the disk-like rotating structure within the inner part of the molecular gas distribution. This component also shows extension to the east and a sharp cut-off to the western edge. We note the detection of a compact molecular gas and star-formation component (20–60 M⊙ yr-1 kpc-2) near the brightness peak of the UV/optical component, suggesting that star-formation is occurring in both structures. However, we find no further evidence of either heated dust or excited molecular gas emission across the full 15 kpc of the optical component, even though there is an established stellar population and a large reservoir of CO (1-0) available for star-formation. This suggests that the current burst of star-formation is localised to the northern part of the structure.
The central structure of SDP.81 is somewhat similar to GN20 (z = 4.05; Hodge et al. 2012, 2015), where the UV/optical emission is offset from the molecular gas component, as traced by lower excitation CO (2-1) and the heated dust emission; these offsets are not uncommon in high-redshift galaxies and may be attributed to dust extinction of the UV/optical stellar emission or to strong negative stellar feedback together with gas accretion from gas clumps or satellites (Maiolino et al., 2015). Like GN20, there is also evidence for a central star-forming disk at the centre of SDP.81. However, there are also marked differences, which suggest that the starburst in SDP.81 may be within an interacting/merging system. First, our kinemetry analysis of the extended molecular gas distribution suggests a post-coalescence perturbed disk. Also, the UV/optical emission shows multiple compact and diffuse components over an elongated 15 kpc region. The CO (1-0) data in hand are not sensitive enough or have high enough angular resolution to determine the relative velocities of these individual components, but it is clear from the overall CO (1-0) emission that they form part of the same extended structure.
The merger scenario has been put forward for the triggering mechanism behind the strong star-formation observed within sub-mm galaxies. This is based on the observed multiple-component morphology and disturbed kinematics of unlensed starbursts and from simulations (e.g. Engel et al., 2010; Narayanan et al., 2010). Indeed, this conclusion was also recently drawn by Messias et al. (2014) who studied the source plane properties of H-ALTAS J14290028. For SDP.81, the situation is still not clear, but further observations of the CO (1-0) emission with the VLA at higher angular resolution could measure the relative dynamics of the various UV/optical components. This would confirm that they form a merging system, with large velocity offsets, or if they are part of a clumpy structure with a more chaotic velocity distribution.
Acknowledgments
This paper makes use of the following ALMA data: ADS/JAO.ALMA #2011.0.00016.SV. ALMA is a partnership of ESO (representing its member states), NSF (USA) and NINS (Japan), together with NRC (Canada), NSC and ASIAA (Taiwan), and KASI (Republic of Korea), in cooperation with the Republic of Chile. The Joint ALMA Observatory is operated by ESO, AUI/NRAO and NAOJ. The National Radio Astronomy Observatory is a facility of the National Science Foundation operated under cooperative agreement by Associated Universities, Inc. Based on observations made with the NASA/ESA Hubble Space Telescope, obtained from the data archive at the Space Telescope Science Institute. STScI is operated by the Association of Universities for Research in Astronomy, Inc. under NASA contract NAS 5-26555.
References
- ALMA Partnership (2015a) ALMA Partnership et al., 2015a, ApJL (arXiv:1504.04877)
- ALMA Partnership (2015b) ALMA Partnership et al., 2015b, ApJL (arXiv:1503.02652)
- Bellocchi et al. (2012) Bellocchi E., Arribas S., Colina L., 2012, A&A, 542, 54
- Bellocchi et al. (2013) Bellocchi E., Arribas S., Colina L., Miralles-Caballero D., 2013, A&A, 557, 59
- Bussmann et al. (2013) Bussmann R. S. et al., 2013, ApJ, 779, 25
- Carilli et al. (2010) Carilli C. L. et al., 2010, ApJ, 714, 1407
- Coppin et al. (2008) Coppin K. et al., 2008, MNRAS, 384, 1597
- Dekel et al. (2009a) Dekel A. et al., 2009a, Nature, 457, 451
- Dye et al. (2014) Dye S. et al., 2014, MNRAS, 440, 2013
- Dye et al. (2015) Dye S. et al., 2015, MNRAS (arXiv:1503.08720)
- Engel et al. (2010) Engel H. et al., 2010, ApJ, 724, 233
- Frayer et al. (2011) Frayer D. T. et al., 2011, ApJL, 726, L22
- Greve et al. (2004) Greve T. R., Ivison R. J., Bertoldi F., Stevens J. A., Dunlop J. S., Lutz D., Carilli C. L., 2004, MNRAS, 354, 779
- Hodge et al. (2012) Hodge J. A., Carilli C. L., Walter F., de Blok W. J. G., Riechers D., Daddi E., Lentati L., 2012, ApJ, 760, 11
- Hodge et al. (2015) Hodge J. A., Riechers D., Decarli, R., Walter F., Carilli C. L., Daddi E., Dannerbauer H., 2015, ApJL, 798, L18
- Ivison et al. (2011) Ivison R. J., Papadopoulos P. P., Smail I., Greve T. R., Thomson A. P., Xilouris E. M., Chapman S. C., 2011, MNRAS, 412, 1913
- Karim et al. (2013) Karim A. et al., 2013, MNRAS, 432, 2
- Krajnović et al. (2006) Krajnović D., Cappellari M., de Zeeuw P.T., Copin Y., 2006, MNRAS, 366, 787
- Maiolino et al. (2015) Maiolino R. et al., 2015, MNRAS, in press
- Messias et al. (2014) Messias H. et al., 2014, A&A, 568, A92
- Narayanan et al. (2010) Narayanan D. et al., 2010, MNRAS, 407, 1701
- Negrello et al. (2010) Negrello M. et al., 2010, Science, 330, 800
- Negrello et al. (2014) Negrello M. et al., 2014, MNRAS, 440, 1999
- Peng et al. (2010) Peng C. Y., Ho L. C., Impey C. D., Rix H.-W., 2010, AJ, 139, 2097
- Rybak et al. (2015) Rybak M., McKean J. P., Vegetti S., Andreani P., White S. D. M., 2015, MNRAS, 451, L40
- Scott et al. (2011) Scott K. S. et al., 2011, ApJ, 733, 29
- Shapiro et al. (2008) Shapiro K. L. et al., 2008, ApJ, 682, 231
- Swinbank et al. (2006) Swinbank A. M., Chapman S. C., Smail I., Lindner C., Borys C., Blain A. W., Ivison R. J., Lewis G. F., 2006, MNRAS, 371, 465
- Swinbank et al. (2010) Swinbank A. M. et al., 2010, Nature, 464, 733
- Swinbank et al. (2015) Swinbank A. M. et al., 2015, ApJL, 806, L17
- Tacconi et al. (2008) Tacconi L. J. et al., 2008, ApJ, 680, 246
- Tamura et al. (2015) Tamura Y., Oguri M., Iono D., Hatsukade B., Matsuda Y., Hayashi M., 2015, PASJ (arXiv:1503.07605)
- Valtchanov et al. (2011) Valtchanov I. et al., 2011, MNRAS, 415, 3473
- Vegetti & Koopmans (2009) Vegetti S., Koopmans L. V. E., 2009, MNRAS, 392, 945
- Weiß et al. (2009) Weiß A. et al., 2009, ApJ, 707, 1201
- Wong et al. (2015) Wong K. C., Suyu S. H., Matsushita, S., 2015, ApJL (arXiv:1503.05558)