Early-type stars observed in the ESO UVES Paranal Observatory Project - V. Time-variable interstellar absorption
Abstract
The structure and properties of the diffuse interstellar medium (ISM) on small scales, sub-au to 1 pc, are poorly understood. We compare interstellar absorption-lines, observed towards a selection of O- and B-type stars at two or more epochs, to search for variations over time caused by the transverse motion of each star combined with changes in the structure in the foreground ISM. Two sets of data were used: 83 VLT-UVES spectra with approximately 6 yr between epochs and 21 McDonald observatory 2.7m telescope echelle spectra with 6 – 20 yr between epochs, over a range of scales from 0 – 360 au. The interstellar absorption-lines observed at the two epochs were subtracted and searched for any residuals due to changes in the foreground ISM. Of the 104 sightlines investigated with typically five or more components in Na i D, possible temporal variation was identified in five UVES spectra (six components), in Ca ii, Ca i and/or Na i absorption-lines. The variations detected range from 7% to a factor of 3.6 in column density. No variation was found in any other interstellar species. Most sightlines show no variation, with 3 upper limits to changes of the order 0.1 – 0.3 dex in Ca ii and Na i. These variations observed imply that fine-scale structure is present in the ISM, but at the resolution available in this study, is not very common at visible wavelengths. A determination of the electron densities and lower limits to the total number density of a sample of the sightlines implies that there is no striking difference between these parameters in sightlines with, and sightlines without, varying components.
keywords:
stars: early-type – ISM: abundances – ISM: clouds – ISM: general – ISM: structure –1 Introduction
The properties of the interstellar medium (ISM) on small scales, from sub-astronomical unit (au) to 1 parsec, remain poorly understood. The first indication that au-scale structures were present in H i was provided by Diamond et al. (1989), who used Very Long Baseline Interferometry (VLBI) radio observations to identify changes in the 21 cm absorption towards three extragalactic radio sources as a function of resolution. This suggested foreground structures with linear dimensions of only 25 au. Further absorption-line VLBI measurements in H i (Faison et al., 1998; Brogan et al., 2005; Lazio et al., 2009; Roy et al., 2012) and molecules (Marscher, Moore & Bania, 1993; Liszt & Lucas, 2000) also found tiny-scale structures, although with relatively small plane-of-sky covering fractions of 10 per cent. Similar results have been seen via multi-epoch H i absorption-line measurements towards pulsars (e.g. Frail et al., 1994; Johnston et al., 2003; Stanimirović et al., 2010) and indicate that, in H i, tiny-scale variations are a common phenomenon but with a low probability of intercepting any given line of sight.
Optical and UV observations have also been used to detect temporal and spatial variation in interstellar absorption. Most have relied upon multi-epoch ultra-high resolution optical observations in Na i and Ca ii (e.g Hobbs et al., 1991; Blades et al., 1997; Price, Crawford & Barlow, 2000; Meyer et al., 2012), although some authors have also detected variations in K i, Ca i and/or Fe i (Crawford et al., 2000; Smith et al., 2013; Galazutdinov et al., 2013). Binary systems (e.g. Meyer, 1990; Cordiner et al., 2013) and star clusters (e.g. Andrews, Meyer & Lauroesch, 2001; van Loon et al., 2009) have also been used to study the fine-scale structure of the ISM. Watson & Meyer (1996) found differences in Na i towards the individual members of all 17 of the binary or multiple star systems they observed, with separations 480-29000 au. These observations imply a population of dense au-scale clouds in the ISM or changes in ionization or depletion over time, but are restricted to trace neutral species. Boissé et al. (2013) studied the spatial distribution of CH+, CH and CN on scales ranging 1–20 au for a single sightline towards Zeta Per, finding the neutral species to be uniformly distributed and a CH+ excess implying its production in very small localized active regions of only a few au. Data for UV absorption-lines can probe dominant ions and provide further information on the physical conditions; time-variable UV lines have been found by e.g. Danks et al. (2001) and Welty (2007). Further examples of time-variable interstellar lines are cited in the reviews by Crawford (2003) and Lauroesch (2007).
We note it is difficult to decipher between apparent spatial and temporal variations in the foreground ISM. The main questions concerning these variations are as follows. What are the physical conditions in these structures? What is their formation mechanism? How stable are they and how do the structures seen in the optical relate to the H i absorption-line measurements?
This is one of a series of papers which use data on early-type stars in the UVES Paranal Observatory Project (POP; Bagnulo et al., 2003) 111http://www.eso.org/uvespop to study the ISM. In Hunter et al. (2006, Paper I) the near-UV interstellar lines of Na i, Ti ii and Ca ii were observed towards 74 O- and B-type stars, and basic correlations in the observed column densities were investigated. Smoker et al. (2007, Paper II) combined these data with H i 21 cm observations to estimate distances to intermediate- and high-velocity clouds, while Smoker et al. (2011, Paper III) used POP observations of stars in open clusters (IC 2391, NGC 6475 and Praesepe) combined with archival multi-epoch data to search for small- (pc) and tiny- (au) scale structure of the ISM. They searched for variations in Ti ii, Ca ii K, Na i D and K i absorption; a total of three possible examples of tiny-scale structure were found.
Here we present UVES observations at additional epochs of the same POP O- and B-type lines of sight, coupled with additional data taken at McDonald observatory to search for time-variable absorption. The time between the two epochs was 6 yr for the UVES POP sample and 6 – 20 yr for the McDonald data. Due to the proper motion of the stars, it is hence possible to study changes in their lines of sight on scales of 0 – 360 au. We aim to extend the sample size of twin epoch observations to determine just how ubiquitous the small scale structure of the ISM is. To our knowledge this is the largest twin-epoch spectroscopic survey to date.
This paper is organized as follows. Section 2 describes the archival data used, the new observations, and the data reduction, while Section 3 contains the main results. In Section 4 we discuss the upper limits and possible time-varying interstellar line strength in terms of different models of the ISM. Finally, Section 5 presents a summary of our results and suggests avenues for future research.
2 Observations, archival data, and data reduction
2.1 UVES data
Our study uses a combination of archival and new observations. Archival data from the ESO POP (ESO programme ID 266.D-5655(A), Bagnulo et al. 2003) were used to provide a catalogue of high resolution (), covering the wavelength range 304 – 1040 nm for about 400 stars obtained with the upgraded UVES spectrometer (Dekker et al., 2000; Smoker et al., 2009) of the ESO Very Large Telescope. The signal-to-noise ratio (S/N) of the stellar spectra is high, ranging 200 – 800, and averaging 520 around Na i, and ranging 100 – 800, averaging 330 around Ca ii. The POP survey contains a total of 98 O- and B-type stars, suitable for use as background sources to study the ISM. These sightlines form the first epoch of data for most stars in our sample, and were observed between 2001 and 2003. The merged versions of the spectra were taken from the POP website ((http://www.eso.org/uvespop Bagnulo et al., 2003)).
New second-epoch observations of the same O- and B-type stars were taken during 2008 (ESO programme ID 081.C-0475(A)) on the same UVES instrument to allow direct comparison between the two epochs at the same spectral resolution. It is important to note that the measured resolution of the UVES data can change by up to 10 % over several yr, depending on the season 222http://www.eso.org/observing/dfo/quality/UVES/reports/HEALTH/trend_report_ECH_RESOLUTION_DHC_HC.html. We have investigated the effects of these small resolution changes on the column densities calculated and found that in the majority of cases, the differences are within the error estimates (see Sect. 2.5). The (390+580) setting was used giving wavelength coverage from 328–450 nm and 475–681 nm, with a gap from 578–581 nm where the two CCDs in the red mosaic are joined. For some sightlines where changes were detected, we obtained third epoch data in 2013 using the same instrumental setup (ESO programme ID 092.C-0173(A)). All of these data were reduced using the ESO UVES pipeline (Ballester et al., 2000) and the multiple exposures at each epoch co-added using iraf333IRAF is distributed by the National Optical Astronomy Observatory, which is operated by the Association of Universities for Research in Astronomy (auRA) under cooperative agreement with the National Science Foundation., to bring the epoch 2 and 3 data to the same point of reduction as epoch 1. As the epoch 1 data were taken from the POP website, they had been reduced using an earlier version of the pipeline than the epoch 2 and 3 data. To investigate the effects of the different pipelines on the spectral resolution, a subset of epoch 1 data (including some showing possible variation) were re-reduced using a more recent pipeline. No significant resolution changes were discovered and so the merged version of the data from the POP website was deemed sufficient for comparison.
From this stage onwards all sets of UVES data were treated in exactly the same manner. Each spectrum was analysed in idl. Interstellar absorption-lines of interest (listed in Table 1) were isolated and each line from epoch 1 was cross correlated with its equivalent from epoch 2 or 3 to correct for any velocity shifts between the ISM lines in the two epochs, and to bring both epochs into kinematic local-standrad-of-rest frame. The two epochs were then overlaid so that any obvious changes in the line profiles could be identified by eye. Spectra were renormalized to remove the stellar continua and the Na i D spectra corrected for telluric absorption features where necessary, by dividing by a scaled telluric spectrum created from our set of observations with regions free of Na absorption or from Cerro Paranal Sky Model skycalc 444http://www.eso.org/observing/etc/ (Noll et al., 2012; Jones et al., 2013). In all cases where possible variations were identified,they are seen in both the Na D1 and Na D2 lines, which are affected differently by telluric contamination, and so inconsistent correction of telluric lines could not account for the variation seen. epoch 1 spectra were subtracted from epoch 2 or 3 for each absorption feature to search for any residuals that would imply variations in the line of sight between epochs. It was also necessary to compare these residual plots to residuals caused solely by the slight differences in resolution in the two epochs of data due to small, but inevitable changes in the instrumental set-up between epochs-exposures.
2.2 Welty et al. data
In some cases, the earlier epoch 1 data used for comparison were taken from Welty, Hobbs & Kulkarni (1994, Henceforth refered to as WHK) and Welty, Morton & Hobbs (1996, Henceforth WMH). WHK observations of Na i D1 only, were made in 1987-89 on a coudé spectrograph of the 2.7m telescope at McDonald observatory. WMH observations of Ca ii were obtained between 1993 and 1995 with the 0.9m coudé feed telescope and 2.1 m coudé spectrograph of the Kitt Peak National Observatory, and with the Ultra-High Resolution Facility (UHRF) on the 3.9 m Anglo-Australian Telescope in 1994. All of these epoch 1 data have very high S/N ranging 100-700 averaging around 300, and spectral resolution of . Twenty-one sightlines had two epochs available so the McDonald data set is therefore significantly smaller than that from UVES, but has nearly twice the spectral resolution and a significantly longer interval between epochs. The WHK Nai spectra have higher resolution and so were degraded using a Gaussian of appropriate resolution, for comparison with our later observations. Data were reduced using standard methods within iraf. Spectra were renormalized to remove stellar continua and telluric corrections were applied where necessary in the same manner as described above for the UVES data set.
2.3 McDonald Data
Additional observations were taken at the W.J. McDonald Observatory with the
Tull coudé echelle spectrograph on the 2.7m Harlan J. Smith telescope
(Tull et al., 1995) during May-June 2008 and July 2014. Spectra were acquired
at two different wavelength settings. One setting provided the principal
interstellar lines Ca ii K and Ca i at 4226Å, as well
as the potential for detecting lines from K i at 4044Å and molecules
CH, CH+ and CN. A second setting covered the interstellar Nai D
lines. Both settings provided a resolving power .
The final stellar sample is outlined in Table 2. The galactic coordinates, V-band magnitude, B-V colour and E(B-V) reddening (Hunter et al. 2006), proper motions, parallaxes (van Leeuwen 2007) and spectral types (taken from the POP web site (Bagnulo et al. 2003), WHK and WMH) are listed for each sightline.
| Trans. | ||
|---|---|---|
| (Å) | ||
| Na i | 3302.369 | 0.009 |
| Na i | 3302.978 | 0.005 |
| Ti ii | 3383.759 | 0.358 |
| Fe i | 3719.935 | 0.041 |
| Ti i | 3646.286 | 0.236 |
| Ca ii K | 3933.661 | 0.627 |
| Ca ii H | 3968.470 | 0.312 |
| CN | 3873.999 | 0.023 |
| CN | 3874.607 | 0.034 |
| CH+ | 3957.692 | 0.003 |
| K i | 4044.142 | 0.006 |
| Ca i | 4226.728 | 1.770 |
| CH+ | 4232.548 | 0.006 |
| CH | 4300.313 | 0.005 |
| Na i D2 | 5889.951 | 0.641 |
| Na i D1 | 5895.924 | 0.320 |
| Star | Spectral | Data set | ||||||||
|---|---|---|---|---|---|---|---|---|---|---|
| (deg) | (deg) | (mag) | (mag) | (mag) | (mas yr-1) | (mas yr-1) | (mas) | type | ||
| HD 10840 | 291.7609 | 54.9427 | 6.79 | 0.08 | - | 26.93 0.29 | 5.47 0.34 | 5.55 0.36 | B9p | UVES |
| HD 29138 | 297.987 | 30.5423 | 7.19 | 0.09 | 0.1 | 2.53 0.36 | 8.93 0.45 | 0.16 0.34 | B1Iab | UVES |
| HD 30677 | 190.1808 | 22.2169 | 6.84 | 0.02 | 0.17 | 3.13 0.57 | 4.00 0.39 | 0.89 0.53 | B1II/III((n) | UVES |
| HD 33328 | 209.1402 | 26.6856 | 4.25 | 0.18 | 0.01 | 0.25 0.16 | 1.97 0.11 | 4.02 0.18 | B2IVne | UVES |
| HD 43285 | 203.4236 | 05.1276 | 6.05 | 0.11 | 0.03 | 0.40 0.42 | 17.42 0.32 | 4.99 0.43 | B6Ve | UVES |
| HD 45725 | 216.6614 | 08.2139 | 4.6 | 0.1 | 0.08 | 7.0 1.2 | 5.0 0.9 | - | B3Ve | UVES |
| HD 46185 | 221.9706 | 10.0784 | 6.79 | 0.16 | 0.02 | 4.18 0.57 | 0.31 0.48 | 2.63 0.55 | B2/B3II: | UVES |
| HD 46462 | 245.4745 | 19.6548 | 7.56 | 0.10 | 0.52 | 8.81 0.41 | 9.43 0.57 | 2.93 0.52 | B9 | UVES |
| HD 47116 | 233.174 | 13.9282 | 7.71 | 0.01 | 0.52 | 0.06 0.44 | 5.43 0.49 | 1.53 0.61 | B9p | UVES |
| HD 48099 | 206.2096 | +00.7982 | 6.37 | 0.08 | 0.21 | 0.84 0.41 | 2.5 0.31 | 1.17 0.41 | O7V | UVES |
| HD 49131 | 240.5001 | 14.7267 | 5.8 | 0.19 | 0 | 2.49 0.41 | 3.80 0.53 | 1.72 0.54 | B2III | UVES |
| HD 49333 | 231.3595 | 10.3419 | 6.08 | 0.19 | 0.15 | 14.53 0.43 | 5.12 0.51 | 4.14 0.51 | B7p | UVES |
| HD 50896 | 234.7568 | 10.0832 | 6.74 | 0.06 | 0.17 | 3.76 0.33 | 4.35 0.56 | 0.72 0.62 | WN5 | UVES |
| HD 51876 | 228.0469 | 05.7456 | 7.13 | 0.08 | 0.07 | 0.27 0.48 | 8.70 0.50 | 3 0.59 | B9II | UVES |
| HD 52918 | 218.0123 | +00.6139 | 4.99 | 0.2 | 0.03 | 5.05 0.26 | 2.24 0.19 | 2.68 0.22 | B1V | UVES |
| HD 58343 | 231.0872 | 00.2141 | 5.2 | 0.04 | 0.17 | 4.95 0.47 | 20.21 0.45 | 3.48 0.58 | B2Vne | UVES |
| HD 58377 | 242.1965 | 06.2584 | 6.81 | 0.17 | 0.02 | 7.14 0.32 | 5.69 0.48 | 1.42 0.47 | B5IV | UVES |
| HD 58978 | 237.4106 | 02.9978 | 5.61 | 0.13 | 0.06 | 7.76 0.25 | 4.82 0.34 | 2.61 0.33 | B1II | UVES |
| HD 60498 | 247.1984 | 06.6420 | 7.35 | 0.12 | 0.03 | 8.63 0.29 | 4.18 0.34 | 4.19 0.34 | B4III | UVES |
| HD 61429 | 240.6523 | 01.8360 | 4.7 | 0.11 | 0.01 | 3.03 0.13 | 7.42 0.22 | 5.27 0.26 | B8IV | UVES |
| HD 62714 | 268.5841 | 15.6252 | 7.25 | 0.08 | 0.05 | 14.30 0.51 | 7.15 0.49 | 4.1 0.41 | B7Vp | UVES |
| HD 64972 | 245.0907 | 00.0164 | 7.18 | 0.11 | 0.05 | 9.1 1.5 | 6.8 1.3 | - | B8p | UVES |
| HD 67536 | 276.1126 | 16.1399 | 6.24 | 0.09 | 0.12 | 5.36 0.27 | 11.43 0.21 | 2.72 0.22 | B2.5Vn | UVES |
| HD 68761 | 254.3713 | 01.6188 | 6.53 | 0.09 | 0.13 | 4.44 0.26 | 5.71 0.29 | 1.63 0.34 | B0.5III | UVES |
| HD 72067 | 262.0769 | 03.0778 | 5.83 | 0.16 | 0.05 | 7.00 0.59 | 6.98 0.41 | 2.28 0.49 | B2Vne | UVES |
| HD 74966 | 258.0811 | +03.9290 | 7.43 | 0.14 | 0.01 | 10.03 0.36 | 6.98 0.38 | 2.24 0.52 | B4IV | UVES |
| HD 76131 | 273.5774 | 07.2675 | 6.69 | 0.05 | 0.08 | 16.52 0.30 | 6.16 0.25 | 2.38 0.29 | B6III | UVES |
| HD 76341 | 263.5348 | +01.5210 | 7.17 | 0.22 | 0.49 | 5.16 0.40 | 3.49 0.44 | 0.75 0.48 | O9.7Iab | UVES |
| HD 83312 | 284.7656 | 10.4703 | 7.47 | 0.01 | 0.15 | 13.47 0.48 | 7.24 0.45 | 1.93 0.4 | B4:psh | UVES |
| HD 88661 | 283.0814 | 01.4804 | 5.76 | 0.12 | 0.08 | 10.56 0.37 | 6.81 0.35 | 2.56 0.37 | B2IVe | UVES |
| HD 89587 | 279.8352 | +05.1930 | 6.87 | 0.13 | 0.03 | 10.99 0.33 | 6.46 0.31 | 0.89 0.38 | B3III | UVES |
| HD 90177 | 285.1466 | 01.9838 | 7.57 | 0.86 | 1.07 | 6.87 0.99 | 2.33 0.77 | 1.69 0.82 | B2ev | UVES |
| HD 90264 | 289.0967 | 08.1064 | 4.95 | 0.12 | 0.01 | 22.39 0.20 | 11.48 0.18 | 8.12 0.18 | B8p | UVES |
| HD 90882 | 248.4149 | +44.5898 | 5.18 | 0.04 | 0.01 | 48.86 0.22 | 13.43 0.19 | 10.13 0.23 | B9.5V | UVES |
| HD 92740 | 287.1742 | 00.8475 | 6.42 | 0.08 | 0.08 | 7.71 0.36 | 2.86 0.3 | 0.08 0.34 | WN7A | UVES |
| HD 94910 | 289.1829 | 00.6953 | 7.09 | 0.49 | 0.08 | 5.89 0.83 | 2.45 0.76 | 0.19 0.7 | B2:pe | UVES |
| HD 94963 | 289.7649 | 01.8088 | 7.14 | 0.1 | 0.19 | 7.9 1.3 | 2.8 1.3 | - | O6.5IIIe | UVES |
| HD 100841 | 294.4727 | 01.3974 | 3.12 | 0.04 | 0.03 | 33.41 0.33 | 7.08 0.29 | 7.77 0.34 | B9III | UVES |
| HD 105056 | 298.9454 | 07.0551 | 7.42 | 0.09 | 0.26 | 4.34 0.44 | 1.28 0.4 | 0.21 0.49 | ON9.7Ia | UVES |
| HD 105071 | 298.2376 | 03.0911 | 6.31 | 0.13 | 0.19 | 5.76 0.43 | 0.77 0.32 | 0.05 0.41 | B6Ia/Ib | UVES |
| HD 106068 | 298.5069 | 00.4152 | 5.95 | 0.23 | 0.26 | 5.07 0.30 | 0.52 0.3 | 0.08 0.34 | B8Ia/Iab | UVES |
| HD 109867 | 301.7113 | 04.3511 | 6.26 | 0 | 0.19 | 4.54 0.31 | 1.09 0.28 | 0.54 0.32 | B1Ia | UVES |
| HD 112272 | 303.4864 | 01.4947 | 7.39 | 0.64 | 0.84 | 8.99 0.42 | 8.10 0.34 | 1.4 0.53 | B0.5Ia | UVES |
| HD 112842 | 304.0558 | +02.4766 | 7.08 | 0.15 | 0.25 | 4.24 0.45 | 0.95 0.38 | 0.31 0.52 | B4IV | UVES |
| HD 113904 | 304.6745 | 02.4907 | 5.69 | 0.11 | 0.11 | 4.26 0.39 | 2.18 0.48 | 0.26 0.48 | WC5/B0Ia | UVES |
| HD 115363 | 305.8832 | 00.9683 | 7.82 | 0.5 | 0.69 | 8.48 0.52 | 0.67 0.54 | 0.87 0.68 | B1Ia | UVES |
| HD 115842 | 307.0804 | +06.8343 | 6.04 | 0.21 | 0.41 | 3.04 0.31 | 3.93 0.36 | 0.65 0.44 | B0.5Ia | UVES |
| HD 120709 | 317.2822 | +28.1893 | 4.53 | 0.14 | 0.01 | 34.54 0.78 | 28.21 0.62 | 9.49 0.89 | B5Ip | UVES |
| HD 123515 | 315.1159 | +09.5089 | 5.96 | 0.04 | 0.03 | 32.25 0.32 | 11.63 0.26 | 3.98 0.39 | B8p | UVES |
| HD 125823 | 321.5656 | +20.0226 | 4.40 | 0.17 | 0.05 | 24.15 0.13 | 21.90 0.13 | 7.13 0.16 | B8p | UVES |
| HD 133518 | 323.0822 | +05.4606 | 6.40 | 0.11 | 0.08 | 2.83 0.40 | 12.52 0.48 | 2.21 0.44 | B2IV | UVES |
| HD 136239 | 321.2281 | 01.7448 | 7.87 | 0.77 | 0.94 | 5.70 0.99 | 2.20 0.9 | 0.09 0.9 | B5p | UVES |
| HD 137509 | 315.2529 | 12.1253 | 6.89 | 0.13 | 0.02 | 16.08 0.28 | 14.64 0.4 | 5.11 0.38 | B8p | UVES |
| HD 137753 | 325.9312 | +03.3436 | 6.7 | 0.03 | 0.09 | 7.79 0.39 | 8.97 0.38 | 3.3 0.42 | B7IV | UVES |
| HD 142301 | 347.1237 | +21.5122 | 5.86 | 0.07 | 0.04 | 13.16 0.60 | 25.55 0.46 | 6.33 0.43 | B8p | UVES |
| Star | E(B-V) | Spectral | Data set | |||||||
|---|---|---|---|---|---|---|---|---|---|---|
| (deg) | (deg) | (mag) | (mag) | (mag) | (mas yr-1) | (mas yr-1) | (mas) | type | ||
| HD 142758 | 325.3065 | 04.2765 | 7.08 | 0.14 | 0.31 | 5.38 0.48 | 5.33 0.47 | 0.76 0.51 | B1.5Ia | UVES |
| HD 142983 | 356.3867 | +28.6317 | 2.29 | 0.09 | 0.14 | 12.44 0.25 | 16.73 0.21 | 6.97 0.24 | B8Ia/Iab | UVES |
| HD 143448 | 324.5485 | 05.9714 | 7.30 | 0.00 | 0.16 | 3.88 0.54 | 2.72 0.55 | 1.54 0.58 | B3IVe | UVES |
| HD 145482 | 348.1166 | +16.8354 | 4.57 | 0.15 | 0.06 | 10.38 0.18 | 23.94 0.14 | 6.81 0.16 | B2V | UVES |
| HD 145792 | 351.0096 | +19.0290 | 6.42 | 0.08 | 0.14 | 8.89 0.71 | 20.23 0.47 | 6.96 0.65 | B6p | UVES |
| HD 145842 | 334.7002 | +02.5325 | 5.12 | 0.10 | 0.01 | 34.39 0.25 | 44.88 0.22 | 8.46 0.26 | B8V | UVES |
| HD 148184 | 357.9328 | +20.6766 | 4.28 | 0.31 | 0.52 | 5.41 0.31 | 21.12 0.24 | 6.21 0.23 | B2Vne | UVES |
| HD 148379 | 337.2456 | +01.5757 | 5.36 | 0.44 | 0.61 | 4.54 1.06 | 1.51 1.27 | 1.79 0.7 | B1.5Iae | UVES |
| HD 148688 | 340.7197 | +04.3474 | 5.33 | 0.27 | 0.46 | 4.35 0.37 | 1.37 0.29 | 1.2 0.33 | B1Ia | UVES |
| HD 148937 | 336.3661 | 00.2181 | 6.77 | 0.24 | 0.09 | 1.51 0.86 | 3.57 0.77 | 2.35 0.79 | O6.5e | UVES |
| HD 152003 | 343.3324 | +01.4077 | 6.99 | 0.29 | 0.53 | 2.5 1 | 2.5 1 | - | O9Iab | UVES |
| HD 152235 | 343.3111 | +01.1041 | 6.34 | 0.42 | 0.61 | 1.07 0.56 | 3.30 0.39 | 1.05 0.57 | B0.7Ia | UVES |
| HD 154811 | 341.0616 | 04.2191 | 6.93 | 0.4 | 0.46 | 1.13 0.62 | 3.86 0.43 | 2.34 0.69 | OC9.7Iab | UVES |
| HD 154873 | 341.3454 | 04.1096 | 6.70 | 0.28 | 0.47 | 1.47 0.72 | 4.83 0.57 | 2.16 0.72 | B1Ib | UVES |
| HD 155416 | 348.7532 | +00.6515 | 6.90 | 0.3 | 0.34 | 0.26 0.59 | 2.32 0.27 | 0.9 0.54 | B7II | UVES |
| HD 155806 | 352.5858 | +02.8683 | 5.61 | 0.06 | 0.23 | 0.92 0.36 | 3.05 0.19 | 0.89 0.4 | O7.5Ve | UVES |
| HD 156385 | 343.1641 | 04.7627 | 6.92 | 0.05 | 0.35 | 1.75 0.61 | 3.89 0.3 | 0.26 0.57 | WC7 | UVES |
| HD 157038 | 349.9548 | 00.7940 | 6.41 | 0.64 | 0.81 | 1.33 0.52 | 0.07 0.25 | 0.51 0.42 | B1/B2Ia | UVES |
| HD 163745 | 350.5576 | 08.7882 | 6.5 | 0.09 | 0.01 | 1.43 0.52 | 3.77 0.21 | 2.63 0.4 | B5II | UVES |
| HD 163758 | 355.3605 | 06.1042 | 7.32 | 0.02 | 0.34 | 3.3 1.3 | 4.8 1.2 | - | O6.5Iaf | UVES |
| HD 163800 | 7.052 | +00.6878 | 7.01 | 0.31 | 0.6 | 0.01 0.84 | 1.80 0.36 | 1.01 0.66 | O7III | UVES |
| HD 167264 | 10.4557 | 01.7408 | 5.35 | 0 | 0.2 | 1.60 0.57 | 1.51 0.41 | 0.1 0.45 | B0.5Ia/Iab | UVES |
| HD 169454 | 17.5385 | 00.6697 | 6.65 | 0.74 | 0.93 | 2.21 0.87 | 4.49 0.61 | 1.13 0.72 | B1 Ia Ce | UVES |
| HD 170235 | 7.9523 | 06.7282 | 6.59 | 0.07 | 0.28 | 1.00 0.62 | 6.37 0.39 | 1.07 0.61 | B2Vnne | UVES |
| HD 188294 | 32.6528 | 17.7667 | 6.44 | 0.02 | 0.09 | 2.13 0.49 | 30.77 0.46 | 6.42 0.58 | B8V | UVES |
| HD 199728 | 28.537 | 36.5172 | 6.25 | 0.13 | - | 10.07 0.44 | 20.09 0.36 | 6.09 0.42 | B9p | UVES |
| HD 221507 | 355.0398 | 70.3628 | 4.37 | 0.08 | - | 95.97 0.10 | 38.29 0.12 | 18.74 0.15 | B9.5IVmnp … | UVES |
| HD 223640 | 60.5398 | 73.9377 | 5.18 | 0.12 | - | 26.82 0.38 | 4.27 0.3 | 10.23 0.31 | Ap… | UVES |
| HD 91316 | 234.8870 | +52.7674 | 3.870 | 0.15 | 0.04 | 5.93 0.20 | 3.40 0.11 | 0.60 0.18 | B1Iab | McD |
| HD 114330 | 311.4176 | +57.0274 | 4.381 | 0 | 0.01 | -36.28 0.93 | -31.22 0.69 | 10.33 1.09 | A1IVs | McD |
| HD 141637 | 346.0979 | +21.7059 | 4.638 | 0.072 | 0.15 | 14.20 0.33 | 25.12 0.26 | 6.59 0.27 | B1.5Vn | McD |
| HD 143018 | 347.2148 | +20.2305 | 2.89 | 0.19 | 0.04 | 11.42 0.78 | 26.83 0.74 | 5.57 0.64 | B1V | McD |
| HD 143275 | 350.0969 | +22.4904 | 2.291 | -0.086 | 0.14 | -10.21 1.01 | -35.41 0.71 | 6.64 0.89 | B0.2IVe | McD |
| HD 144217 | 353.1929 | +23.5996 | 2.62 | 0.07 | 0.17 | 5.20 0.92 | 24.04 0.64 | 8.07 0.78 | B0.5V | McD |
| HD 144470 | 352.7497 | +22.7730 | 3.946 | -0.046 | 0.18 | -8.98 0.23 | -23.48 0.16 | 6.92 0.26 | B1V | McD |
| HD 147084 | 352.3279 | +18.0503 | 4.55 | 0.84 | 0.24 | -4.32 0.52 | -14.15 0.40 | 3.71 0.54 | A4II/III | McD |
| HD 147165 | 351.3130 | +16.9989 | 2.912 | 0.097 | 0.31 | -10.6 0.78 | -16.28 0.43 | 4.68 0.60 | B2III | McD |
| HD 148184 | 357.9328 | +20.6766 | 4.42 | 0.28 | 0.49 | 5.41 0.31 | 21.12 0.24 | 6.21 0.23 | B1.5Ve | McD |
| HD 149438 | 351.5348 | +12.8081 | 2.814 | 0.201 | 0.49 | 9.89 0.61 | 22.83 0.55 | 6.88 0.53 | B0V | McD |
| HD 149757 | 006.2812 | +23.5877 | 2.578 | 0.017 | 0.30 | 15.26 0.26 | 24.79 0.22 | 8.91 0.20 | O9.5Vnn | McD |
| HD 152614 | 028.7341 | +30.6605 | 4.38 | -0.08 | 0.03 | -53.8 0.22 | -34.04 0.19 | 13.3 0.22 | B8V | McD |
| HD 159561 | 035.8937 | +22.5681 | 2.1 | 0.13 | 0.03 | 108.07 0.87 | 221.570.80 | 67.13 1.06 | A5III | McD |
| HD 184915 | 031.7709 | -13.2866 | 4.960 | -0.03 | 0.19 | 1.63 0.20 | -2.65 0.10 | 1.94 0.20 | B0.5III | McD |
| HD 186882 | 078.7096 | +10.2430 | 2.900 | 0.019 | 0.02 | 44.07 0.46 | 48.66 0.49 | 19.77 0.48 | B9.5III | McD |
| HD 197345 | 084.2847 | +01.9975 | 1.25 | 0.09 | 0.02 | 2.01 0.34 | 1.85 0.27 | 2.31 0.32 | A2Iae | McD |
| HD 198183 | 078.0844 | 04.3378 | 4.75 | 0.12 | 0.03 | 14.71 0.32 | 8.96 0.49 | 4.24 0.43 | B6IV | McD |
| HD 200120 | 088.0296 | +00.9707 | 4.74 | 0.05 | 0.17 | 8.12 0.42 | 2.15 0.50 | 2.3 0.42 | B1.5Vnne | McD |
| HD 202904 | 080.9767 | 10.0526 | 4.43 | 0.11 | 0.10 | 10.03 0.33 | 6.49 0.38 | 5.08 0.55 | B2Ve | McD |
| HD 212571 | 066.0067 | 44.7394 | 4.794 | 0.168 | 0.06 | 17.83 0.27 | 2.41 0.20 | 4.17 0.28 | B1Ve | McD |
2.4 Stellar distances and proper motions
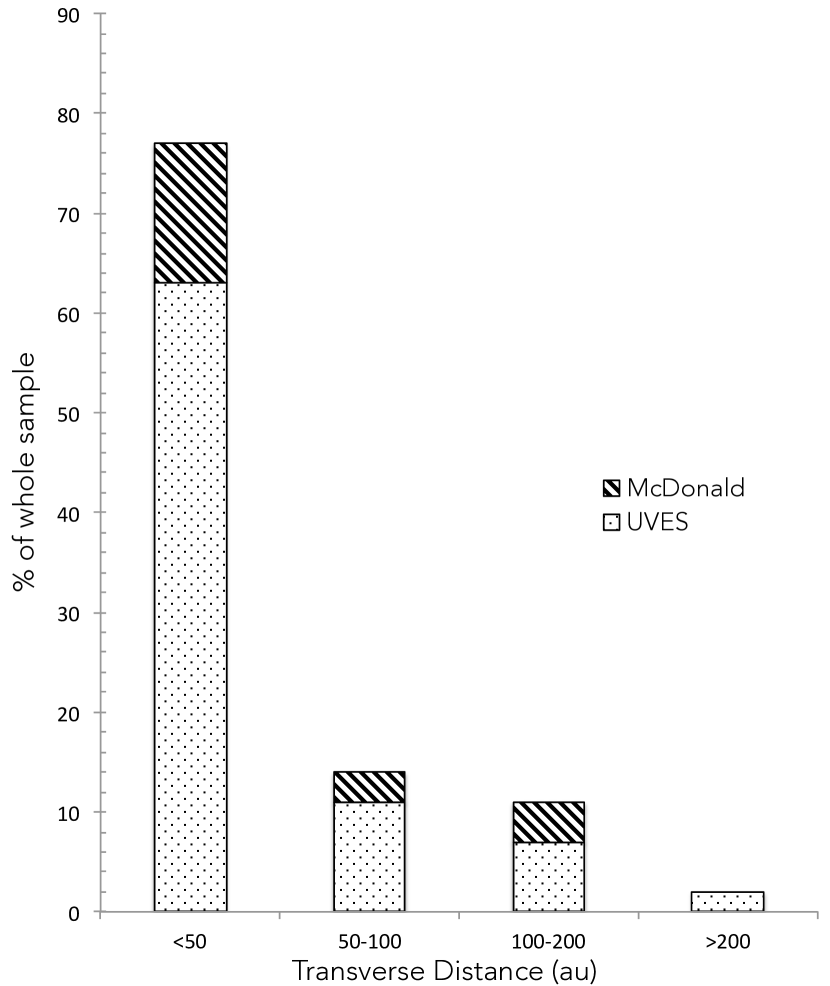
Stellar distances, and values were, in most cases, taken from van Leeuwen (2007) and Hunter et al. (2006), taking the most accurate measurement in each case. For some sightlines neither Hunter et al. (2006) nor van Leeuwen (2007) gave distance estimates and so values were taken from the literature. These cases are referenced in Table 3. Most distances were calculated from the parallax recorded in van Leeuwen (2007) as these tended to be the most reliable. The distance estimates from Hunter et al. (2006) were calculated using the spectroscopic parallax methodology given in Diplas & Savage (1994). The distances, along with the proper motions of the stars (van Leeuwen, 2007) were used to calculate the transverse displacement on the sky during the interval between epochs by trigonometry, to allow us to set some limits on the scale over which any variation in the ISM occurred. We must note that there is no way to account for the motion of the clouds themselves which could act to increase or decrease this estimate on the scale of the structure in question, for example, if we assume the cloud itself to have a transverse velocity of 5 km s-1, then in 6 yr it will have moved 6 au, and depending on the direction of this motion, it could increase or decrease our transverse distance estimates calculated using the proper motion of the background star. We can therefore only say that the distance the star has moved across the sky is an indicator of the true scale of the ISM structure. Table 2 lists our final sample, whilst Fig. 1 shows a histogram of the transverse distance moved for the 104 stars between the two epochs.
2.5 Column Densities
For sightlines where variations were detected, column densities were calculated using the vapid suite (Howarth et al., 2002). This assumes Gaussian line of sight velocity distributions of pure absorbers in each cloud (Strömgren, 1948), and so can obtain values for column density (), central velocity () and velocity dispersion () for each component of a specified absorption profile by fitting multiple Voigt profiles. Even at the high spectral resolution of the current study it is likely that most components will be unresolved at least in the UVES data set. WHK investigated the statistics of line widths and component separations at a significantly higher resolution than our UVES data. They found a median (Na i) of 0.73 km s-1and median separation between adjacent components of about 2 km s-1(their figs. 5 and 7). Even at such high resolutions, these values are expected to be over estimates of the true values, and so the likelihood of unresolved structure in our UVES data is very high.
For Na I, the D1 and D2 lines were fitted simultaneously, as were the H and K lines of Ca II. As very few velocity components showed variation between epochs, these stable components were measured in epoch one and fixed when fitting epoch 2, allowing us to accurately quantify the change in column densities in the varying components.
Column densities for all varying sightlines were recalculated, changing the instrumental resolution by 10 % and fixing the velocity values within vapid, allowing the -value and column density to vary freely. In most cases the differences derived due to the change in resolution were negligible, and well within the errors presented for the column densities. The only sightlines where larger variations due to this change in resolution were found, were in the particularly narrow components. However, even in these cases the variation caused by changing the instrumental -value was small when compared with the variation seen between epochs.
3 Results
In this section the results of the search for time variability in the twin-epoch spectra are discussed. We note that O- and B-type stars have high multiplicity (Mason et al., 2009; Sana et al., 2013), and so great care must be taken not to confuse variations in stellar or circumstellar features with interstellar ones. Each pair of spectra and their residuals in the transitions listed in Table 1 were searched by eye for evidence of differences between epochs. Only the strong lines of Na i D, Ca ii H&K and the weaker Ca i showed convincing evidence for significant interstellar variation. The Na i D lines and Ca ii H&K transitions each form a doublet, so putative variations were required to be present in both components of the doublet before they were accepted as real. For Ca i, the variations are always seen at the same velocity as corresponding variations in Na i or Ca ii which provides confidence in their reality.
Of the total 83 twin-epoch UVES spectra analysed, 80% show no significant difference between the two epochs in any species. 2% show variation caused by eclipsing companions, 12% show changes that are probably due to circumstellar material, and 6% show possible time variation in one or more velocity component caused by interstellar absorption - typically there are 5 velocity components per sightline. The sightlines where stellar or circumstellar variation are visible could also exhibit interstellar variations but they would be hidden due to the more prominent stellar-circumstellar profile changes. For the McDonald data, none of the sightlines show any substantial or convincing interstellar time variation. The following subsections discuss each of the time-varying spectra.
| Star | Distance () | Epoch 1 | epoch 2 | Interval | Traversed distance | |
|---|---|---|---|---|---|---|
| (pc) | ref. | date of observation | date of observation | (yr) | (au) | |
| HD 10840 | 180 11.7 | p | 14-09-2002 | 03-06-2008 | 5.7 | 28.3 1.9 |
| HD 29138 | 3530 1059 | s | 21-01-2002 | 20-06-2008 | 6.4 | 210 63.9 |
| HD 30677 | 1124 669 | p | 28-02-2002 | 26-07-2008 | 6.4 | 36.6 22.0 |
| HD 33328 | 249 11 | p | 15-10-2002 | 04-04-2008 | 5.5 | 2.70 0.2 |
| HD 43285 | 200 17 | p | 23-02-2002 | 28-08-2008 | 6.5 | 22.8 2.0 |
| HD 45725 | 184 55 | s | 13-03-2001 | 04-04-2008 | 7.1 | 11.2 3.6 |
| HD 46185 | 380 80 | p | 16-02-2002 | 14-08-2008 | 6.5 | 10.4 2.6 |
| HD 46462 | 341 61 | p | 25-02-2002 | 14-08-2008 | 6.5 | 28.5 5.2 |
| HD 47116 | 654 261 | p | 25-02-2002 | 02-09-2008 | 6.5 | 23.2 9.5 |
| HD 48099 | 855 300 | p | 09-04-2001 | 19-09-2008 | 7.5 | 16.8 6.2 |
| HD 49131 | 581 183 | p | 02-10-2002 | 18-08-2008 | 5.9 | 15.5 5.2 |
| HD 49333 | 242 30 | p | 13-09-2002 | 18-08-2008 | 5.9 | 22.1 2.8 |
| HD 50896 | 1389 1196 | p | 20-01-2002 | 17-09-2008 | 6.7 | 53.2 46.0 |
| HD 51876 | 333 66 | p | 14-02-2003 | 13-09-2008 | 5.6 | 16.2 3.3 |
| HD 52918 | 373 31 | p | 26-10-2002 | 04-04-2008 | 5.4 | 11.2 1.1 |
| HD 58343 | 287 48 | p | 13-03-2001 | 04-04-2008 | 7.1 | 42.2 7.1 |
| HD 58377 | 448 134 | s | 14-02-2003 | 03-09-2008 | 5.6 | 22.7 6.9 |
| HD 58978 | 383 48 | p | 03-10-2002 | 21-09-2008 | 6.0 | 20.9 2.7 |
| HD 60498 | 239 19 | p | 15-02-2003 | 19-09-2008 | 5.6 | 12.8 1.1 |
| HD 61429 | 190 9.4 | p | 29-11-2001 | 04-04-2008 | 6.4 | 9.66 0.5 |
| HD 62714 | 244 24 | p | 25-02-2002 | 17-09-2008 | 6.6 | 25.6 2.7 |
| HD 64972 | 2858 857 | s | 27-11-2002 | 17-04-2008 | 5.4 | 175 56.9 |
| HD 67536 | 368 30 | p | 26-10-2002 | 17-04-2008 | 5.5 | 25.4 2.1 |
| HD 68761 | 613 128 | p | 25-02-2002 | 17-04-2008 | 6.1 | 27.3 5.8 |
| HD 72067 | 439 94 | p | 17-11-2001 | 17-04-2008 | 6.4 | 27.8 6.2 |
| HD 74966 | 446 104 | p | 11-12-2002 | 17-04-2008 | 5.4 | 29.2 6.8 |
| HD 76131 | 420 51 | p | 15-02-2003 | 17-04-2008 | 5.2 | 38.3 4.7 |
| HD 76341 | 2365 709 | s | 24-02-2002 | 17-04-2008 | 6.1 | 90.6 27.8 |
| HD 83312 | 518 107 | p | 15-01-2003 | 17-04-2008 | 5.3 | 41.7 8.7 |
| HD 88661 | 391 56 | p | 08-02-2001 | 17-04-2008 | 7.2 | 35.3 5.2 |
| HD 89587 | 900 270 | s | 30-11-2001 | 17-04-2008 | 6.4 | 73.2 22.1 |
| HD 90177 | 255 76 | s | 08-10-2002 | 07-06-2008 | 5.7 | 10.5 3.4 |
| HD 90264 | 123 2.7 | p | 26-02-2002 | 03-04-2008 | 6.1 | 18.9 0.4 |
| HD 90882 | 99 2.2 | p | 24-11-2001 | 03-04-2008 | 6.4 | 31.8 0.7 |
| HD 92740 | 2600 – | b | 02-01-2003 | 17-04-2008 | 5.3 | 113 – |
| HD 94910 | 6000 1000 | c | 11-01-2003 | 08-06-2008 | 5.4 | 207 43.6 |
| HD 94963 | 3257 977 | s | 25-02-2002 | 17-04-2008 | 6.1 | 168 56.7 |
| HD 100841 | 129 5.6 | p | 23-06-2001 | 17-04-2008 | 6.8 | 30.0 1.3 |
| HD 105056 | 5184 – | b | 23-02-2002 | 26-06-2008 | 6.3 | 149 – |
| HD 105071 | 3482 1044 | s | 26-02-2002 | 17-04-2008 | 6.1 | 124 38.4 |
| HD 106068 | 2824 847 | s | 20-07-2001 | 17-04-2008 | 6.7 | 97.1 29.7 |
| HD 109867 | 3264 979 | s | 26-02-2002 | 17-04-2008 | 6.1 | 93.6 28.7 |
| HD 112272 | 714 270 | p | 26-02-2002 | 17-04-2008 | 6.1 | 53.1 20.2 |
| HD 112842 | 2126 638 | s | 15-02-2003 | 17-04-2008 | 5.2 | 47.8 15.2 |
| HD 113904 | 2817 845 | s | 22-07-2001 | 17-04-2008 | 6.7 | 90.9 28.4 |
| HD 115363 | 3282 984 | s | 26-02-2002 | 26-06-2008 | 6.3 | 177 54.1 |
| HD 115842 | 2157 647 | s | 25-02-2002 | 17-04-2008 | 6.1 | 65.9 20.3 |
| HD 120709 | 105 10 | p | 24-06-2001 | 03-04-2008 | 6.8 | 31.9 3.0 |
| HD 123515 | 251 25 | p | 05-08-2002 | 17-04-2008 | 5.7 | 49.1 4.8 |
| HD 125823 | 140 3.1 | p | 13-03-2001 | 03-04-2008 | 7.1 | 32.3 0.7 |
| HD 133518 | 452 90 | p | 13-03-2001 | 17-04-2008 | 7.1 | 41.2 8.4 |
| HD 136239 | 2350 705 | s | 22-02-2002 | 17-04-2008 | 6.2 | 88.4 30.0 |
| HD 137509 | 196 15 | p | 11-07-2001 | 17-04-2008 | 6.8 | 28.8 2.2 |
| HD 137753 | 303 39 | p | 14-02-2003 | 17-04-2008 | 5.2 | 18.6 2.4 |
| HD 142301 | 158 11 | p | 13-03-2001 | 09-04-2008 | 7.1 | 32.1 2.3 |
| HD 142758 | 1316 883 | p | 26-02-2002 | 17-04-2008 | 6.1 | 61.2 41.3 |
Distance reference codes: p - distances calculated from the parallax recorded in van Leeuwen (2007).
s - distances calculated spectroscopically (Hunter et al., 2006).
| Star | Distance () | Epoch 1 | epoch 2 | Interval | Traversed distance | |
|---|---|---|---|---|---|---|
| (pc) | ref. | date of observation | date of observation | (yr) | (au) | |
| HD 142983 | 143 4.9 | p | 11-07-2001 | 03-04-2008 | 6.7 | 20.1 0.7 |
| HD 143448 | 649 245 | p | 26-02-2002 | 17-04-2008 | 6.1 | 18.9 7.4 |
| HD 145482 | 147 3.5 | p | 13-08-2002 | 09-04-2008 | 5.7 | 21.7 0.5 |
| HD 145792 | 144 13 | p | 06-10-2002 | 09-04-2008 | 5.5 | 17.5 1.7 |
| HD 145842 | 118 3.6 | p | 26-02-2002 | 03-04-2008 | 6.1 | 40.8 1.3 |
| HD 148184 | 161 6.0 | p | 26-02-2002 | 03-04-2008 | 6.1 | 21.4 0.8 |
| HD 148379 | 559 218 | p | 26-02-2002 | 09-04-2008 | 6.1 | 16.4 7.4 |
| HD 148688 | 833 229 | p | 14-09-2002 | 09-04-2008 | 5.6 | 21.2 6.1 |
| HD 148937 | 426 143 | p | 26-02-2002 | 09-04-2008 | 6.1 | 10.1 4.0 |
| HD 152003 | 2687 806 | s | 26-02-2002 | 09-04-2008 | 6.1 | 58.1 24.0 |
| HD 152235 | 952 517 | p | 03-10-2002 | 09-04-2008 | 5.5 | 18.2 10.1 |
| HD 154811 | 427 126 | p | 03-09-2002 | 09-04-2008 | 5.6 | 9.63 3.0 |
| HD 154873 | 463 154 | p | 07-10-2002 | 09-04-2008 | 5.5 | 12.9 4.5 |
| HD 155416 | 1278 383 | s | 27-07-2001 | 09-04-2008 | 6.7 | 20.0 6.4 |
| HD 155806 | 1064 319 | s | 11-07-2001 | 09-04-2008 | 6.8 | 22.9 7.0 |
| HD 156385 | 1300 – | d | 14-10-2002 | 17-04-2008 | 5.5 | 30.6 – |
| HD 157038 | 1444 433 | s | 22-09-2002 | 03-06-2008 | 5.7 | 11.0 5.4 |
| HD 163745 | 380 58 | p | 19-06-2001 | 27-05-2008 | 6.9 | 10.6 1.8 |
| HD 163758 | 4103 1231 | s | 27-07-2001 | 09-04-2008 | 6.7 | 160 58.9 |
| HD 163800 | 1621 486 | s | 29-09-2002 | 23-06-2008 | 5.7 | 16.7 6.0 |
| HD 167264 | 2109 632 | s | 12-07-2001 | 27-05-2008 | 6.9 | 31.9 12.0 |
| HD 169454 | 1359 407 | s | 13-09-2002 | 23-06-2008 | 5.8 | 39.3 12.9 |
| HD 170235 | 501 150 | s | 10-07-2001 | 19-04-2008 | 6.8 | 21.9 7.0 |
| HD 188294 | 156 14 | p | 12-07-2001 | 23-04-2008 | 6.8 | 32.6 3.0 |
| HD 199728 | 164 11 | p | 29-11-2002 | 23-06-2008 | 5.6 | 20.6 1.5 |
| HD 221507 | 53.4 0.4 | p | 09-06-2002 | 27-05-2008 | 6.0 | 32.9 0.3 |
| HD 223640 | 97.8 3 | p | 13-08-2002 | 03-06-2008 | 5.8 | 15.4 0.5 |
| HD 091316 | 1346 403 | s | – | 29-05-2008 | 20.0 ∗ | 184 55.3 |
| HD 114330 | 97 10 | p | 27-05-2008 | 04-07-2014 | 6.1 | 28.3 3.0 |
| HD 141637 | 152 6.2 | p | 23-06-1988 | 28-05-2008 | 19.9 | 167 50.1 |
| HD 143018 | 180 21 | p | 21-06-1988 | 28-05-2008 | 19.9 | 104 30.9 |
| HD 143275 | 151 20 | p | 31-05-2008 | 06-07-2014 | 6.1 | 38.9 11.7 |
| HD 144217 | 124 12 | p | – | 27-05-2008 | 20.0 ∗ | 77.2 23.2 |
| HD 144470 | 145 5.4 | p | 01-05-2008 | 06-07-2014 | 6.2 | 37.2 11.0 |
| HD 147084 | 270 39 | p | 28-05-2008 | 04-07-2014 | 6.1 | 24.3 3.6 |
| HD 147165 | 214 27 | p | 28-05-2008 | 04-07-2014 | 6.1 | 22.1 6.6 |
| HD 148184 | 161 6.0 | p | 30-05-2008 | 04-07-2014 | 6.1 | 21.4 0.8 |
| HD 149438 | 145 11 | p | 21-06-1988 | 30-05-2008 | 20.0 | 72.0 5.7 |
| HD 149757 | 112 2.5 | p | 10-06-1905 | 28-05-2008 | 20.0 ∗ | 116 34.4 |
| HD 152614 | 75 1.2 | p | 30-05-2008 | 06-07-2014 | 6.1 | 29.2 0.5 |
| HD 159561 | 15 0.2 | p | 28-05-2008 | 06-07-2014 | 6.1 | 22.6 22.6 |
| HD 184915 | 515 53 | p | 27-05-2008 | 04-07-2014 | 6.1 | 12.4 3.7 |
| HD 186882 | 51 1.2 | p | – | 27-05-2008 | 20.0 ∗ | 49.9 14.4 |
| HD 197345 | 433 60 | p | 29-05-2008 | 06-07-2014 | 6.1 | 7.22 1.29 |
| HD 198183 | 236 24 | p | 29-05-2008 | 06-07-2014 | 6.1 | 24.8 2.6 |
| HD 200120 | 435 79 | p | 23-06-1988 | 31-05-2008 | 20.0 | 49.6 15.1 |
| HD 202904 | 197 21 | p | 11-10-1989 | 30-05-2008 | 18.6 | 53.2 15.9 |
| HD 212571 | 240 16 | p | 31-05-2008 | 06-07-2014 | 6.1 | 45.8 13.7 |
∗ epoch interval presumed to be 20 yr as no specific observation date available for epoch 1(observed between 1987 and 1989)
Distance reference codes: p - distances calculated from the parallax recorded in van Leeuwen (2007).
s - distances calculated spectroscopically (Hunter et al., 2006).
3.1 Sightlines that show time variation in stellar or circumstellar spectra
Several of our sightlines show variations in the stellar spectra or circumstellar environment. Four such stars (HD 125823, HD 137509, HD 199728 and HD 22364) are classified as magnetic chemically peculiar stars (Kochukhov & Bagnulo, 2006), while HD 145792 is classified as a chemically peculiar, helium strong star (Catanzaro, 2008), and so variations in the spectra between epochs are to be expected. Some of the other stars have been grouped by their spectral classification below, explaining their spectral variations.
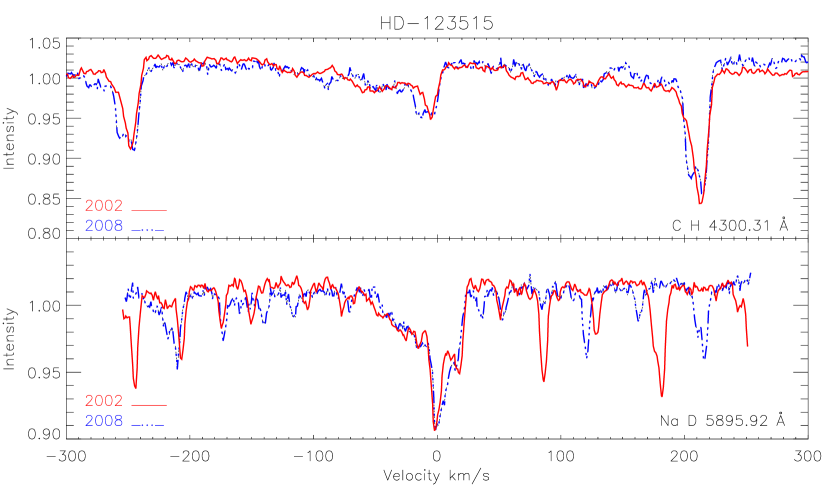
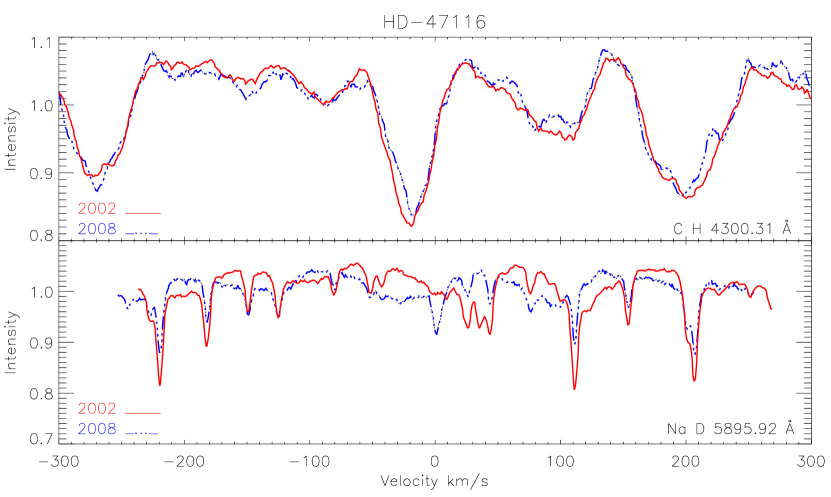
3.1.1 Binary systems HD 123515 and HD 47116
HD 123515 is a short-period double-lined spectroscopic binary pulsating star (Aerts et al., 1999). Figure 2 shows CH (4300Å) and Na i D2 (5895Å) spectra towards the object at the two epochs. HD 47116 is also a star in a double system as can be seen from its spectra in Fig. 3.
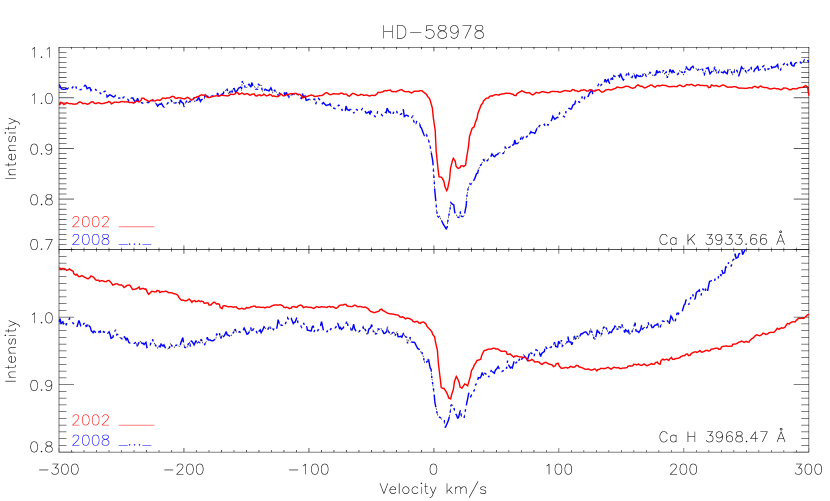
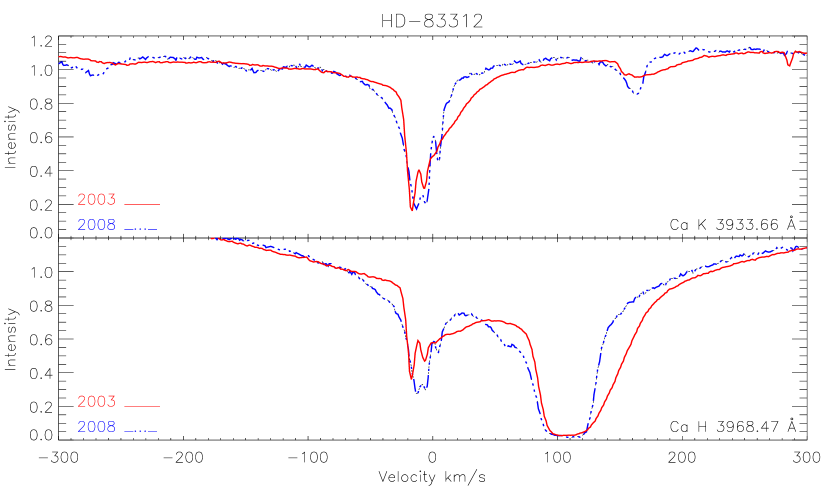
3.1.2 B(e) stars HD 58978, HD 83312, HD 90177, HD 94910 and HD 148184
These five objects, whose spectra show significant variation, are in fact B(e) stars. Two examples are HD 58978 and HD 83312 whose twin-epoch spectra are shown in Figs. 4 and 5, respectively. HD 58978 (FY CMa) is a well-studied object and was found to be a B(e)+sdO binary with a period of 37.260.03 days by Rivinius et al. (2004). It shows strong shell phases and ionization in the outer parts of the circumstellar disc. Less studied is the emission-line star HD 83312 (Henize, 1976) which is part of the catalogue of young runaway stars within 3 kpc of the Sun (Tetzlaff, Neuhäuser & Hohle, 2011). The spectra of a typical Be star often shows clumpy winds with discrete accelerating components (Štefl et al., 2012, and references therein). HD 94910, HD 90177 and HD 148184 have also been widely studied, (e.g. Burbidge, 1952; Henize, 1952) and show the similar spectral characteristics of B(e) stars. Any ISM lines have profiles so compromised by the stellar variation in such sightlines, that we therefore classify the changes in these spectra as circumstellar in nature, and their ISM lines are not discussed further.
3.2 Possible time-variable spectra in the interstellar medium
In total fix targets (6%) from the UVES sample show apparent temporal variations in interstellar lines, which are unlikely to be explained by stellar changes. A summary of all the sightlines where possible variation is seen can be found in Table 4, and are discussed individually below.Although it is possible that some variations may be caused by slight resolution differences between epochs (see Sect. 2.5), had this been the case it would be expected that variation would be much more frequently observed throughout the data set. As 80 % show no variation we are convinced that these five sightlines show genuine evidence of fine-scale structure.
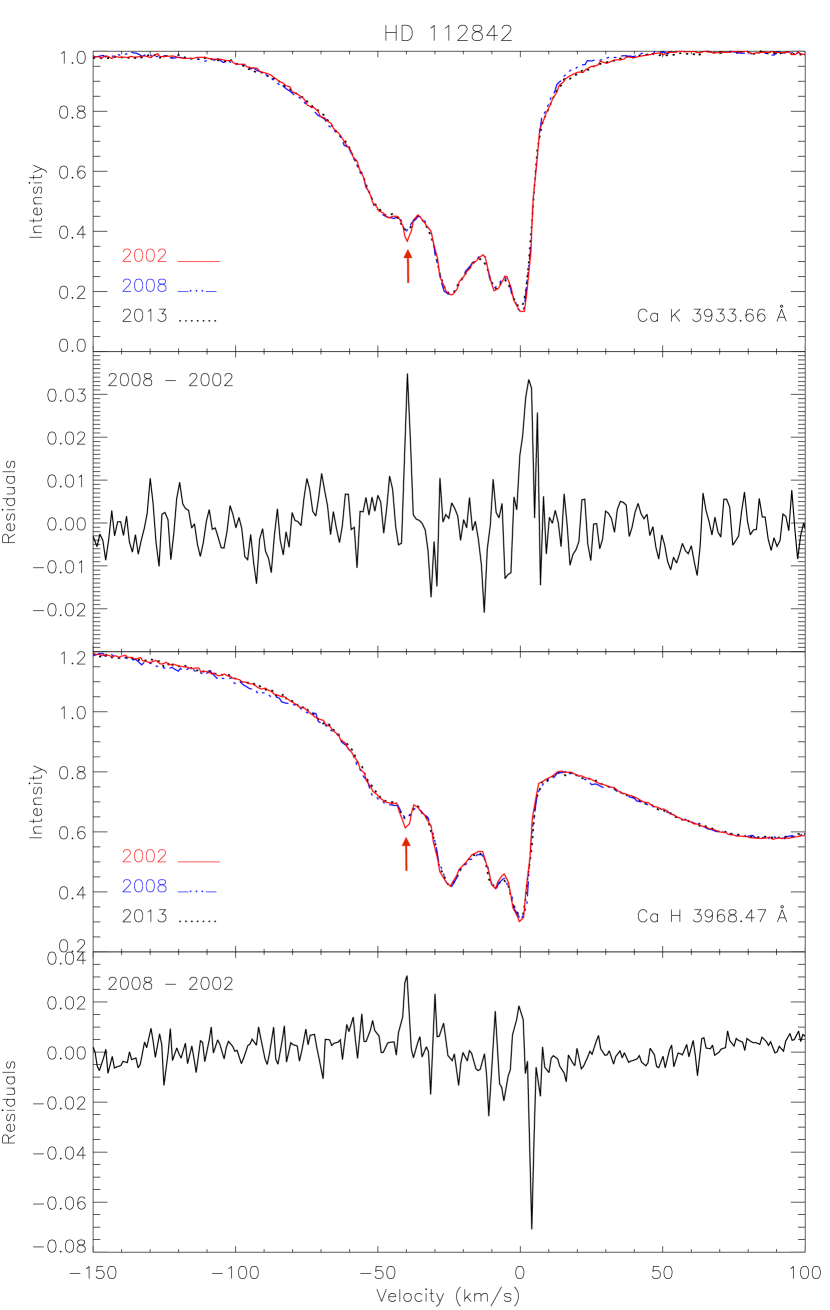
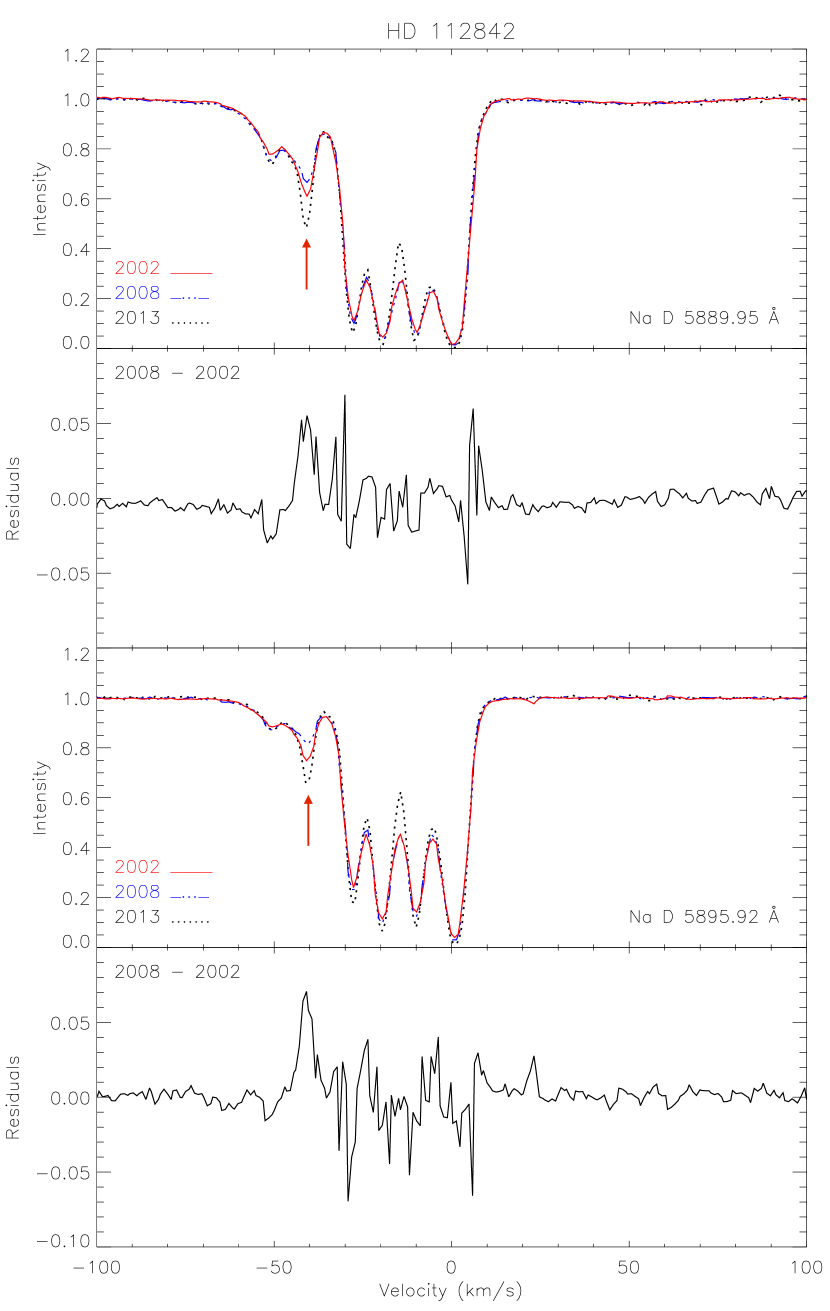
3.2.1 HD 112842 – possible Na i D and Ca ii H & K variations
Possible variations can be seen in intermediate velocity gas in the profiles of both the Na i D and in Ca ii H & K lines in this sight line (Fig. 6 and Fig. 7), with the components at km s-1 stronger in epoch 1 in all cases. The proper motion of this star is 9.2 au yr-1, and there are 5.2 yr between epochs 1 and 2. Hence the star has travelled 48 au perpendicular to the line of sight between epochs. The column density of the km s-1 components decrease from =11.45 0.01 to 11.36 0.02, =11.72 0.12 to 11.33 0.11, or a change of 19 percent in Na I and a factor of 2.5 in Ca ii. No variations are seen in other species. For this sightline we have obtained 3rd epoch observations on 29 November 2013, which are also plotted in Fig. 6 and Fig. 7. It can clearly be seen in Ca ii H & K that there is no variation at all in the 5.6 yr and 51.9 au between epoch 2 and 3, and so residuals plotted are between epoch 1 and 2. For Na i D, resolution changes are visible between 2008 and 2013, making it impossible to quantify if there is any real variation in the 3rd epoch, and so the residuals plotted are once again, only between the earlier two epochs. To verify that the variation is not solely due to differences in the resolution between epochs, Gaussian smoothing was applied to the data in an effort to make the effective instrumental resolution the same in all epochs. It was found that changes in resolution could not force all components to match in all epochs, implying that the variation is real. Ca i may also show a decrease between epoch 1 and 2, although the quality of the epoch 2 data is not optimal at this wavelength to see convincing variation and the Ca i lines are weak.
HD 112842 is at a distance of 2.10.5 kpc and lies in the Centaurus OB1 stellar association. Observations of H i towards this region have revealed a large expanding shell (GSH 305+04-26) with a velocity range of to km s-1 and estimated distance of 2.50.9 kpc and dimensions of 440 270 pc (Corti, Arnal & Orellana, 2012). As HD 112842 is predicted to be closer than the H i shell, this implies there is fine-scale structure in the normal diffuse ISM. However, the errors on the distances are large and so there remains the possibility that the variation seen is caused by part of the shell. Na i absorption is detected in the velocity range, although the variable component is more blue-shifted than expected for the shell.
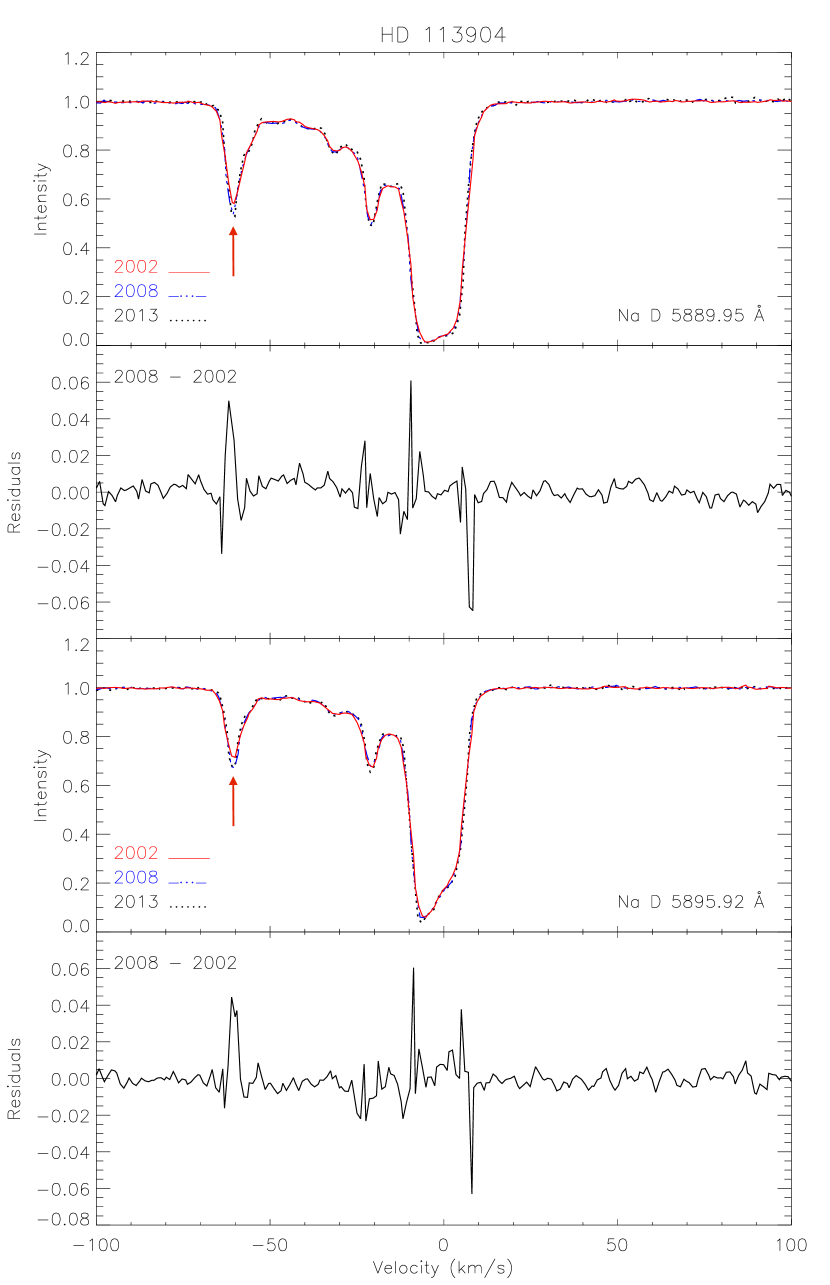
3.2.2 HD 113904 - Possible Na i D variations
HD 113904 ( Mus) is a WR star with a binary companion (WR 48 WC5+O6/7V) and possibly has an additional O9.5/B0Iab-type supergiant companion (Sugawara, Tsuboi & Maeda, 2008), located in the same area of the sky as the Centaurus OB1 association. However the proper motion of the star is in the opposite direction to the members of this association. Hence, Corti, Arnal & Orellana (2012) deem it is unlikely to be part of Cen OB1. Stupar, Parker & Filipović (2010) give the distance as between 0.9 and 1.3 kpc, and from H imaging postulate that the nebulosity seen near to the star is not a WR shell but in fact a possible optical supernova remnant and complex of H ii regions.
The bluest-shifted component, (see Fig. 8), at km s-1, shows possible variations in intermediate velocity gas in both Na i lines in this sightline, with stronger absorption at epoch 2. As the proper motion of this star is 13.48 au yr-1, and there are 6.7 yr between observations, the transverse displacement is 91 au. Although these variations are small – for this component increases from 11.52 0.01 dex to 11.56 0.01 dex (10 percent) – they can be seen in the residual plots. For this sightline, we have obtained 3rd epoch observations from 29 November, 2013 which are also plotted in Fig. 8. No variation is visible over the 75.8 au traversed between 2008 and 2013, so the residuals plotted are only between the earlier two epochs. There are some instrumental effects acting upon these spectra, as we can see the resolution is not identical for all three epochs. However, the variation we do see is strong enough to be identified despite these slight differences in resolution.
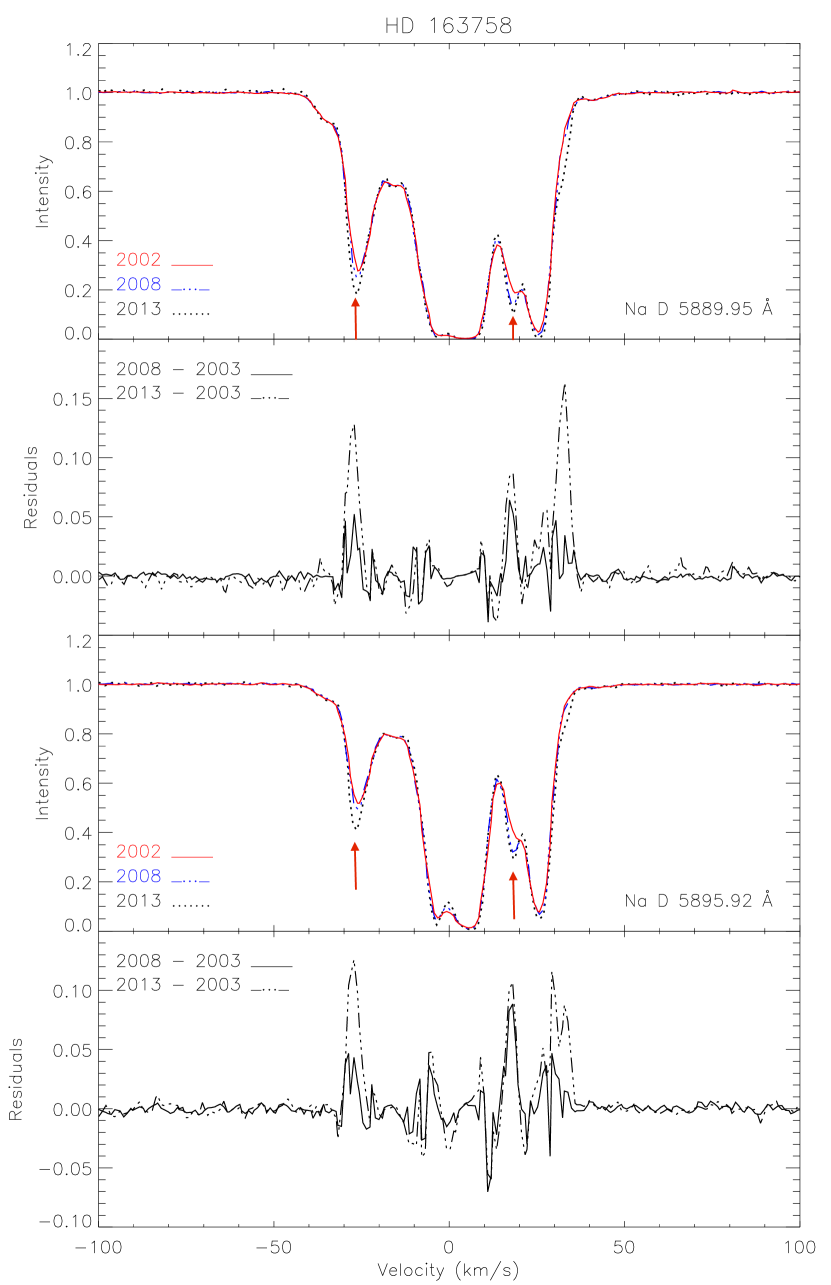
3.2.3 HD 163758 - Possible Na i D variations
HD 163758 is a WR star of spectral type O6.5Iaf at a distance of 4.1 1.2 kpc. For this sightline we were able to acquire epoch 3 data, observed on 19 September 2013. In Fig. 9 we can clearly see variations in two of the components of both Na i D lines, at km s-1 and km s-1 between all three epochs. Both components strengthen with time, that at +19 km s-1showing the largest increase from 2002 to 2008 (= 12.08 2.0 to 12.63 2.0, a change of a factor of 3.55) with very little variation between 2008 and 2013. The particularly small -values (of 0.5 km s-1) of these components, mean they are unresolved and therefore uncertain, leading to large errors in the column densities, which should be regarded as approximate estimates. The component at km s-1 strengthens by a small amount between 2002 and 2008, =11.87 0.02 to 11.90 0.01, a 7% change, and then by a much larger degree between 2008 and 2013, to 11.99 0.01, a 32% change. These variations can very clearly be seen in the residual plots of each Na i D line. Between epoch 1 and 2 the star moves 160 au in 6.7 yr and in the 5.4 yr between epoch 2 and 3 travels 130 au. We note, there are some slight differences in resolution between the three epochs due to instrumental effects, as can be seen, for example at 0 km s-1, possibly bringing the weaker variations into question. As the strongly varying component is very narrow, the changes in resolution have more effect on this component. However, even varying the spectral resolutions by 10 percent cannot account for the stronger variations that we see, (see Sect. 2.5).
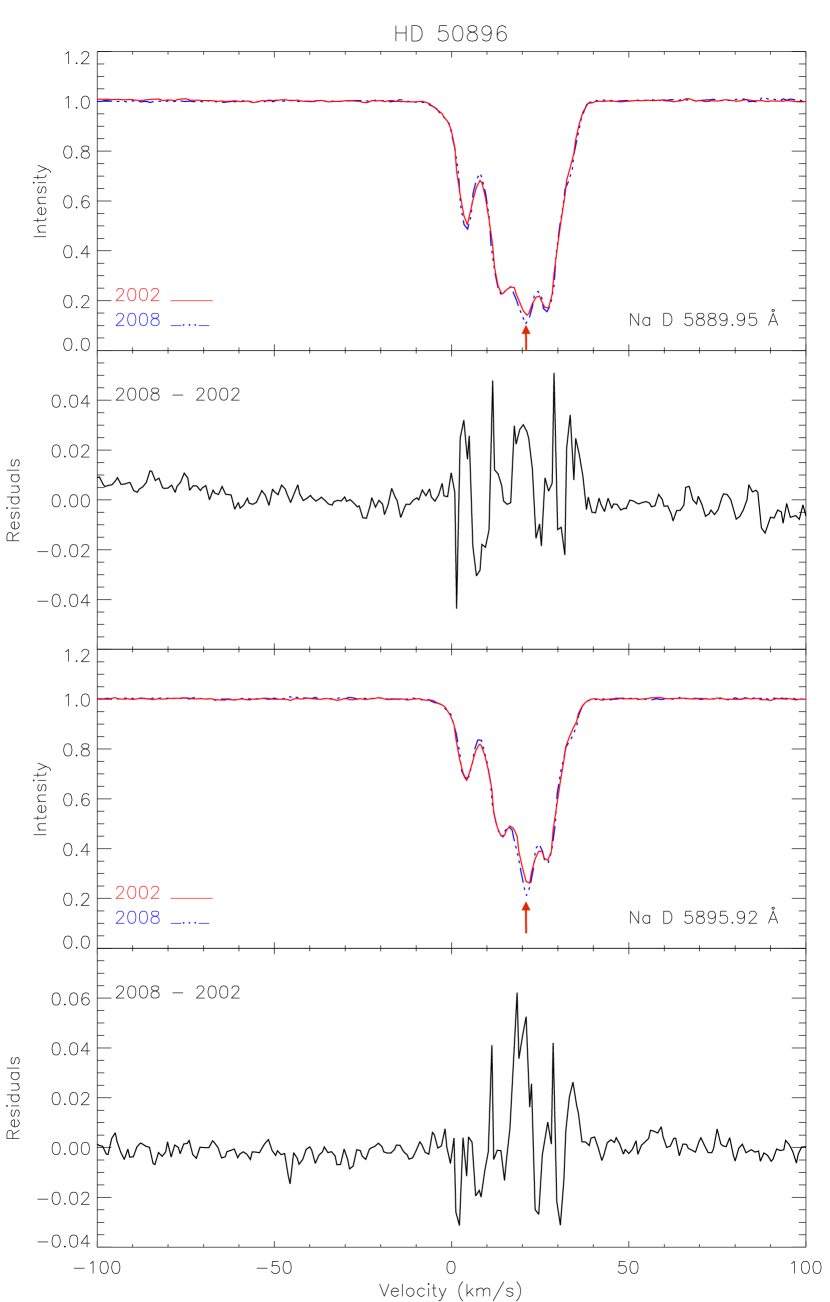
3.2.4 HD 50896 - possible Na i D variations
In the sightline of the well-studied WR star HD 50896 (WR 6) (see Fig. 10), the component at 21.3 km s-1 has strengthened in both Na i D lines by a factor of 2.3, from in epoch 2, showing possible variation in the 6.7 yr between the two observations. These components have particularly small -values (of 0.5 km s-1), meaning they are unresolved and therefore uncertain, leading to large errors in the column densities, which should be regarded as approximate estimates. The proper motion of the star is 7.97 au yr-1, so the transverse displacement is only 53.2 au. These variations are small but tweaking the continuum fitting and resolution would only prove to increase the variations, and so we are sufficiently convinced that these variations are real.
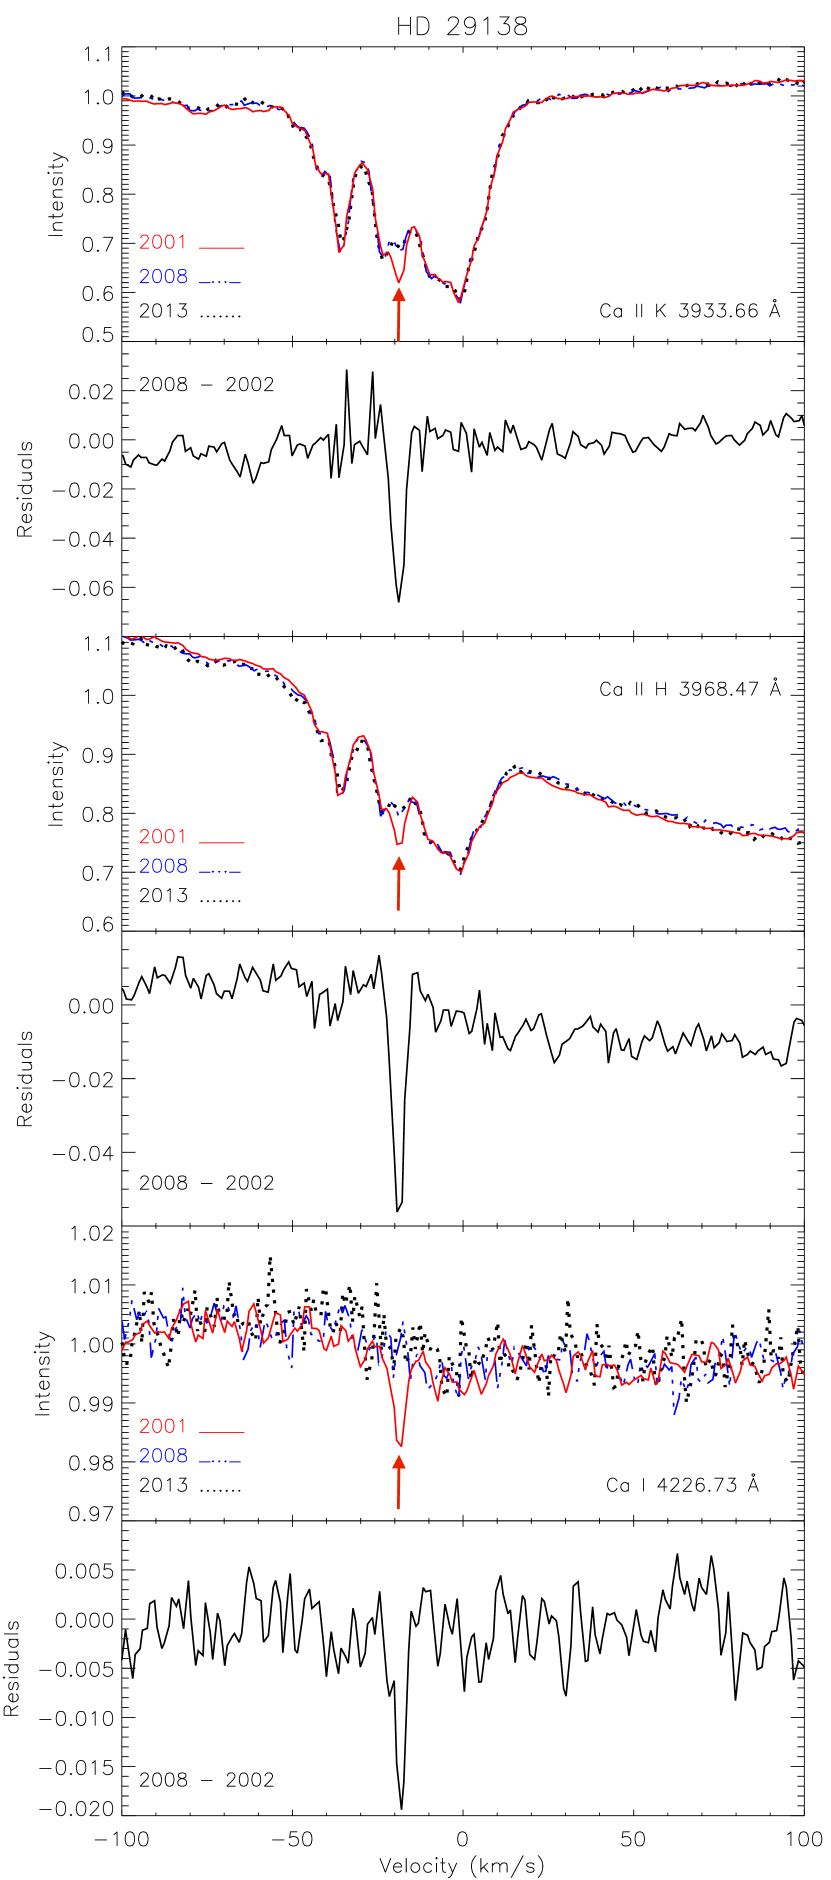
3.3 HD 29138 - Ca i and Ca ii variations
The variations seen in the sightline of HD 29138 are the most dramatic in the whole sample, and can very definitely not be due to differences in spectral resolution, as changing the instrumental resolution of this sightline by 10 percent resulted in no changes in the column densities at all.
HD 29138 is a B1Iab star located far from the plane of the Milky Way ( and pc). Significant variations in Ca i and both Ca ii H&K lines can be seen. All calcium lines show changes at km s-1 where a feature seems to diminish in all three lines in epoch 2 (Fig. 11). The change in the Ca ii column density of this profile is 0.13 dex (or 35 percent), from 11.53 0.05 to 11.40 0.01 dex. As the Ca i component disappears completely in epoch 2, we were only able to measure a column density for epoch 1. However, using the S/N of the spectra at both epochs (see Section 3.4) it was possible to calculate an upper limit for the column density of Ca i in epoch 2. The difference between this upper limit and epoch 1 is 0.47 dex, i.e. the column density decreases from 9.60 0.02 to an upper limit of 9.1 dex (change of a factor of 3.2). As the proper motion of this star is 32.8 au yr-1 these changes in the profiles occur over 210 au, due to the 6.4 yr between epochs. Although the changes are relatively small, the fact that we see variations in three lines and two species at the same velocity indicates that they are real. We do not see obvious variation in Na i or Ti ii (which is usually closely correlated with Ca ii; (Welsh et al., 1997; Hunter et al., 2006)) which could indicate circumstellar variation (c.f. Kiefer et al., 2014). However, the Na D doublet is stronger than the Ca lines and so any small variation would be very difficult to see. epoch 3 data were obtained for this sightline on 19 September, 2013, 5.3 yr after epoch 2 accounting for a transversed distance of 172 au but no further variation is observed.
The epoch 1 data also shows an unresolved line corresponding to Fe i at 3859.9114 Å, with central velocity of 19.2 km s-1 and column density in the optically thin approximation of (Fe i). The line disappears in the second epoch, with a 3 upper limit to its column density of (Fe i). The epoch 3 data are too noisy to set firm limits on the Fe i. The Fe i line observed in epoch 1 is close in velocity to that observed in Ca i (4226 Å) which has = -18.6 km s-1. We would expect to see a stronger Fe i feature at 3719.93 Å due to its larger oscillator strength, however, no absorption is detected at this wavelength, casting doubt on the reliability of the line observed at 3859.91 Å. Using the Nai D1 line we have calculated an approximate column density for Na i of 10.9 dex and a Ca i abundance of dex, yielding a relatively high Ca i/Na i ratio. If the observed change in line strength of Fe i is real, then the disappearance of both Ca i and Fe i, combined with the high Ca i/Na i ratio, suggest that the variable component is an example of the ”CaFe” clouds noted by Bondar et al. (2007) and discussed by Gnaciński & Krogulec (2008) and Welty, Simon & Hobbs (2008). The enhanced Ca i and Fe i in these cases could be due to some combination of dielectronic recombination and milder than usual depletions at temperatures above 5000 K.
| Sightline | Species | Component | Column density | Column density | Column density | time | traversed |
|---|---|---|---|---|---|---|---|
| velocity | (1st epoch) | (2nd epoch) | variation (%) | (yr) | distance (au) | ||
| HD 112842 | Na i D | -40.8 0.20 | 11.45 0.01 | 11.36 0.02 | 19 | 5.2 | 47.8 15.2 |
| Ca ii K, H | -39.5 0.20 | 11.72 0.12 | 11.33 0.11 | 250 | 5.2 | 47.8 15.2 | |
| HD 113904 | Na i D | -60.5 0.09 | 11.52 0.01 | 11.56 0.01 | 10 | 6.7 | 90.9 28.4 |
| HD 163758 | Na i D | -25.9 0.05 | 11.87 0.02 | 11.90 0.01 | 7 | 6.7 | 160.3 58.9 |
| Na i D† | -26.0 0.07 | 11.90 0.01 | 11.99 0.01 | 32 | 5.4 | 130.2 47.8 | |
| Na i D | 18.3 1.00 | 12.08 2.00 ⋆ | 12.63 2.00⋆ | 355 | 6.7 | 160.3 58.9 | |
| HD 50896 | Na i D | 21.5 0.08 | 12.50 2.00⋆ | 12.87 2.00⋆ | 233 | 6.7 | 53.2 46.0 |
| HD 29138 | Ca i | -18.6 0.15 | 9.60 0.02 | 9.1 | 320 | 6.4 | 210.2 63.9 |
| Ca ii K, H | -18.7 0.11 | 11.53 0.05 | 11.40 0.01 | 35 | 6.4 | 210.2 63.9 |
† Variation seen between epoch 2 and 3.
* Upper limit to column density value.
Sightlines with particularly narrow -values, and therefore large errors
3.4 Sightlines showing no time-variations
The vast majority of the sightlines in our survey show little or no variation in line profile between the two epochs for the interstellar species isolated and examined. However at our spectral resolution (=80,000) there is always the possibility that there are blends in the absorption-lines of our observations.
We estimated upper limits to the changes, , in the column density of each interstellar component by using the the expression:
| (1) |
where is the error in the log of the column density of each component for epoch 1 from Papers I and V, S/Nepoch1 and S/Nepoch2 are the signal to noise ratios from epoch 1 and epoch 2, respectively. The column density change limit has only been derived for Ca ii K.
Typical errors in the column density for epoch 1 are from 0.02 to 0.06 dex, being on average twice as large for epoch 2. The resulting 3 upper limits to changes in Caii are thus typically 0.1 to 0.3 dex.
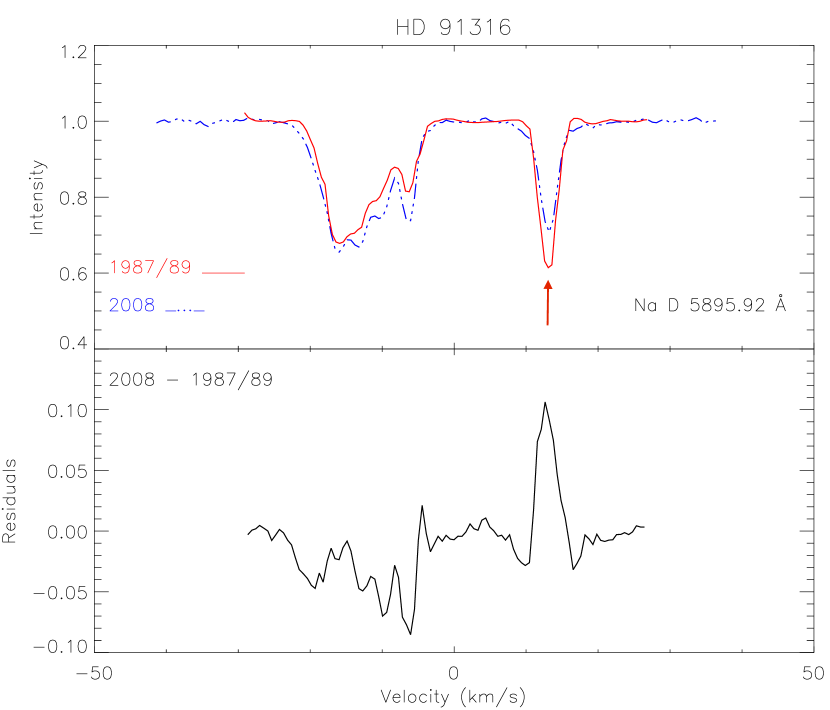
None of our McDonald sightlines show very clear variation. Two of this sample, namely HD 91316 and HD 149757, show some possible variation. However the difference in resolution between epochs cast doubt on the reliability of such variations. As this variation is not as convincing as that of the UVES sightlines, they are not included in our final results here, but some discussion of these sightlines is provided in Appendix A.
4 Discussion
In this section we discuss the main results of this survey and relate these to the idea of biased neutral formation in the ISM (Lauroesch & Meyer, 2003). Excluding the sightlines where we are likely seeing changes in absorption profiles due to circumstellar material or companions, some 1% of the sightlines in Ca i, 2% of those in Ca ii, K and H, and 4% in Na i D show evidence for time variation. None was detected in Ti ii, Fe i, CN, CH+ or K i (4044Å line only), most probably because the absorption features are too weak to see changes, due to depletion or smaller -values, or in the case of Ti ii due to a broader, smoother spatial distribution. The smallest scale structure over which a change in the ISM was tentatively observed was 50 au, even though some 64 % of the stars in our sample moved a smaller distance between the two epochs.
| Star | Ca i | Ca ii | ||||||
|---|---|---|---|---|---|---|---|---|
| v ( km s-1) | b ( km s-1) | ( cm-2) | v ( km s-1) | b ( km s-1) | ( cm-2) | ( cm-3) | ( cm-3) | |
| HD 163758 | - 26.7 0.4 * | 3.4 0.7 | 9.60 0.10 | -26.2 | 4.0 | 11.99 | 0.27 0.03 * | 1917 195 * |
| -4.3 0.1 | 2.0 0.2 | 10.13 0.02 | -3.3 | 4.3 | 12.48 | 0.29 0.01 | 2086 0.5 | |
| 4.8 0.2 | 4.6 0.4 | 10.13 0.02 | 5.3 | 4.8 | 12.59 | 0.23 0.01 | 1647 13 | |
| 24.3 0.2 | 2.9 0.4 | 9.78 0.03 | 25.4 | 4.3 | 11.91 | 0.49 0.03 | 3497 186 | |
| HD 29138 (1) | -18.7 0.1 * | 1.3 0.3 | 9.60 0.02 | -18.6 0.1 | 1.9 0.3 | 11.50 0.05 | 0.70 0.10 * | 4515 375 * |
| HD 29138 (2) | -18.7 0.1 * | 1.3 0.3 | 9.10 | -18.5 0.1 | 1.9 † | 11.40 0.01 | 0.3 * | - |
| HD 30677 | 12.1 0.2 | 0.9 0.0 | 9.93 0.08 | 11.8 0.7 | 4.0 0.3 | 11.70 0.02 | 1.12 0.17 | 8006 1186 |
| HD 33328 | -11.5 0.1 | 2.0 0.4 | 9.71 0.08 | -11.8 0.7 | 4.0 0.1 | 11.86 0.01 | 0.47 0.08 | 3337 584 |
| 0.8 0.5 | 2.7 2.7 | 9.25 0.30 | 0.0 0.4 | 2.2 0.1 | 11.38 0.01 | 0.49 0.46 | 3495 3319 | |
| HD 58343 | 1.2 0.4 | 2.6 0.7 | 9.69 0.06 | 1.6 0.4 | 2.5 0.2 | 11.84 0.02 | 0.47 0.05 | 3337 322 |
| HD 76341 | 5.8 0.1 | 3.1 3.1 | 9.77 0.08 | 6.3 0.8 | 4.8 0.1 | 12.12 0.02 | 0.29 0.04 | 2106 312 |
| HD 112272 | -17.7 0.4 | 3.5 0.7 | 9.88 0.08 | -16.9 0.1 | 3.5 0.1 | 12.16 0.02 | 0.35 0.05 | 2474 367 |
| HD 115842 | -14.8 0.5 | 0.4 0.4 | 9.7 0.08 | -14.9 0.2 | 3.3 0.3 | 12.24 0.02 | 0.19 0.03 | 1360 201 |
| HD 136239 | -52.6 0.2 | 2.3 2.3 | 9.93 0.08 | -52.3 0.9 | 5.5 0.5 | 12.60 0.03 | 0.14 0.02 | 1008 123 |
| HD 142758 | -43.8 0.1 | 1.1 0.0 | 9.86 0.08 | -44.2 0.1 | 5.0 0.1 | 12.22 0.02 | 0.29 0.04 | 2058 305 |
| -11.7 0.2 | 1.4 1.4 | 9.54 0.08 | -12.2 0.2 | 3.0 0.2 | 12.12 0.02 | 0.17 0.03 | 1240 184 | |
| 2.3 0.5 | 2.8 0.6 | 9.43 0.08 | 2.4 0.1 | 5.0 0.1 | 12.01 0.02 | 0.17 0.03 | 1240 184 | |
| HD 148937 | 3.0 0.2 | 1.7 0.3 | 9.67 0.08 | 2.9 0.5 | 3.1 0.2 | 12.26 0.02 | 0.17 0.03 | 1212 180 |
| HD 148379 | -18.1 0.5 | 5.8 1.2 | 10.35 0.08 | -18.5 1.4 | 8.0 0.3 | 12.50 0.02 | 0.47 0.07 | 3337 494 |
| -12.1 0.1 | 0.4 0.4 | 9.96 0.08 | -11.4 0.9 | 5.5 0.7 | 11.75 0.04 | 1.07 0.10 | 7646 738 | |
| HD 148688 | 2.8 2.0 | 3.1 0.6 | 9.98 0.08 | 3.7 0.9 | 5.2 0.2 | 12.59 0.01 | 0.16 0.03 | 1157 202 |
| HD 152003 | 2.3 0.2 | 4.5 0.9 | 10.26 0.08 | 2 0.2 | 3.0 0.7 | 12.17 0.04 | 0.81 0.08 | 5800 560 |
| HD 154811 | -19 0.4 | 0.8 0.8 | 9.21 0.30 | -19.4 0.1 | 3.4 0.5 | 10.89 0.04 | 1.38 1.13 | 9850 8074 |
| 6.7 0.2 | 3.1 0.6 | 9.96 0.08 | 6.5 0.6 | 3.6 0.1 | 12.16 0.02 | 0.42 0.06 | 2975 440 | |
| HD 154873 | -23.7 0.1 | 2.8 2.8 | 9.12 0.3 | -23.7 0.1 | 5.6 0.2 | 11.64 0.02 | 0.20 0.18 | 1424 1289 |
| -12.8 0.1 | 3.8 0.8 | 9.95 0.08 | -13 0.8 | 4.6 0.1 | 12.18 0.01 | 0.39 0.07 | 2776 486 | |
| 0.5 0.1 | 3.8 0.8 | 9.95 0.08 | 0.3 0.5 | 3.1 0.1 | 12.03 0.01 | 0.55 0.10 | 3921 686 | |
| 7.3 0.1 | 1.7 0.0 | 10.07 0.08 | 7.1 0.5 | 2.8 0.1 | 12.19 0.02 | 0.50 0.07 | 3576 530 | |
| HD 155806 | -36.5 0.4 | 2.0 2.0 | 9.47 0.30 | -37 0.1 | 4.9 0.5 | 11.47 0.04 | 0.66 0.54 | 4714 3864 |
| -2.4 0.5 | 1.8 1.8 | 9.47 0.30 | -2.2 0.4 | 2.2 0.8 | 11.52 0.06 | 0.59 0.43 | 4202 3100 | |
| HD 163800 | 1.2 0.0 | 6.5 6.5 | 9.48 0.30 | 0.6 0.4 | 5.0 0.1 | 11.55 0.02 | 0.56 0.51 | 4013 3633 |
| 7.0 0.0 | 2.1 0.4 | 10.39 0.08 | 6.3 0.5 | 2.8 0.5 | 12.44 0.02 | 0.59 0.09 | 4202 622 |
- b value fixed
* - Sightlines with varying components in either Ca or Na
For HD 29138, the (1) and (2) indicate the epoch in which these column densities were measure, ie, (1) was in 2002 and (2) in 2008. As none of the calcium lines varied in the other sightlines between epochs, these values apply for both 2002 and 2008 data.
Optical and H i observations of interstellar clouds imply gas densities several orders of magnitude higher than the background ISM (e.g. Diamond et al., 1989; Crawford, 2002; Smith et al., 2013), so they are not in pressure equilibrium with the surrounding gas. Such clouds would quickly evaporate, so must be continuously generated or confined by additional sources of pressure. Heiles (1997) invoked the idea of non-spherical geometry to solve this pressure problem. Cold and dense sheets or filaments aligned along the line of sight could explain the column density variations. Heiles also suggested that observations of high proper motion stars should show variation in almost all sightlines, which is not the case in this study. Also, evidence for the low temperatures ( K) required by the Heiles model have not been found in the cold ISM, although Jenkins & Tripp (2011) have detected a small but significant fraction of the diffuse ISM which is at high pressure.
Studies of trace and dominant ions in the UV have instead indicated that the variations may be due to local differences in ionization rather than density (Danks et al., 2001; Lauroesch & Meyer, 2003; Welty, 2007). However, this does not easily explain directly-observed variations in H i (Frail et al., 1994; Diamond et al., 1989; Brogan et al., 2005), nor the existence of au-scale structure in maps of dust emission (Miville-Deschênes et al., 2010). Some authors have proposed alternative models, in which the observed variations are due to statistical fluctuations caused by a power spectrum of cloud sizes (Deshpande, 2000, 2007).
To date, only about 25 examples of temporal variation are known (Lauroesch, 2007). Two notable searches for variation were those by Danks et al. (2001) who studied ten stars behind the Vela supernova remnant and detected four sightlines which varied, and Smoker et al. (2011) who found evidence of variation towards three out of 46 stars spread across the southern sky - similar to the numbers of varying sightlines found in this study.
4.1 Cloud electron densities and estimates of number densities and sizes
At the low densities in the ISM, ionization states are determined by the balance between photoionization and recombination. For neutral and first ionization states in equilibrium this can be expressed as;
| (2) |
where is the photoionization rate, is the radiative recombination rate coefficient, is the electron number density and is the number density of species (Welty, Hobbs & Morton, 2003).
Column densities of Ca i and Ca ii can be employed to estimate the electron density of the absorbing medium if it is in Ca ionization equilibrium and at a temperature of about 100 K. If we assume a constant density along the line of sight, may be replaced with , i.e. number density with column density, allowing us to rewrite equation (2) for the specific case of Ca i and Ca ii which becomes:
| (3) |
It is necessary to assume that the Ca i and Ca ii lines sample the same material. In the sightlines where the -value for Ca i is smaller than that of Ca ii, it is more likely that the former lies in denser regions, due to enhanced recombination. Hence, in the following discussion, it is important to bear in mind the caveat that Ca i and Ca ii may trace different regions (See Crawford, 2002, for further discussion).
Using the methods of Welty, Hobbs & Morton (2003) and Smith et al. (2013) we have estimated the electron density of components in those sightlines where we see variation, and also for a sample without (where Ca i and Ca ii were present). These values are listed in table 5. The sample was chosen using the criterion that both Ca ii and Ca i components found in Hunter et al. (2006) and Smoker & Ledoux (in preparation) had comparable velocities (within 1 km s-1of each other). As these values can only be calculated when Ca i is visible, Table 5 is therefore heavily biased towards the densest material, where Ca I is most abundant and thus easiest to detect.
Assuming that the electrons released through photoionization of atomic carbon dominate the electron density (Crawford, 2002), we can use this to estimate a lower limit to the total number density of the sightline. Adopting a carbon depletion of 60% implies a gas-phase carbon abundance of 1.4 10 (Sofia et al., 1997). Values of for each sightline where we have calculated are shown in Table 5. These density estimates (at least those with cm-3) are consistent with the filament structure predicted by Heiles (1997), as found in Crawford (2002). Typical values of are 10 - 100, 500, and 500-5000 cm-3 for the diffuse atomic, diffuse molecular and translucent ISM respectively (Snow & McCall, 2006). As can be seen from Table 5, all of our values lie in or beyond the upper range. Typical values stated in Welty (2007) of for the diffuse neutral gas are 0.05-0.20 cm-3, calculated from C i, Na i and/or K i. Again all but five of the densities found in Table 5 are larger than this ”normal” range. Although the values of and are high for the components in which we detect variations, it is interesting to note that they are in agreement with those for components that do not show variation.
It has generally been found that electron densities estimated from calcium tend to be higher than those derived from other species observed in the same sightline (e.g. Welty et al., 1999; Sonnentrucker et al., 2003). Welty, Hobbs & Morton (2003) have discussed this effect in detail. The cause of this effect is unknown (Welty, Hobbs & Morton, 2003), but it has only been reported towards a handful of stars. In the absence of other tracers we cannot exclude this possibility. It is also possible that the derived densities are underestimated due to the aforementioned caveat that Ca i and Ca ii may trace different regions. If Ca ii is mostly from an outer envelope, and Ca i from a more dense region as discussed in Crawford (2002), then the Ca i/Ca ii ratio (and hence the density) will be greater than the value listed in Table 5.
We were able to calculate densities for 32 velocity components towards 19 stars, of which two components were found to include time-variable species (Sect. 3). High number densities of cm-3 are derived for all of the components. It appears that at least some regions of the diffuse ISM are at densities which are much higher than the typical values of cm-3. If the assumptions leading to these values are correct, they lend credence to the high densities of cm-3 derived by Crawford (2002) and Smith et al (2013) for Vel. It is also consistent with the detection of a small but significant population of diffuse ISM components which are at much higher pressure than the surround medium (Jenkins & Tripp, 2011). Conversely, density estimates from C i by Jenkins & Tripp (2011) are usually significantly lower than those estimated from Cai/Caii (Welty et al. in preparation).
4.2 Biased Neutral formation in the ISM
As in previous ISM studies [see][for a review]citeplau07, changes in Na i are more often observed than in Ca ii. Lauroesch & Meyer (2003) estimate the minimum apparent length for the size of fluctuations observable in different species, being set by the distance an atom can travel before it is ionised, i.e. the velocity divided by the photoionization rate. Using reasonable values for the velocity (estimated from the -values) and photoionization rate, Lauroesch & Meyer (2003) estimated that Na i has an apparent scale of around 250 au, five times smaller than predicted for Ca ii, hence explaining why typically tiny-scale structure is more often seen in Na i. However, due to the higher photoionization rate of Ca i, this species should show larger time-variability than Na i. On the other hand, the relative weakness of the Ca i line means this is hard to test in practice, although we have attempted to see if such variation would be detected in the Ca i spectra where there is corresponding time-variability in Na i.
In the current sample there are five sightlines for which we have multi-epoch data for Ca i. Of these, one shows variability in both Ca i and Ca ii (HD 29138) and three either have no observed Ca i (HD 50896 and HD 112842), or have S/N insufficiently high to have detected the same percentage change in column density as seen in Na i (HD 113904). The remaining target where time variability is seen in Na i (HD 163758) shows no Ca i variation, and hence provides evidence against the biased neutral formation model. However, we caution that this star is WR, so there is always the possibility that we are observing changes in the circumstellar environment. Our results are therefore inconclusive in proving or disproving the biased neutral formation in the interstellar gas model of Lauroesch & Meyer (2003).
5 Summary
We have observed 104 early-type stars at twin epochs to search for time-variable structures in the ISM over periods of 5 to 20 yr. Our data set included 83 spectra with 80,000 from UVES and 21 spectra with 140,000 from the 2.7m telescope at McDonald Observatory. Excluding changes in absorption likely caused by eclipsing binaries or circumstellar discs, we find 5 cases within the UVES data of possible variation in the ISM. We have obtained follow-up third-epoch UVES and McDonald observations for the few objects which show possible change in their interstellar profiles. In only one case do we detect further variation. We expect this lack of variation, compared to Watson & Meyer (1996) who found differences in Na i towards the individual members of all 17 of the binary or multiple star systems they observed (with separations 480-29000 au), is due to the much smaller scales probed in our investigation, i.e. from 0 – 360 au. Hence, although fine-scale structure seems ubiquitous on scale 480 au it does not seem to be the case on scales 360 au. We were able to calculate approximate densities, derived from the ratio of Cai and Caii, in 32 velocity components towards 19 stars, of which two components were found to include time-variable species (section 3 and 4). Density estimates are consistent with the filament structure predicted by Heiles (1997), as more recently found in Crawford (2002). The majority of electron densities are higher than the typical values of 0.05 – 0.20 cm-3, derived from other trace-dominant ratios (Welty, 2007). The components in which we have found variation show no significant difference in density calculations to those where we found no variation. Future work will include FEROS and HARPS data taken from the ESO archive to study an even larger sample of objects and investigate tiny-scale structure in terms of the power spectrum of the ISM.
6 Acknowledgements
Based on observations made with ESO telescopes at the La Silla Paranal Observatory under programme IDs 266.D-5655(A), 081.C-0475(A) and 092.C-0173(A) and data taken at The McDonald Observatory of The University of Texas at Austin, for which we gratefully thank the support staff including David Doss. We thank Thomas Rivinius for advice on Be star spectra. This work was supported by the visiting research fund of Queen’s University Belfast and the ESO Director General’s Discretionary Fund. CMM is grateful to the Department of Education and Learning (DEL) in Northern Ireland and Queen’s University Belfast for the award of a research studentship. This research has made use of the SIMBAD database, operated at CDS, Strasbourg, France (Wenger et al., 2000). Thanks to an anonymous referee for useful comments on the initial version of the manuscript
References
- Aerts et al. (1999) Aerts C. et al., 1999, A&A, 343, 872
- Andrews, Meyer & Lauroesch (2001) Andrews S. M., Meyer D. M., Lauroesch J. T., 2001, ApJL, 552, L73
- Bagnulo et al. (2003) Bagnulo S., Jehin E., Ledoux C., Cabanac R., Melo C., Gilmozzi R., ESO Paranal Science Operations Team, 2003, The Messenger, 114, 10
- Ballester et al. (2000) Ballester P., Modigliani A., Boitquin O., Cristiani S., Hanuschik R., Kaufer A., Wolf S., 2000, The Messenger, 101, 31
- Barlow et al. (1995) Barlow M. J., Crawford I. A., Diego F., Dryburgh M., Fish A. C., Howarth I. D., Spyromilio J., Walker D. D., 1995, MNRAS, 272, 333
- Black & van Dishoeck (1988) Black J. H., van Dishoeck E. F., 1988, ApJ, 331, 986
- Blades et al. (1997) Blades J. C., Sahu M. S., He L., Crawford I. A., Barlow M. J., Diego F., 1997, ApJ, 478, 648
- Boissé et al. (2013) Boissé P., Federman S. R., Pineau des Forêts G., Ritchey A. M., 2013, A&A, 559, A131
- Bondar et al. (2007) Bondar A., Kozak M., Gnaciński P., Galazutdinov G. A., Beletsky Y., Krełowski J., 2007, MNRAS, 378, 893
- Brogan et al. (2005) Brogan C. L., Zauderer B. A., Lazio T. J., Goss W. M., DePree C. G., Faison M. D., 2005, AJ, 130, 698
- Burbidge (1952) Burbidge E. M., 1952, ApJ, 115, 418
- Catanzaro (2008) Catanzaro G., 2008, MNRAS, 385, L33
- Conti & Vacca (1990) Conti P. S., Vacca W. D., 1990, AJ, 100, 431
- Cordiner et al. (2013) Cordiner M. A., Fossey S. J., Smith A. M., Sarre P. J., 2013, ApJL, 764, L10
- Corti, Arnal & Orellana (2012) Corti M. A., Arnal E. M., Orellana R. B., 2012, A&A, 546, A62
- Crawford (2002) Crawford I. A., 2002, MNRAS, 334, L33
- Crawford (2003) Crawford I. A., 2003, Astrophysics and Space Science, 285, 661
- Crawford et al. (2000) Crawford I. A., Howarth I. D., Ryder S. D., Stathakis R. A., 2000, MNRAS, 319, L1
- Danks et al. (2001) Danks A. C., Walborn N. R., Vieira G., Landsman W. B., Gales J., García B., 2001, ApJL, 547, L155
- Dekker et al. (2000) Dekker H., D’Odorico S., Kaufer A., Delabre B., Kotzlowski H., 2000, in Society of Photo-Optical Instrumentation Engineers (SPIE) Conference Series, Vol. 4008, Optical and IR Telescope Instrumentation and Detectors, Iye M., Moorwood A. F., eds., pp. 534–545
- Deshpande (2000) Deshpande A. A., 2000, MNRAS, 317, 199
- Deshpande (2007) Deshpande A. A., 2007, in Astronomical Society of the Pacific Conference Series, Vol. 365, SINS - Small Ionized and Neutral Structures in the Diffuse Interstellar Medium, Haverkorn M., Goss W. M., eds., p. 105
- Diamond et al. (1989) Diamond P. J., Goss W. M., Romney J. D., Booth R. S., Kalberla P. M. W., Mebold U., 1989, ApJ, 347, 302
- Diplas & Savage (1994) Diplas A., Savage B. D., 1994, ApJS, 93, 211
- Faison et al. (1998) Faison M. D., Goss W. M., Diamond P. J., Taylor G. B., 1998, AJ, 116, 2916
- Frail et al. (1994) Frail D. A., Weisberg J. M., Cordes J. M., Mathers C., 1994, ApJ, 436, 144
- Galazutdinov et al. (2013) Galazutdinov G., Krełowski J., Beletsky Y., Valyavin G., 2013, PASP, 125, 1329
- Gnaciński & Krogulec (2008) Gnaciński P., Krogulec M., 2008, A&A, 477, 543
- Gredel, van Dishoeck & Black (1993) Gredel R., van Dishoeck E. F., Black J. H., 1993, A&A, 269, 477
- Heiles (1997) Heiles C., 1997, ApJ, 481, 193
- Henize (1952) Henize K. G., 1952, ApJ, 115, 133
- Henize (1976) Henize K. G., 1976, ApJS, 30, 491
- Hobbs et al. (1991) Hobbs L. M., Ferlet R., Welty D. E., Wallerstein G., 1991, ApJ, 378, 586
- Hoekzema, Lamers & van Genderen (1993) Hoekzema N. M., Lamers H. J. G. L. M., van Genderen A. M., 1993, A&AS, 98, 505
- Howarth et al. (2002) Howarth I. D., Price R. J., Crawford I. A., Hawkins I., 2002, MNRAS, 335, 267
- Hunter et al. (2006) Hunter I., Smoker J. V., Keenan F. P., Ledoux C., Jehin E., Cabanac R., Melo C., Bagnulo S., 2006, MNRAS, 367, 1478
- Jenkins & Tripp (2011) Jenkins E. B., Tripp T. M., 2011, ApJ, 734, 65
- Johnston et al. (2003) Johnston S., Koribalski B., Wilson W., Walker M., 2003, MNRAS, 341, 941
- Jones et al. (2013) Jones A., Noll S., Kausch W., Szyszka C., Kimeswenger S., 2013, A&A, 560, A91
- Kiefer et al. (2014) Kiefer F., Lecavelier des Etangs A., Augereau J.-C., Vidal-Madjar A., Lagrange A.-M., Beust H., 2014, A&A, 561, L10
- Kochukhov & Bagnulo (2006) Kochukhov O., Bagnulo S., 2006, A&A, 450, 763
- Lauroesch (2007) Lauroesch J. T., 2007, in Astronomical Society of the Pacific Conference Series, Vol. 365, SINS - Small Ionized and Neutral Structures in the Diffuse Interstellar Medium, Haverkorn M., Goss W. M., eds., p. 40
- Lauroesch & Meyer (2003) Lauroesch J. T., Meyer D. M., 2003, ApJL, 591, L123
- Lazio et al. (2009) Lazio T. J. W., Brogan C. L., Goss W. M., Stanimirović S., 2009, AJ, 137, 4526
- Le Bourlot, Gerin & Perault (1989) Le Bourlot J., Gerin M., Perault M., 1989, A&A, 219, 279
- Liszt & Lucas (2000) Liszt H., Lucas R., 2000, A&A, 355, 333
- Liszt, Pety & Tachihara (2009) Liszt H. S., Pety J., Tachihara K., 2009, A&A, 499, 503
- Marscher, Moore & Bania (1993) Marscher A. P., Moore E. M., Bania T. M., 1993, ApJL, 419, L101
- Mason et al. (2009) Mason B. D., Hartkopf W. I., Gies D. R., Henry T. J., Helsel J. W., 2009, AJ, 137, 3358
- Meyer (1990) Meyer D. M., 1990, ApJL, 364, L5
- Meyer et al. (2012) Meyer D. M., Lauroesch J. T., Peek J. E. G., Heiles C., 2012, ApJ, 752, 119
- Miville-Deschênes et al. (2010) Miville-Deschênes M.-A. et al., 2010, A&A, 518, L104
- Morton (2003) Morton D. C., 2003, ApJS, 149, 205
- Noll et al. (2012) Noll S., Kausch W., Barden M., Jones A. M., Szyszka C., Kimeswenger S., Vinther J., 2012, A&A, 543, A92
- Price, Crawford & Barlow (2000) Price R. J., Crawford I. A., Barlow M. J., 2000, MNRAS, 312, L43
- Rivinius et al. (2004) Rivinius T., Štefl S., Maintz M., Stahl O., Baade D., 2004, A&A, 427, 307
- Roy et al. (2012) Roy N., Minter A. H., Goss W. M., Brogan C. L., Lazio T. J. W., 2012, ApJ, 749, 144
- Sana et al. (2013) Sana H. et al., 2013, A&A, 550, A107
- Smith et al. (2013) Smith K. T., Fossey S. J., Cordiner M. A., Sarre P. J., Smith A. M., Bell T. A., Viti S., 2013, MNRAS, 429, 939
- Smoker et al. (2009) Smoker J. et al., 2009, The Messenger, 138, 8
- Smoker et al. (2011) Smoker J. V., Bagnulo S., Cabanac R., Keenan F. P., Fossati L., Ledoux C., Jehin E., Melo C., 2011, MNRAS, 414, 59
- Smoker et al. (2007) Smoker J. V. et al., 2007, MNRAS, 378, 947
- Snow & McCall (2006) Snow T. P., McCall B. J., 2006, ARA&A, 44, 367
- Sofia et al. (1997) Sofia U. J., Cardelli J. A., Guerin K. P., Meyer D. M., 1997, ApJL, 482, L105
- Sonnentrucker et al. (2003) Sonnentrucker P., Friedman S. D., Welty D. E., York D. G., Snow T. P., 2003, ApJ, 596, 350
- Stanimirović et al. (2010) Stanimirović S., Weisberg J. M., Pei Z., Tuttle K., Green J. T., 2010, ApJ, 720, 415
- Strömgren (1948) Strömgren B., 1948, ApJ, 108, 242
- Stupar, Parker & Filipović (2010) Stupar M., Parker Q. A., Filipović M. D., 2010, MNRAS, 401, 1760
- Sugawara, Tsuboi & Maeda (2008) Sugawara Y., Tsuboi Y., Maeda Y., 2008, A&A, 490, 259
- Tachihara et al. (2000) Tachihara K., Abe R., Onishi T., Mizuno A., Fukui Y., 2000, in ESA Special Publication, Vol. 445, Star Formation from the Small to the Large Scale, Favata F., Kaas A., Wilson A., eds., p. 523
- Tachihara et al. (2012) Tachihara K., Saigo K., Higuchi A. E., Inoue T., Inutsuka S.-i., Hackstein M., Haas M., Mugrauer M., 2012, ApJ, 754, 95
- Tetzlaff, Neuhäuser & Hohle (2011) Tetzlaff N., Neuhäuser R., Hohle M. M., 2011, MNRAS, 410, 190
- Tull et al. (1995) Tull R. G., MacQueen P. J., Sneden C., Lambert D. L., 1995, PASP, 107, 251
- Štefl et al. (2012) Štefl S., Le Bouquin J.-B., Carciofi A. C., Rivinius T., Baade D., Rantakyrö F., 2012, A&A, 540, A76
- van Leeuwen (2007) van Leeuwen F., 2007, A&A, 474, 653
- van Loon et al. (2009) van Loon J. T., Smith K. T., McDonald I., Sarre P. J., Fossey S. J., Sharp R. G., 2009, MNRAS, 399, 195
- Watson & Meyer (1996) Watson J. K., Meyer D. M., 1996, ApJL, 473, L127
- Welsh et al. (1997) Welsh B. Y., Sasseen T., Craig N., Jelinsky S., Albert C. E., 1997, ApJS, 112, 507
- Welty (2007) Welty D. E., 2007, ApJ, 668, 1012
- Welty, Hobbs & Kulkarni (1994) Welty D. E., Hobbs L. M., Kulkarni V. P., 1994, ApJ, 436, 152
- Welty et al. (1999) Welty D. E., Hobbs L. M., Lauroesch J. T., Morton D. C., Spitzer L., York D. G., 1999, ApJS, 124, 465
- Welty, Hobbs & Morton (2003) Welty D. E., Hobbs L. M., Morton D. C., 2003, ApJS, 147, 61
- Welty, Morton & Hobbs (1996) Welty D. E., Morton D. C., Hobbs L. M., 1996, ApJS, 106, 533
- Welty, Simon & Hobbs (2008) Welty D. E., Simon T., Hobbs L. M., 2008, MNRAS, 388, 323
- Wenger et al. (2000) Wenger M. et al., 2000, A&AS, 143, 9
Appendix A Possible Variation in two McDonald stars
A.1 HD 149757 Na i D variations
HD 149757 ( Oph) is a runaway O9V B(e) star at a distance of 200 pc. The interstellar absorption-lines towards this star are very well studied, and the sightline often serves as an exemplar for modelling the ISM. Any variations in interstellar absorption towards this star are therefore potentially very important. Its displacement between the two epochs is 115.5 au.
The Na i D absorption component at km s-1 shows a possible change between the two epochs separated by 20 yr in D1. This variation is exaggerated when the McDonald data are compared with the models. However, when the original data (only available for Na D 5895.92 Å, see Fig. 12 ) were smoothed to allow the resolution to match that of the epoch 2 McDonald observations, the variation was less obvious. This implies a significant amount of the variation detected was due to the difference in resolution. Nonetheless this variation is still seen (however weak) in the comparison with the epoch 1 data. This sightline has been studied in detail by Barlow et al. (1995) and so we have also produced a fit using the velocity and column density values taken from Barlow et al. (1995), but with the instrumental -value from the McDonald observations replacing those of UHRF. The resulting fit also indicates that the component at km s-1shows some possible variation.
To investigate this variation further, we searched the ESO archives and found four observations with HARPS of Na i D towards this star, taken between 2006 and 2014. No further variations were detected, but from 2006 onwards the km s-1 absorption is saturated and so continued increases in column density might not be visible. Future investigation of this component will need to examine the weaker near-UV lines of Na i at 3302 Å, which are not included in the McDonald data.
HD 149757 lies close on the sky to the LDN 204 filamentary cloud complex and ionizes the H ii region Sh 2-27. Radio observations of 12CO (Le Bourlot, Gerin & Perault, 1989; Tachihara et al., 2000; Liszt, Pety & Tachihara, 2009) indicate that the cloud is accelerated by the radiation from Oph, causing compression of the molecular cloud and dense cores. This is supported by the CO observations of Tachihara et al. (2012), who find several cloudlets of scales 1000 to 10,000 au which they suggest are cold, dense and overlapping. These structures could explain the apparent small-scale variations.
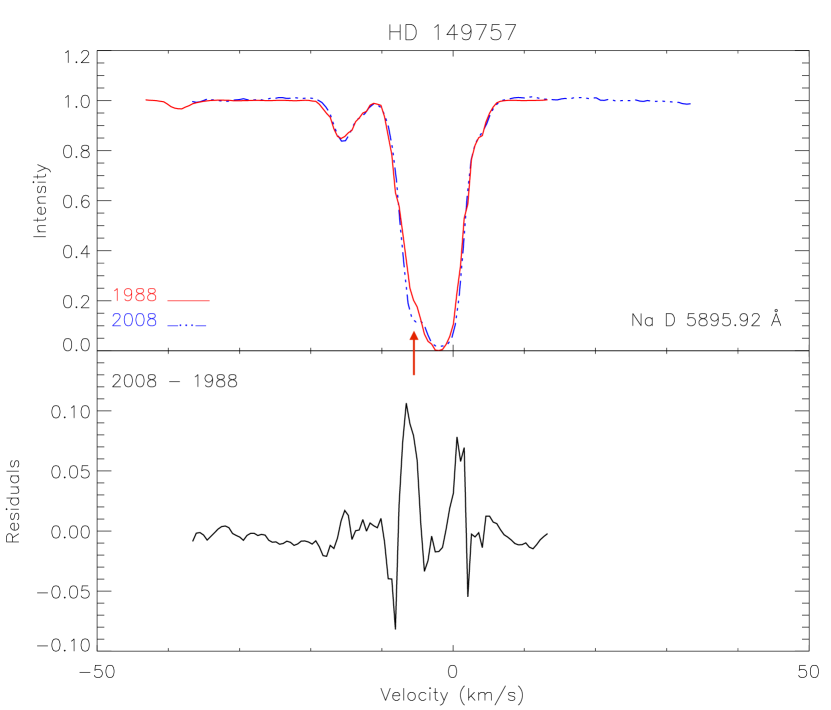
A.2 HD 91316 Na i D variations
HD 91316 ( Leo) is a well-studied pulsating variable star at a distance of 1350 pc, and is a frequent target for interstellar absorption-line studies. Lauroesch & Meyer (2003) previously discovered variations in the Na i D absorption-lines between 1995 and 2003 due to stellar motion of au. Their epochs overlap those probed by our McDonald spectra, but used a different instrument. They found that the column density of Na i at km s-1 (Heliocentric velocity) decreased by in 8 yr, but saw no change in Ca ii. We confirm the variations in Na i found by Lauroesch & Meyer, with the same component showing a similar variation. This is evident from (Fig. 13) but, as was shown for HD 149757, the difference in resolution between the spectra has caused some problems in the analysis of this sightline. Due to the limited spectral range available in the WHK spectra there is not much continuum visible on either side of the interstellar features and so normalisation would be difficult in this case. As noted by Lauroesch & Meyer (2003), the continuum may have been fitted slightly too low, near the varying component at 23 km s-1, however adjusting for this would only yield even larger differences and so cannot be an explanation for this variation. The McDonald data are plotted in the figure along with the WHK spectrum, degraded in resolution to allow for a more accurate comparison. This variation is apparent in the residual plot and so this may be showing quite strong variation in the ISM over 20 yr. However, all components of this line vary between epochs. The most redward component varies in the opposite direction to the others (believed to be affected by differences in resolution ) which helps to confirm the variation, but makes quantifying it difficult. This variation is over a scale up to 184 au, the transverse distance moved by the background star. 555We are unable to reconcile the proper motion measured by van Leeuwen (2007) with the transverse distance of 12 au in 8 yr reported by Lauroesch & Meyer.