Noncontact dissipation reveals critical central peak in SrTiO3
Abstract
The critical fluctuations at second order structural transitions in a bulk crystal may affect the dissipation of mechanical probes even if completely external to the crystal surface. Here we show that noncontact force microscope dissipation bears clear evidence of the antiferrodistortive phase transition of SrTiO3, known for a long time to exhibit a unique, extremely narrow neutron scattering “central peak”. The noncontact geometry suggests a central peak linear response coupling connected with strain. The detailed temperature dependence reveals for the first time the intrinsic central peak width of order 80 kHz, two orders of magnitude below the established neutron upper bound.
Second order structural phase transitions leave a clear mark in all thermodynamical, mechanical, equilibrium and non-equilibrium properties of bulk crystals. It was proposed some time ago that the critical fluctuations should also leave a footprint in the frictional dissipation of external mechanical probes such as an atomic force microscope (AFM) when temperature crosses the phase transition in the underlying bulk Benassi11 . The recent successful detection of a superconducting transition in the linear response mechanical dissipation of a noncontact, pendulum-type AFM tip hovering more than one nm above the sample surface Kisiel2011 suggests that continuous structural transitions might also be detectable in this manner. Here we present a first realization of this idea, with direct application to a most classic example, the antiferrodistortive transition of SrTiO3 just above 100 K. At this phase transition the high temperature ideal cubic perovskite crystal structure becomes unstable against a zone-boundary phonon-like displacement of the ions, leading to a cell doubling and a tetragonal I4/mcm symmetry at lower temperatures. This exquisitely second order “displacive” transition historically provided a clean realization of nonclassical critical exponents Muller71 . A very intriguing feature of this system, originally uncovered by neutron scattering, and later confirmed by other techniques, is the so-called “central peak” Riste71 ; Shapiro72 ; Reiter80 ; Shirane93 . Very close to the critical transition temperature , inelastic neutron spectra showed, besides ordinary critical fluctuations – which proliferate and soften but never reach zero frequencies – a strikingly narrow peak (less than the 6 MHz width resolution) centered at zero frequency, whence the name. The central peak (CP) intensity appeared to obey the static critical exponents of the transition, but despite considerable efforts the actual nature and width of the central peak were not uncontroversially established Cowley96 .
Here we show that noncontact pendulum AFM dissipation, measured far from actual contact with the surface, reveals for the first time a structural phase transition, and it does so by revealing the CP of SrTiO3. A linear response analysis shows that the CP-related mechanical loss peak is as narrow as 80 kHz, a frequency orders of magnitude below the neutron established upper bound. Moreover, even if it cannot strictly determine the intimate nature of the CP, the mechanical coupling suggests a connection with critical fluctuations of strain, which are known to be associated with those of the main antiferrodistortive order parameter Hochli80 .
The probe consisted of a very soft, highly doped silicon cantilever (ATEC-Cont from Nanosensors) with spring constant N/m, suspended perpendicularly to the surface with an accuracy of 1∘ and operated in the so-called pendulum geometry where the tip vibration describes an arc parallel to the sample surface. The peculiarity of this technique is to detect phenomena, in this case phase transitions, which happen in bulk, by means of a non-invasive, ultra sensitive and local surface probe, as opposed to traditional probes such as neutrons and X-rays which invade the bulk in a much more global fashion. Moreover, the pendulum AFM is a kilohertz probe, sensitive to phenomena and to fluctuations that may take place on a much slower time scale than that accessible with neutrons or X-rays. The oscillation amplitude of the tip was kept constant to approximately 5 nm using a phase-locked loop feedback circuit. The cantilever was annealed in UHV up to 700∘C for 12 h, which results in removal of water layers and other contaminants from both the cantilever and the tip. After annealing the cantilever quality factor, frequency and internal damping were equal to , kHz and kg/s, respectively. The annealing is also known to reduce all localized charges on the probing silicon tip (Kisiel2011, ), which is neutral, since the tip-sample contact potential difference was compensated (V=VCPD) during the experiment.
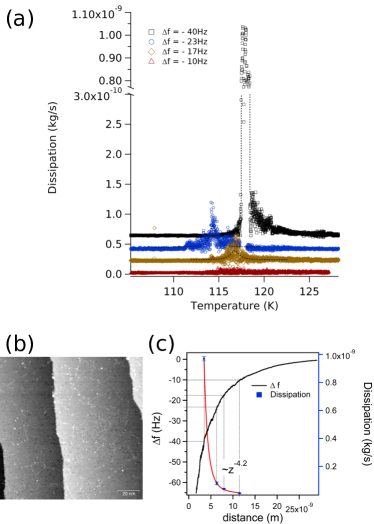
Fig. 1 (a) shows the power dissipated by the pendulum AFM as a function of temperature at different spots on the SrTiO3 surface and at different tip-sample distances, as measured by the shift of the resonance frequency . The dissipation is inferred from the standard expression gotsman99 in terms of the measured distance-dependent excitation amplitude and resonance frequency (where ) of the cantilever, the suffix referring to the free cantilever. Since the Young modulus of the silicon cantilever is temperature dependent also the frequency of the free cantilever changes as a function of temperature - gysin04 . In a temperature dependent experiment the total change of the frequency is where is the (negative) frequency shift due to the tip-sample interaction. The tip-sample distance was accurately controlled by means of feedback loop regulating the position in such a way that was kept constant. (see Supplementary Material).
Data at the large distance nm, corresponding to Hz, show a dissipation peak which is barely visible, corresponding to an exceedingly weak van der Waals tip-surface interaction. All other spectra, taken at closer distances, exhibit a narrow dissipation peak at a temperature between 114 and 118 K depending upon the surface spot investigated, reflecting local changes of determined by inhomogeneous heavy Nb doping, surface oxygen vacancies, and/or stress irregularities. The 105K transition temperature of stress free pristine SrTiO3 is notoriously shifted by Nb doping and formation of oxygen vacancies Ozaki2014 . At surfaces, moreover, may under suitable conditions show differences of tens of degrees with respect to the bulk, as seen on SrTiO3(110) Mishina2000 . The dissipation peak in this raw data provides a first qualitative confirmation of the suggested connection between critical structural fluctuations and AFM dissipation Benassi11 .
Fig 1 (b) shows a scanning tunneling microscope (STM) atomically resolved surface topography of the 1% Nb doped SrTiO3(001) surface taken at low temperature K. The flat terraces are obtained after a 2h annealing to C under ultra high vacuum (UHV) castell02 ; Silly2006 .Detailed STM images (see also Supplementary Material) show dark spots (surface defects, perhaps O vacancies Silly2006 ) and bright features, decorating what could be edge dislocations Tanaka93 or other domain walls.
We now consider the origin of the pendulum AFM loss process. For a start, the tip is sufficiently far from the surface to guarantee that only van der Waals (vdW) (or electrostatic if charges were present) tip-substrate interactions are relevant. Pure SrTiO3 is an insulator and the coupling of a neutral tip must be phononic Volokitin06 . Resistivity measurements of 1%-Nb doped crystals exhibit conducting behaviour, however with a carrier density of about Spinelli2010 , orders of magnitude below that of a good metal.
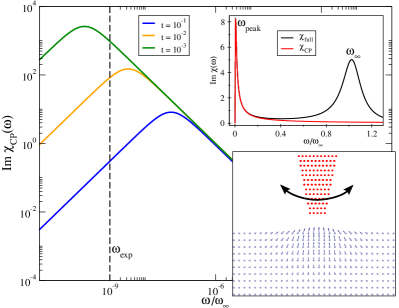
Moreover, Auger electron spectroscopy on SrTiO3-(2x2) surface has suggested that the Nb presence is negligible in the near-surface region Lin2011 , so that the low level metallicity due to Nb doping can be considered irrelevant in our experiment. Fig. 1 (c) shows the maximum dissipation value against tip-sample separation. For a spherical tip oscillating above a solid surface the dissipation is proportional to , where is the static force resulting from tip-sample interaction. The vdW interaction yields a static force , so that the dissipation due to creation of phonons in the solid (acoustic phonons in this case, corresponding to the oscillating strain wave under the tip sketched in the inset in Fig. 2) should vary as Volokitin06 ; Kisiel2011 . The experimental distance dependence, is indeed best fit by with is in excellent agreement with that expectation.
We can now directly relate the observed dissipation to the the critical central peak of SrTiO3. The noncontact tip vibrating at kHz and at large distance is a very weak perturbation on the underlying SrTiO3. Thus, we can make use, rarely appropriate in nanofriction, of linear response theory. Moreover since the AFM perturbation affects a sufficiently large portion of SrTiO3, we can approximate its response by means of the bulk response of the material Shapiro72 ; Volokitin06 . The dissipated tip energy per cycle is, in linear response, proportional to the imaginary part of the bulk lattice susceptibility , in the form
| (1) |
where is the dissipation of the free cantilever (-independent in the considered temperature range), is an appropriate momentum average of the lattice susceptibility , is a positive, distance-dependent constant and the temperature factor originates from the term , with the Bose function, in the experimentally relevant regime . Using the form by Shapiro et al. Shapiro72 which accurately describes neutron scattering, the order parameter (zone boundary) susceptibility can be written as , where is a bare soft phonon frequency far from the transition and is a self energy renormalization from anharmonic effects (we shall from now on drop the wave-vector dependence of these quantities). This simple form of would lead, in the standard textbook description of a displacive transition Kittel:book to a -dependent shift of , resulting in a lorentzian peak in at , of width , such that at . However, the neutron data of SrTiO3 showed that phonon softening is incomplete, meV, but accompanied by an extra feature centered at some very-low-energy , the central peak, phenomenologically captured Shapiro72 by an additional contribution to the self-energy
| (2) |
For one recovers the usual soft-phonon lorentzian peak at , but for a second peak appears, well approximated by (see upper inset of Fig. 2)
| (3) |
where is the quantity that actually vanishes as . Indeed, the static susceptibility can be shown to be simply related to
| (4) |
The divergence of the order-parameter susceptibility with an exponent , as the reduced temperature goes to is a standard result of the theory of critical phenomena. The critical behavior of SrTiO3 is in the 3D-Ising universality class, for which Topler77 . The low-energy susceptibility of Eq. (3) displays a sharp peak at a frequency , which moves towards as . We can now consider the temperature dependence of the linear response AFM dissipation at the fixed and very low oscillation frequency . As from above the dissipation will increase, roughly as , because , to reach saturation value at such that . Essentially (here about 1 K above Tc) is the temperature below which CP fluctuations average out. Correspondingly, below the dissipation levels off as we can essentially take , which depends very mildly on . (experimental values for and given by Shapiro72 ). We finally obtain an overall predicted critical form for the AFM dissipation:
| (5) |
where and are positive constants. (In the notation of Ref. Shapiro72 , and at low the relevant dependence on temperature is given by the term. )
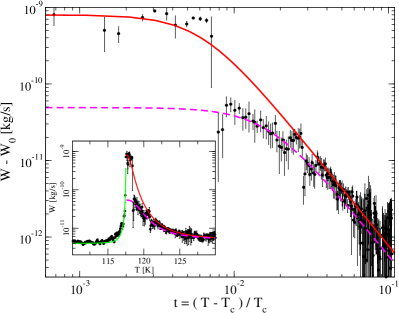
Fig. 3 shows on a log-log scale the data for at Hz ( nm) for K. Considering the experimental uncertainty mainly due to noise in the dissipation signal, a slope provides a good fit well above Tc, followed by a saturation when . Taking from Ref Shapiro72 meV2 and meV2, we finally observe that this saturation of AFM dissipation determines the low-energy width parameter as kHz.
We draw in summary four conclusions. First, bulk structural phase transitions are indeed revealed by AFM dissipation, as was predicted. Benassi11 Strikingly, in the present noncontact realization, this is realized without literally touching the crystal. Second, the pendulum AFM dissipation picks up precisely the long debated central peak fluctuations, here responsible for the dissipation at the extremely low AFM pendulum frequency of 11 kHz. Third, the unknown breadth of the central peak in the dynamical structure factor now obtained as an intrinsic property of SrTiO3 is about 80 kHz, well below the upper bound set by the neutron resolution limit of MHz. This CP width is manifested in AFM dissipation as a peak at MHz. Fourth, the noncontact, large distance tip-surface coupling elicits a phononic dissipation attributable in turn to a slowly varying tip-induced strain, and not to the primary antiferrodistortive order parameter, to which the far away tip and its motion cannot directly couple. While this realization does not reveal by itself the intimate nature of the CP, which remains open to discussion Cowley96 it does show that the exceedingly slow critical CP fluctuations must involve a large component of strain, which is the secondary and not the primary order parameter of the structural transition.
The Basel group acknowledge financial support from the Swiss National Science Foundation (NSF), the SINERGIA Project CRSII2 136287/1 and the Swiss National Center of Competence in Research on “Nanoscale Science” (NCCR-NANO). The SISSA group acknowledges research support by MIUR, through PRIN-2010LLKJBX_001, by SNSF, through SINERGIA Project CRSII2 136287/1, and the ERC Advanced Research Grant N. 320796 MODPHYSFRICT.
References
- (1) A. Benassi, A. Vanossi, G.E. Santoro, and E. Tosatti, Phys. Rev. Lett. 106, 256102 (2011).
- (2) M. Kisiel, E. Gnecco, U. Gysin, L. Marot, S. Rast, E. Meyer, Nature Materials10, 119 (2011).
- (3) K.A. Müller and W. Berlinger, Phys. Rev. Lett. 26, 13 (1971).
- (4) T. Riste, E.J. Samuelsen, K. Otnes, and J. Feder, Solid State Commun. 9, 1455 (1971).
- (5) S.M. Shapiro, J.D. Axe, G. Shirane, and T. Riste, Phys. Rev. B 6, 4332 (1972).
- (6) G.F. Reiter, W. Berlinger, K.A. Muller, P. Heller, Phys. Rev. B21, 1 (1980).
- (7) G. Shirane, R. A. Cowley, M. Matsuda, and S. M. Shapiro, Phys. Rev. B 48, 15595 (1993).
- (8) R.A. Cowley, Phil. Trans. R. Soc. Lond. A 354, 2799 (1996).
- (9) U. T. Hochli and A. D. Bruce, Phys. C: Solid St. Phys. 13, 1963 (1980).
- (10) B. Gotsmann,C. Seidel,B. Anczykowski, H. Fuchs, Phys. Rev. B 60, 11051 (1999).
- (11) U. Gysin, S. Rast, P. Ruff, E. Meyer, D. W. Lee, P. Vettiger, C. Gerber, Phys. Rev. B 69, 045403 (2004).
- (12) T. Ozaki, T. Muranaka, N. Takata, H. Yamaguchi, K. Kajiwara, Y. Chikaura, Ferroelectrics462:1, 14-18 (2014).
- (13) E. D. Mishina, T. V. Misuryaev, N. E. Sherstyuk, V. V. Lemanov, A. I. Morozov, A. S. Sigov, and Th. Rasing, Phys. Rev. Lett.85, 3664-7 (2000).
- (14) M. R. Castell, Surf. Sci. 505, 1-13 (2002).
- (15) F. Silly, D. T. Newell, M. R. Castell, Surface Sci. Lett600, L219-L223 (2006).
- (16) H. Tanaka, T. Matsumoto, T. Kawai, S. Kawai, Jpn. J. Apl. Phys.32, 1405 (1993).
- (17) A.I. Volokitin, B.N.J. Persson, and H. Ueba, Phys. Rev. B 73, 165423 (2006).
- (18) A. Spinelli, M. A. Torija, C. Liu, C. Jan, C. Leighton, Phys. Rev. B81, 155110 2010.
- (19) Y. Lin, A. E. Becerra-Toledo, F. Silly, K. R. Poeppelmeier, M. R. Castell, L. D. Marks, Surface Sci.605, L51–L55 (2011).
- (20) C. Kittel, Introduction to Solid State Physics, J. Wiley & Sons, New York.
- (21) J. Topler, B. Alefeld, and A. Heidemann, J. Phys. C: Solid State Phys. 10, 635 (1977).