State estimation for temporal point processes
M. N. M. van Lieshout
CWI
P.O. Box 94079, NL-1090 GB Amsterdam, The Netherlands
Department of Applied Mathematics,
University of Twente
P.O. Box 217, NL-7500 AE Enschede, The Netherlands
This paper is concerned with combined inference for point processes on the real line observed in a broken interval. For such processes, the classic history-based approach cannot be used. Instead, we adapt tools from sequential spatial point processes. For a range of models, the marginal and conditional distributions are derived. We discuss likelihood based inference as well as parameter estimation using the method of moments, conduct a simulation study for the important special case of renewal processes and analyse a data set collected by Diggle and Hawtin.
AMS Mathematics Subject Classification (2010): 60G55; 60K15; 62M99.
Key words & Phrases: Cox process, Markov chain Monte Carlo, Markov point process, renewal process, sequential point process, state estimation.
1 Introduction
Inference for point processes on the real line has been dominated by a dynamic approach based on the stochastic intensity [4, 16, 17] which expresses the likelihood of a point at any given time conditional on the history of the process. Such an approach is quite natural in that it is the mathematical translation of the intuitive idea that more and more information becomes available as time passes. Furthermore, the approach allows the utilisation of powerful tools from martingale theory. In a statistical sense, since the stochastic intensity is closely related to the hazard rates of the distribution of the length of the inter-point intervals, a likelihood is immediately available [8].
The dynamic approach, however, does not seem capable of dealing with situations in which the flow of time is interrupted. In such cases, combined state estimation techniques are needed that are able to simultaneously carry out inference and to reconstruct the missing points. More specifically, state estimation aims to find ‘the optimal reconstruction, realization by realization, of unobserved portions of a point process or of associated random variables or processes’ [16, p. 93]. Other examples include extrapolation and prediction [24], filtering [28], cluster detection [19] or the estimation of the driving measure of a Cox process [23].
The aim of this paper is to apply ideas from sequential point process [20, 21], in particular the sequential Papangelou conditional intensity which describes the probability of finding a point at a particular time conditional on the remainder of the process. Thus, the concept is related to the stochastic intensity, except that the future is taken into account as well as the past. It is this last feature that allows the incorporation of missing data. Moreover, for hereditary point processes at least, they define a likelihood.
The plan of this paper is as follows. In Section 2, we represent a point processes on the real line as a sequential point process on semi-cubes and recall the definition of the sequential Papangelou conditional intensity. Section 3 derives the marginal and conditional distributions for the situation where the point process is observed in disjoint intervals only. Important special cases are studied in detail: Markov point processes in Section 4.1, renewal processes in Section 4.2 and Cox processes in Section 5. In Section 6.1, we show that a substantial bias may be incurred when missing data is not accounted for properly. We present a Metropolis–Hastings algorithm for sampling from the conditional distribution of the missing data as well as a locally defined birth-and-death process based on the sequential Papangelou conditional intensity in Section 6.2 and the Appendix. These techniques are then used in Monte Carlo inference. Finally, in Section 7, a health care surveillance data set collected by Diggle and Hawtin is analysed to illustrate the approach and we conclude with a summary.
2 Finite point process on the line
In this section, we review basic concepts from the theory of chronologically ordered, simple point processes on an interval , .
Realisations of a simple point process consist of a finite number of distinct points for . Since the points are naturally ordered, there is a unique correspondence between the set and the vector where [8, 17]. The special case corresponds to an empty realisation. Equipping , , with the product Borel -algebra, the distribution of a finite sequential point process can be specified by [20].
-
•
a probability mass function , , for the number of points in ;
-
•
for each for which , a probability density function on for the chronologically ordered vector of point locations given that there are of them.
Note that the need not be symmetric.
The likelihood of finding points, one at each of the locations in that order, is expressed by the Janossy densities [8]
on . For , . More compactly, one may specify a density on (equipped with the -algebra generated by the Borel product -fields) with respect to the probability measure
which is related to the unnormalised Janossy densities as and . Note that is the distribution of a unit rate Poisson process on .
The sequential Papangelou conditional intensity [21] for inserting at position is defined by
| (1) |
whenever both and ; it is set to zero otherwise. Reversely, provided is hereditary in the sense that implies that for all subsequenses of , the density factorises as
| (2) |
At this point, it is important to note that the term Papangelou conditional intensity is often abbreviated to plain ‘conditional intensity’. We choose not to do so to avoid confusion with another factorisation often referred to by this name. Indeed, by [8, Prop. 7.2.III], the probability density function of can be factorised as
where is a combination of the hazard functions of the conditional probability density functions that govern the location of the -th point conditional on the ‘past’ points . We shall refer to as the ‘hazard rate’. Note that one sometimes writes to stress the dependence on the history of up to but not including . The two concepts are related, but not identical in general. For a rigorous treatment, the reader is referred to [16, 17].
3 Partially observed point processes
Consider a sequential point process that is observed in a broken interval . In other words, any point falling in is not observed. Thus, a realisation consists of two chronologically ordered sequences, say , , in and , , in .
In order to carry out likelihood based inference or state estimation, we need, respectively, the marginal distribution of the observations and the conditional law of the missing points.
Proposition 1
Let be a simple sequential point process on , , defined by , as in Section 2.
- (a)
-
The marginal distribution of the sequential point process defined as the restriction of to has Janossy density
(3) where denotes vector length (with the convention that the integral for is equal to ). In other words, has density with respect to .
- (b)
-
If and are feasible in the sense that their marginal Janossy density (3) is strictly positive, then the conditional distribution of on given and has Janossy density
(4) for , . Equivalently, a conditional density with respect to is
Proof: Split in three parts: , and . Then,
Write . Then, the -algebra on the disjoint union set can be described as follows. A subset is measurable exactly if is a Borel set for all adding up to [12]. Clearly this holds for all Borel sets in and, reversely, any measurable in the union -algebra is the disjoint union of Borel sets, hence a Borel set itself. Consequently, can also be split into three well-defined, though possibly dependent, sequential point processes by restriction to , and .
For , write for the event that points fall in , points in and further points in . Then
when and otherwise.
- (a)
-
For , the marginal probability of placing points in is the probability of the disjoint union , that is,
Similarly, suppose that and condition on having points in . Then, for any measurable ,
Since can be written as
a particular configuration consisting of and with has (conditional) probability density
with respect to Lebesgue measure on .
- (b)
-
Next, condition on and . To compute the probability of having , , points in between and , we may restrict ourselves to . If , this probability is zero. Thus, assume and, a fortiori, . On , the (joint) likelihood of the points is , hence integration over yields that the marginal density of with respect to Lebesgue measure on is given by
We conclude that the conditional probability of finding points in given and elsewhere is
The denominator is strictly positive by assumption. Moreover, a conditional density function for the locations of points in given there are such points and given realisations and elsewhere exists and reads
provided the denominator is strictly positive, which is always the case if .
For hereditary sequential point processes, we have the following simplification of Proposition 1(b).
Proposition 2
Let be a simple hereditary sequential point process with density with respect to . Let and be feasible in the sense that Then the conditional distribution of on , , given and is hereditary with Papangelou conditional intensity
| (5) |
equal to the Papangelou conditional intensity of for all and provided .
Proof: By the proof of Proposition 1 part (b),
Therefore would imply that and hence would be zero. Since is hereditary, would be zero for all and all . Consequently, would be zero, a contradiction with the assumption. We conclude that .
For , consider the chronologically ordered vector with components in and assume that . By (4) and the assumption that , . Since is hereditary, all subsequences also have strictly positive Janossy density, in particular those including both and . Another appeal to (4) implies that the conditional point process is hereditary too.
By the general theory outlined in Section 2, the density factorises as
in terms of the Papangelou conditional intensity
for and zero otherwise.
The last equality follows from Proposition 1 part (b)
and implies (5).
The Papangelou conditional intensity, in contrast to the hazard rate which is a function of the history of the process, is able to take into account past as well as future points. Indeed, there does not seem to be an analogue of (5) in terms of .
The theorems above cannot be simplified without specific model assumptions. In the next sections we therefore specialise to, respectively, Markov point processes, nearest–neighbour processes and Cox models.
4 Markov point process
In this section, we consider models in which the dependence of a sequential point process in on its future and past is limited either to a border region for some fixed interaction range (Section 4.1) or by its two nearest neighbours, say in and (Section 4.2).
4.1 Fixed range dependence
A chronologically ordered sequential point process on is said to be Markov at range if it is hereditary and and, for all for which and for all , , the Papangelou conditional intensity depends only on and the set of points that have temporal distance . In other words, the underlying unordered point process is Markov in the classical sense [26]. Therefore, by the Hammersley–Clifford theorem, the density of factorises as
for some non-negative integrable interaction function , ranging over the collection of unordered finite subsets of , that vanishes except on cliques. More precisely, unless it consists of pairwise -close points. To get rid of the indicator function, define for so that
cf. [20]. As usual, for , is interpreted as the empty sequence.
Next, turn to (5) and observe that it reduces to
the product of all interaction functions that involve the point . We conclude that the Markov property is preserved under conditioning but the clique interaction functions
for and may change and depend on points of and in . In particular, since need not be constant in even when is, non-homogeneity may be introduced by the conditioning.
The special case of pairwise interaction processes of the form
| (6) |
with is of special interest. For such models, the conditional distribution of on , , given on and on has first and second order interaction functions
Therefore the conditional point process is also Markov at range with pairwise interactions only. The second order interaction function is unaffected by the conditioning. The first-order interaction function depends on points of and up to a range from .
4.2 Nearest neighbour dependence
A renewal process on is defined as follows [16, Chapter 8]. Starting at time , let be a sequence of independent and identically distributed inter-arrival times with common probability distribution function . We assume that is non-defective and absolutely continuous with density . Its hazard function is denoted by . Set and for . Then those , falling in form a simple sequential point process . For simplicity, we assume that the process starts at time zero, but other starting distributions may also be accommodated
Due to the independence assumptions in the model, the hazard rate of is particularly appealing. Write for the backwards recurrence time at , that is, the difference between and the last event falling before or at time . Then, [16], so that the density with respect to is given by
| (7) | |||||
for [8, 16], under the conventions that an empty product is set to one and that .
The sequential point process is not necessarily hereditary, for example when has small bounded support. Thus, we shall assume that . In this case, can be factorised in terms of its Papangelou conditional intensity
| (8) |
for . It depends on the configuration only through the point that is closest to , no matter how large the distance . Such models are known as nearest-neighbour Markov point processes [3]. Their density satisfies a factorisation similar to (6) for fixed range Markov processes. Indeed, for ,
and . The interaction functions are
and
for and with otherwise. Note that, as the pairwise interaction function involves two consecutive neighbours, it depends on the whole configuration in contrast to the models discussed in the previous subsection.
Next, consider the conditional distribution of on given on and on . Formula (5) specialises as follows:
| (9) |
with the convention that for , if and otherwise. Compared to (8), the survival probability is replaced by . If , (9) reads
as in (8), except for the fact that is restricted to . We conclude that the conditional distribution is a nearest-neighbour Markov point process on . Assuming , for , its density can be written as
with
under the convention , and
for and with otherwise. For the special case , the ratio should be replaced by In conclusion, the boundary conditions and affect the interaction functions only through the two nearest neighbours and , provided they exist.
5 Cox processes
A Cox process is a two-stage stochastic process. More specifically, let be a random field on and define the random measure by
for all Borel sets . Then, conditionally on , is a chronologically ordered Poisson process on with intensity function . Clearly, conditions must be imposed on so that the integral representation of is well-defined, for example that almost surely has continuous realisations [1, 2]. The density and Janossy measures of are found by integrating out over the distribution of , that is,
| (10) |
for all [24].
Since the Papangelou conditional intensity typically is not known explicitly, we focus on Proposition 1. Firstly, upon plugging in formula (10),
with the marginal Janossy density of , the restriction of to , given by
since conditional on , is a Poisson process. Finally, splitting , we conclude that, provided and are feasible in the sense that , the conditional distribution of on , , given and is a Cox process with its driving random field distributed as the
weighting of the distribution of .
As a clarifying example, consider the so-called compound Poisson process on for which is constant over , taking either of the values with equal probability. Then, writing for the sum of the cardinalities of and and for the length of ,
In other words, the conditioning has the effect of changing the probability of from a half to
through , the number of observed points. A further example will be studied in detail in Section 7.
6 Simulation study: renewal processes
In this section, we will consider parameter and state estimation for a well-known renewal process model. It is shown that naive approaches may result in bias. Instead, we shall adapt techniques for edge correction in spatial data to sequential point processes on the line.
Figure 1 shows a realisation of a temporal renewal process on observed within with Erlang inter-arrival probability density
for and .

For renewal processes observed in an unbroken interval , , [16, Chapter 8] surveys two approaches to estimate the parameters of the inter-arrival distribution . The first method is to treat the fully observed inter-arrival times , , as a random sample from and apply maximum likelihood or the method of moments to obtain parameter estimates. The second approach is to use the explicit representation of the likelihood in terms of the hazard rate and apply maximum likelihood estimation directly. Note that the first approach applies equally to observations on broken intervals, but the second one does not.
6.1 Inference based on fully observed intervals
Denote the lengths of the fully observed inter-arrival intervals by . If these would constitute a valid random sample, for fixed, the model would be an exponential family with sufficient statistic . The maximum likelihood estimator would exist and be given by The parameter could be estimated by profile likelihood. In our context, however, the sample size is random. Nevertheless, [16] suggests to proceed as if the were a random sample and claims this causes relatively little loss of information.
For the realisation consisting of points depicted in Figure 1, consider the observable inter-arrival times. For this sample, , whilst the profile likelihood method yields . To assess the bias and variance, we generated data patterns on for the parameter values and . We iteratively excluded the middle of the left-most interval and estimated . The results are summarised in the table below.
| observation interval | mean | variance |
|---|---|---|
We conclude that the bias and variance increase as the observation window contains less inter-arrival intervals. The bias occurs as smaller intervals are more likely to fall in the observation window, a phenomenon known as length bias [16]. For the smallest interval, the bias is severe. Indeed, of the samples on the union of two intervals of length each, less than half had observable inter-arrival times at all. Moreover, the sub-interval lengths are only slightly larger than the expected inter-arrival length of .
6.2 Monte Carlo maximum likelihood with missing data
The approach of Section 6.1 does not make full use of the available data, as it completely ignores partially observed inter-arrival intervals. Here, we adapt the method of [13] for dealing with missing data to better account for such intervals.
Again, suppose is a renewal process on that is observed on . Write for the density of the inter-arrival time distribution. By part (b) of Theorem 1, is a normalising constant for the conditional Janossy density on given the configuration elsewhere, say on and on . Hence, writing for the vector of un-observed points in falling in , the log likelihood ratio with respect to a given reference parameter is [13, 24]
where is of the form (7). In general, there is no explicit expression, so we must rely on Monte Carlo approximation, that is, replace the expectation by an average over a sample from the conditional distribution to obtain
| (11) |
Specifically, the form a sample from the conditional distribution of on given on under the reference parameter . By taking derivatives, we get the Monte Carlo score and Fisher information. Note that even for exponential families, in the missing data case there may not be a unique maximum likelihood estimator.
To generate a sample , , we use the Metropolis–Hastings approach [6, 14, 15, 20] and tune it to the present context. An alternative is to use birth-and-death processes [25], but note that special care is needed to avoid explosion while ensuring sufficient mixing at the same time. Further details are provided in the Appendix.

Let us return to the model of Subsection 6.1 and the data plotted in Figure 1. The parameter is the rate , and, for ,
Hence, the sufficient statistic consists of , the number of points, and , the backward recurrence time from . Write for the points observed in and for those in . For our data, consists of points, of .
To find a suitable reference parameter for the log likelihood ratio, we use the Newton–Raphson method [13]. For the data of Figure 1, this method gives . We compute the Monte Carlo log likelihood ratio using samples from a long Metropolis–Hastings run sub-sampled every thousand steps after a thousand steps burn-in. Note that it is sufficient to store the sufficient statistics only, in this case the length of the vectors . The function is shown in Figure 2. It has a unique maximum at ; the Monte Carlo inverse Fisher information is .
To assess the bias and variance, we considered a hundred data patterns as in Section 6.1. For each pattern, after ten Newton–Raphson steps from the true value , Monte Carlo samples were obtained by sub-sampling in a long run every thousand steps after a burn-in of a thousand steps. The results are summarised in the table below.
| observation interval | mean () | variance |
|---|---|---|
One sees that compared to the naive approach, the bias is much reduced by correctly taking into account missing data and does not increase noticeably for smaller sub-intervals. The variance is also reduced but does increase when more data is missing.
7 Application
Figure 3 shows daily records of calls to NHS Direct, a phone service operated by the National Health Service in Britain which people could call 24 hours a day to get medical advice. The calls shown are those that reported acute gastroenteric complaints in the county of Hampshire (on the English south coast and including e.g. the towns of Winchester and Southampton). The full data were described and analysed in [9, 10, 11]. A modified version provided by Professor Diggle and Dr Hawtin is available at
www.lancaster.ac.uk/staff/diggle/pointpatternbook/datasets/AEGISS.
The latter data contain records from the years 2001 and 2002. Figure 3 plots the calls recorded during September and October 2001. A salient feature is that no calls were registered during the period September 13th–September 30th with recording resuming on October 1st, 2001. This gap is clearly visible in the figure.

As in [9], we assume that calls are made according to a log-Gaussian Cox process on with (time measured in days) so that in the notation of Section 5 The integrable function accounts for temporal variations and is an Ornstein–Uhlenbeck process, that is, a stationary, Gaussian, Markovian process with exponentially decaying covariance function
The mean is chosen so that the expectation of . By [1, 2, 23], has almost surely continuous realisations and the model is well-defined.
Since the data is discretised in daily counts, the intensity of counts during the -th day may be approximated by , . As is an Ornstein–Uhlenbeck process, it satisfies the Markov recursion
for independent zero-mean normally distributed random variables having variance under the convention for . In terms of the ,
| (12) |
In words, is a sum of independent normally distributed components discounted by elapsed time.
The goal of this section is two-fold. Firstly, we shall contrast moment based estimation with and without taking into account the gap; then, we will consider state estimation.
7.1 Parameter estimation
Although in principle it is possible to carry out likelihood based inference, this would be computationally costly since the missing data consist not only of the missing counts in September 2001, but also of all the or, equivalently, the , cf. Section 5. Hence [9] proposed to use moment methods.
First consider . Since the expectation of is one, is the expected number of counts for day . This observation led [9] to fit a Poisson log-linear regression model of the form
. This model takes into account the apparent increase of incidences in Spring, the overall increase in calls to NHS Direct over time and the weekend-effect through the , but ignores over-dispersion due to the Gaussian field. Note also that the counts are conditionally rather than jointly independent.
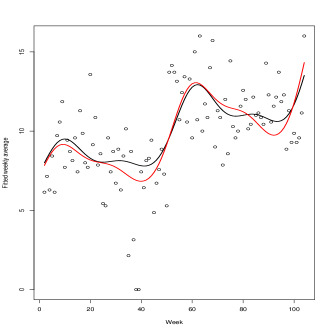
To assess the effect of the gap, we estimate the parameters based on two scenario’s as follows. A naive estimator treats the zero counts in September as if they were true observations. The result is the red line in Figure 4. A more sophisticated approach disregards the time period from September 13–30, with the black line in Figure 4 as a result. The trough due to the missing data is clearly visible in the picture and, due to the periodic nature of the fitted model, also affects the behaviour a year later.


Next, turn to estimation of and . Let , , denote the observed number of calls during day . The analogue of the pair correlation function [7] for count data is which has expectation at lag regardless of . Therefore, the minimum contrast method minimises
| (13) |
over and . Here, is an estimate of , and is the number of lags considered.
Minimising (13) with based on all data including the spurious zeroes using lags, we obtain and . The fit is indicated in the left-most panel of Figure 5. Note that is underestimated, hence the pair correlation function is overestimated.
The zero counts between September 13th and September 30th, 2001, should not be taken into account. Thus, in (13), we plug in the appropriate estimator (on which the black line in Figure 4 is based) and for lag , consider only pairs for which both and do not fall in the period September 13–30. Doing so, we obtain and . Thus, the value of is not much affected, but that of is. The fit is indicated in the right-most panel of Figure 5. We conclude that correlations between counts separated by a week or more are small.
7.2 State estimation
Our final goal is to fill the gap in Figure 3 by sampling from the conditional distribution given the data. Now, as the estimated pair correlation function shown in Figure 5 is close to one for lags of a week and more, one may restrict attention to the counts and either side of the gap. Moreover, for Cox processes, state estimation amounts to sampling from the driving random measure, cf. Section 5, which, by (12), is uniquely defined by the , . Therefore, the log likelihood, up to a constant , is given by
| (14) |


Since cannot be evaluated exactly, we use a Metropolis–Hastings algorithm to sample from (14) as in [5]. The proposal distribution is a multivariate normal one with independent components having variance and mean times the gradient of (14). Thus, transitions are steered into a desirable direction. It is shown in [27] that the Markov chain is aperiodic and Lebesgue-irreducible, so that for almost all starting states, the chain converges to (14) in total variation.
For , we ran the chain for steps. Using the realisation thus obtained, shown in Figure 6, we sampled the counts and re-estimated the parameters by minimum contrast. The results are similar to those obtained using the more sophisticated approach in Section 7.1. Indeed, and , whereas the plot of averaged over weeks is almost identical to the black line in Figure 4.
8 Summary
In this paper, we considered temporal point processes observed in broken observation windows. We derived the marginal and conditional distributions in terms of the Janossy densities of the underlying sequential point process and studied Markovian and Cox model in more detail. We carried out a simulation study to assess the the length bias in renewal processes and analysed a real-life data set. The approach can easily be extended to space-time by incorporating spatial marks.
Acknowledgements
Data were provided by Professor Peter Diggle, Lancaster University, and Dr Peter Hawtin, Health Protection Agency, Southampton Laboratory. The data were derived from anonymised data-sets collected during project AEGISS, a collaborative surveillance project based in the south of England. The project was financially supported by the Food Standards Agency. The author acknowledges Professors Boucherie and Van der Mei for fruitful discussions.
References
- [1] R.J. Adler. The geometry of random fields. Chichester: Wiley, 1981.
- [2] R.J. Adler and J.E. Taylor. Random fields and geometry. New York: Springer, 2007.
- [3] A.J. Baddeley and J. Møller. Nearest-neighbour Markov point processes and random sets. Internat. Statist. Rev., 57:89–121, 1989.
- [4] P. Brémaud. A martingale approach to point processes. Ph.D. dissertation, University of Berkeley, 1972.
- [5] A. Brix and P.J. Diggle. Spatiotemporal prediction for log-Gaussian Cox processes. J. R. Statist. Soc. B, 63:823–841, 2001.
- [6] S. Brooks, A. Gelman, G. Jones and X.-L. Meng (Eds). Handbook of Markov Chain Monte Carlo. Handbooks of Modern Statistical Methods. Boca Raton: Chapman & Hall/CRC Press, 2011.
- [7] S.N. Chiu, D. Stoyan, W.S. Kendall and J. Mecke. Stochastic geometry and its applications. 3rd ed. Chichester: Wiley, 2013.
- [8] D.J. Daley and D. Vere–Jones. An introduction to the theory of point processes. Volume I: Elementary theory and methods. 2nd ed. New York: Springer, 2003.
- [9] P.J. Diggle, B. Rowlingson and T.-L. Su. Point process methodology for on-line spatio-temporal disease surveillance. Environmetrics, 16:423–434, 2005.
- [10] P.J. Diggle, P. Moraga, B. Rowlingson and B.M. Taylor. Spatial and spatio-temporal log-Gaussian Cox processes: Extending the geostatistical paradigm. Stat. Sci., 28:542–563, 2013.
- [11] P. Diggle, L. Knorr-Held, B. Rowlingson, T. Su, P. Hawtin and T. Bryant. On-line monitoring of public health surveillance data. In Monitoring the health of populations: Statistical principles and methods for public health surveillance, pp. 233–266. R. Brookmeyer and D.F. Stroup (Eds.). Oxford: Oxford University Press, 2003.
- [12] D.H. Fremlin. Measure theory. Volume 2: Broad foundations. 2nd ed. Colchester: Torres Fremlin, 2003.
- [13] C. Geyer. Likelihood inference for spatial point processes. In Stochastic geometry (Toulouse, 1996). Monographs in Statistics and Applied Probability, Volume 80, pp. 79–140. Boca Raton: Chapman & Hall/CRC Press, 1999.
- [14] C.J. Geyer and J. Møller. Simulation procedures and likelihood inference for spatial point processes. Scand. J. Stat., 21:359–373, 1994.
- [15] P.J. Green. Reversible jump Markov chain Monte Carlo computation and Bayesian model determination. Biometrika, 82: 711–732, 1995.
- [16] A.F. Karr. Point processes and their statistical inference. 2nd ed. New York: Marcel Dekker, 1991.
- [17] G. Last and A. Brandt. Marked point processes on the real line. The dynamic approach. New York: Springer, 1995.
- [18] M.N.M. van Lieshout. Markov point processes and their applications. London/Singapore: Imperial College Press/World Scientific Publishing, 2000.
- [19] M.N.M. van Lieshout and A.J. Baddeley. Extrapolating and interpolating spatial pattern. Spatial cluster modelling, A.B. Lawson and D.G.T. Denison (Eds.), pp. 61–86. Boca Raton: Chapman & Hall/CRC Press, 2002.
- [20] M.N.M. van Lieshout. Markovianity in space and time. In Dynamics & stochastics: Festschrift in honour of M.S. Keane, D. Denteneer, F. den Hollander and E. Verbitskiy (Eds.), Lecture Notes–Monograph Series, Volume 48, pp. 154–168. Beachwood: Institute for Mathematical Statistics, 2006.
- [21] M.N.M. van Lieshout. Campbell and moment measures for finite sequential spatial processes. In Proceedings Prague Stochastics 2006, M. Hušková and M. Janžura (Eds.), pp. 215–224. Prague: Matfyzpress, 2006.
- [22] S.P Meyn and T.L. Tweedie. Markov chains and stochastic stability. 2nd ed. Cambridge: Cambridge University Press, 2009.
- [23] J. Møller, A.R. Syversveen and R.P. Waagepetersen. Log Gaussian Cox processes. Scand. J. Statist., 25:451–482, 1998.
- [24] J. Møller and R.P. Waagepetersen. Statistical inference and simulation for spatial point processes. Boca Raton: Chapman & Hall/CRC, 2004.
- [25] C.J. Preston. Spatial birth-and-death processes. Bull. Inst. Internat. Statist., 46:371–391, 1977.
- [26] B.D. Ripley and F.P. Kelly. Markov point processes. J. London Math. Soc. (2), 15:188–192, 1977.
- [27] G.O. Roberts and R.L. Tweedie. Exponential convergence of Langevin diffusions and their discrete approximations. Bernoulli, 2:341–363, 1997.
- [28] S.S. Singh, B.-N. Vo, A. Baddeley, S. Zueyv. Filters for spatial point processes. SIAM J. Control Optim., 48:2275–2295, 2009.
Appendix: Markov chain Monte Carlo
To simulate a point process whose distribution is defined by the Papangelou conditional intensity, we adapt two general strategies to our context. Throughout, let be an hereditary sequential point process on with density with respect to and Papangelou conditional intensity .
Metropolis–Hastings sampling
The Metropolis–Hastings method works by proposing an update according to a distribution that is convenient to sample from, and then to accept or reject this proposal with a probability that is chosen so as to make sure the detailed balance equations are satisfied [6].
The two generic types of proposals are births and deaths. More precisely, with probability propose a birth, otherwise a death. In the first case, select a point uniformly on and insert it in its chronological position . In case of a death, a point is chosen uniformly for deletion; if the sequence is empty, nothing happens. Then, if the current vector is , the proposal to add is accepted with probability
the proposal to delete the -th point with probability
It is easily seen that is an invariant density. Moreover, if we start the chain in a sequence for which , the chain will almost surely never leave the set of states having positive density.
In order to show that the Metropolis–Hastings chain , , converges to in total variation from any initial state having positive density, it is sufficient to assume stability, that is, that the Papangelou conditional intensity is uniformly bounded by some . The proof follows the same lines as in [13].
Birth-and-death process sampling
Since the Papangelou conditional intensity may fluctuate a lot, we define birth-and-death processes in terms of local bounds. More precisely, assume that
| (15) |
for some integrable function that is constant on , , say , and some , with an appropriate convention for and . Then, the birth-and-death algorithm runs as follows. If the current state is ,
-
•
compute the upper bound to the total birth rate by
and take death rate ;
-
•
generate an exponentially distributed sojourn time with rate parameter ;
-
•
with probability generate a new point (‘birth’) as follows:
-
–
sample an interval with probability and propose a new point uniformly in the chosen interval;
-
–
accept the proposal with probability ;
-
–
-
•
with probability delete a uniformly chosen point.
Then the rate for a transition from to for is
so that the birth rate is effectively on . Therefore, is an invariant density. An appeal to [25] implies the existence of a unique jump process with the given birth and death rates; is its unique invariant probability density and the process converges to in distribution from any for which .
Renewal process
As an example, consider a renewal process with Erlang inter-arrival times. To derive a local bound on the conditional intensity, note that for ,
and
is bounded from above by
The last bound follows from the fact that
The bound can be improved upon in some cases by noting that the function
increases on if . Finally, since the sub-interval length is bounded, stability follows.