Photometric Evidence of an Intermediate-age Stellar Population in the Inner Bulge of M31
Abstract
We explore the assembly history of the M31 bulge within a projected major-axis radius of 180″ (680 pc) by studying its stellar populations in Hubble Space Telescope WFC3 and ACS observations. Colors formed by comparing near-ultraviolet vs. optical bands are found to become bluer with increasing major-axis radius, which is opposite to that predicted if the sole sources of near-ultraviolet light were old extreme horizontal branch stars with a negative radial gradient in metallicity. Spectral energy distribution fits require a metal-rich intermediate-age stellar population (300 Myr to 1 Gyr old, ) in addition to the dominant old population. The radial gradients in age and metallicity of the old stellar population are consistent with those in previous works. For the intermediate-age population, we find an increase in age with radius and a mass fraction that increases up to 2% at 680 pc away from the center. We exclude contamination from the M31 disk and/or halo as the main origin for this population. Our results thus suggest that intermediate-age stars exist beyond the central 5″ (19 pc) of M31 and contribute 1% of the total stellar mass in the bulge. These stars could be related to the secular growth of the M31 bulge.
1 Introduction
As the nearest massive spiral galaxy (780 kpc, McConnachie et al., 2005), the Andromeda galaxy (M31) provides an excellent laboratory with which to study the construction of galactic bulges. Compared to the bulge of the Milky Way (MW), the advantages of the M31 bulge lie in that i) stars are at a single, well-determined distance and ii) it is free of the strong, spatially non-uniform line-of-sight extinction against the Galactic bulge. Indeed, the M31 bulge is transparent across almost the entire electromagnetic spectrum, allowing for a panchromatic view of its stellar (and interstellar) components (Li, Wang & Wakker, 2009, for a recent review). These advantages largely reduce the uncertainty in deriving the intrinsic spectral energy distribution (SED) of the bulge, which is critical to determining the ages and metallicities of the underlying stellar populations.
The stellar populations in the inner bulge of M31 are quite different from those of our Galaxy. Around the Galactic center, there are a number of giant molecular clouds (4) and young massive stars (Morris & Serabyn, 1996). In contrast, there are few signs of massive stars in the inner bulge of M31. Olsen et al. (2006) investigate the near-infrared (NIR) color-magnitude diagrams (CMDs) of several bulge regions, 2′ (450 pc) away from M31*, the central super-massive black hole (Dressler & Richstone, 1988; Kormendy, 1988; Crane et al., 1992; Garcia et al., 2010; Li et al., 2011), and find that stars there are old (6 Gyr) and metal-rich () (see also Stephens et al. 2003; Sarajedini & Jablonka 2005). Saglia et al. (2010) obtain long-slit optical spectra (4787 Å5857 Å) in the central 5′ of the M31 bulge, and in most of these spectra find that multiple spectroscopic line indexes can be fitted with a single metal-rich stellar population of age around 12 Gyr old. Based on the ultraviolet (UV) CMD from Hubble Space Telescope (HST) Faint Object Camera (FOC) observations of the central 14″14″ (5353 pc) field of M31 in two bands (F175W and F275W), Brown et al. (1998) suggest that detected UV point sources are not young massive stars, but mainly old evolved low-mass stars, a result confirmed over a larger area by Rosenfield et al. (2012).
These evolved low-mass stars, i.e., core helium burning extreme horizontal branch (EHB) stars and their descendants, have high effective surface temperatures K and can contribute substantially to the UV emission of the M31 bulge. When evolved low-mass stars leave the EHB phase, they do not have significant stellar envelopes and thus do not evolve into the asymptotic giant branch (AGB) phase, and instead either leave the AGB phase early (PE-AGB) or fail to enter the phase entirely (AGB-manqué). These hot-post HB stars (HP-HB stars) are relatively long-lived (10 Myr, O’Connell 1999). In contrast, the stars with enough envelopes will complete the AGB phase and then the post-AGB (PAGB) phase. PAGB stars are more luminous than the PE-AGB and AGB-manqué stars, but because of their short lifetimes ( yr, see review by O’Connell 1999), PAGB stars contribute little to the integrated emission in the UV bands. Indeed, based on the latest HST Wide Field Camera 3 (WFC3) UVIS observations, Rosenfield et al. (2012) support the argument of Brown et al. (1998) that most of the detected UV sources in the F275W and F336W bands should be HP-HB stars, which can account for only 2% of the integrated bulge light in the F275W band. Brown et al. (1998) and Rosenfield et al. (2012) suggest that the remaining extended UV emission arises from the combination of numerous unresolved EHB stars, which must be present to explain the HP-HB populations that is observed. Rosenfield et al. (2012) also find that the fraction of stars passing through this channel increases towards the center of the galaxy, though it is never more than 3%. They attribute this trend, as well as the positive gradient in the GALEX FUVNUV color distribution (Thilker et al., 2005), which are seen over 3.5 kpc, to the negative radial gradient in the stellar metallicity found by Saglia et al. (2010), on the theory that metallicity affects the strength of stellar winds and hence the mass of stellar envelopes and consequently the EHB and HP-HB populations. The FUVNUV color measures the slope of the so-called UV upturn (Thilker et al., 2005; O’Connell, 1999, and references therein).
The source of UV emission becomes more complicated at the very center of M31, where Lauer et al. (1998) suggest that the FUV peak at the dynamical center of M31 found by King et al. (1995) is slightly extended and is not due to an AGN. Bender et al. (2005) further find that the optical spectrum extracted from the central 0.3″ field (1.1 pc) is consistent with a population of A-type stars or a 200-Myr-old starburst. With observations from the HST Advanced Camera for Surveys (ACS) High-Resolution Channel (HRC), Lauer et al. (2012) resolve this central star cluster into twenty near-UV (NUV) bright stars and argue that they cannot be old stars in the PAGB phase, whose evolutionary duration is short. Saglia et al. (2010) also show that an old stellar population is not consistent with their derived spectroscopic line indexes within the central 5″ (19 pc) region and that an intermediate-age stellar population is needed. The origin of these intermediate-age stars (several hundreds of Myr old) remains an enigma. Saglia et al. (2010) suggest that a gas-rich minor merger may have triggered a nuclear starburst. If this scenario is valid, it is natural to ask whether or not the same event could have triggered star formation in a larger portion of the M31 bulge; how much stellar mass this event could have contributed to the bulge and what is the event’s role on the evolution of the whole bulge.
In this paper, we concentrate on studying the stellar populations in the inner bulge of M31 with the latest multi-band HST dataset and using our results to constrain the assembly history of the M31 bulge. We utilize HST WFC3 and ACS observations in ten filters from the near-UV to near-IR (listed in Table 1), which cover the central 250″250″ (950950 pc) region of M31. Previous photometric observations obtained by ground-based telescopes in the optical/near-infrared bands suffer from confusion and differential extinction due to limited and varied resolutions and sensitivities, which hamper the study of the spatial variation of underlying stellar populations. Images in our HST dataset have superb resolution and sensitivity and cover a broad wavelength range. The inclusion of the near-UV filters in particular is crucial to break the age-metallicity degeneracy in the SED fitting. Uncertainties in derived ages and metallicities are smaller by more than 60% , when the UV bands are included, than when only optical bands are used, based on studies of 42 globular clusters from Kaviraj et al. (2007). These authors find that SED fitting using UV photometry also outperforms the spectroscopic index method. Further the intermediate-age stellar population are expected to have SEDs that peak at 4000 Å, making the UV as important constraint. Using fits of this full spectrum coverage, we find evidence for an intermediate-age stellar population.
The reminder of the paper is organized as follows. We describe the observations and data reduction in §2 and the color gradients along the minor axis of the M31 bulge in §3. Our method and analysis procedure are presented in §4 and in §5, respectively. We discuss our results in §6 and summarize our conclusions in §7.
2 Observation and Data Reduction
2.1 HST Multi-Wavelength Dataset
The majority of our dataset comes from the Panchromatic Hubble Andromeda Treasury (PHAT; Dalcanton et al., 2012; Williams et al., 2014). As an HST legacy program, this survey mapped roughly one third of the M31 disk with the HST WFC3 and ACS in six bands, F275W, F336W, F475W, F814W, F110W and F160W. Except for the F110W filter, various dither patterns (see Table 1) were used to remove bad pixels and cosmic-rays, as well as to alleviate undersampling. The PHAT data include the observations in both the shortest and longest wavelength bands (F275W: 2700 Å and F160W: 1.5 m) used in this work, giving important leverage needed to constrain extinction and age. F336W and F475W on the blue and red sides of the 4000 Å break provide a sensitive age measure of the underlying stellar populations. The F814W, F110W and F160W bands, being at longer wavelengths, are insensitive to extinction and age and provide a useful color indicator of metallicity.
We include observations taken in four additional UV/optical bands to increase our wavelength coverage. Three of them come from Program GO-12174 (Li et al, in preparation): two medium bands (F390M, F547M) and one narrow band (F665N). Their exposure times are longer than those of the PHAT program. As a result, signal-to-noise ratios (S/Ns) of these images are comparable to those of the wide filters used for PHAT. These additional single-pointing observations covered a limited area of sky. We use the F547M band as an analog of the traditional Johnson band, because of their similar central wavelengths. The fourth filter, F435W, comes from observations taken as part of three different programs: Program 10006, 10760 and 11833 (Williams et al., 2005). These observations were originally taken to monitor the optical counterparts of X-ray novae in the M31 bulge. With various pointing directions, rotation angles and exposure times, the F435W observations covered roughly the field of interest, except for its southwest corner. The observations were all taken with dither patterns. Fig. 1 gives the low-resolution UV and optical spectrum of the central 10″20″ region of M31 obtained from O’Connell (1999), with overlaid the transmission curves of six UV and optical bands in our dataset, as well as those of two GALEX bands; FUV and NUV, to demonstrate different spectral features covered by these filters.
2.2 Data Reduction
The raw data and calibration files were downloaded from the Multimission Archive at STScI (MAST). The basic calibration of each dithered exposure was made with the latest HST pipeline, OPUS version 2010_4, CALACS version 5.1.1 and CALWFC3 version 2.1. The steps included identifying bad pixels, bias correction, dark subtraction and flat fielding.
The ‘Astrodrizzle’ task, based on PyRAF111‘PyRAF’ and ‘Astrodrizzle’ are the product of the Space Telescope Science Institute, which is operated by AURA for NASA., was used to register individual dithered exposures, correct for distortion, mask out defects (including cosmic rays), and combine the dithered exposures into pointing images. While ‘Astrodrizzle’ only corrected for the distortion of the F110W images, cosmic-rays in individual F110W images were identified in the CALWFC3 step, through the use of the sequential readouts ‘MULTIACCUM’ mode. For the F275W and F336W observations, in which the WFC3/UVIS chip gap was covered by only one dithered exposure, cosmic rays could not be readily identified. For simplicity, we manually removed the regions covered by the gap before mosaicking the images.
The construction of the mosaic for each filter follows a few steps. First, for the F475W band, we used the technique presented in Dong et al. (2011) to correct for the astrometry and bias offset among different pointings. We tied our images to the absolute astrometric frame defined by the 2MASS catalog (Skrutskie et al., 2006). Second, we corrected for the astrometry of any of the near-UV or optical image relative to the F475W band, using commonly detected stars. We aligned the near-IR F110W or F160W images to the astrometry-corrected F814W images (which were themselves aligned to the F475W images and have more stars in common with the near-IR bands). The bias offsets among different pointings in these nine filters were also removed. Finally, we merged the images to form the mosaics in the ten bands. These mosaics cover a central 250″″ (950950 pc) field of M31. The ‘PHOTFLAM’ values listed in Table 1 are used to convert the image units from counts (electron/s) to flux density (erg cm-2 s-1 Å-1).
Well-characterized uncertainties are crucial for the SED fitting. The photometric uncertainty at each pixel in a mosaiced image (; the subscript stands for the nth filter) consists of three main factors: 1) the Poisson statistical noise of the electronic signal; 2) the error in the bias and flat-field calibration; and 3) the systematic uncertainty in the photometry, as described by the fits header ‘PHOTFLAM’ keyword. We empirically characterize the factors 1) and 2), using the method described in Dong et al. (2014). Briefly, for each pixel, we calculated the median and 68% percentile of fluxes in its adjacent field as the estimates of the local background and its uncertainty. The median ratio of the statistical uncertainties to the fluxes of individual pixels in each of the ten-band mosaics is listed in Table 1. The WFC3 and ACS systematic calibration errors222WFC3: http://www.stsci.edu/hst/wfc3/phot_zp_lbn and ACS: Bohlin, R., 2012, acs, rept, 1B. Private communication with STScI helpdesk are 2%. We found that with the same incoming spectrum, the fluxes derived from the SYNPHOT in Chips 1 and 2 of WFC3/UVIS in the F275W band could differ by up to 3%333The difference could be due to ‘SYNPHOT’, HST/WFC3 STAN Issue 11. Therefore, in §5, we adopt the mean value of the F275W fluxes from the SYNPHOT for Chips 1 and 2 of WFC3/UVIS, including an extra 1.5% systematic error to the F275W band during the SED fitting. The systematic errors due to the factor 3) are also listed in Table 1. In §5, when we present the SED fitting for a selected region, where the integrated flux uncertainty in each band is the square root of the quadratic sum of the empirical statistic errors in all the included pixels in this region, together with the systematic errors.
We corrected for foreground Galactic extinction (E(BV)=0.062, i.e., =0.17, Schlafly & Finkbeiner, 2011) for all bands. The relative extinctions (, where or is the absolute extinction in the or F547M band) derived from the MW-type extinction law in Fitzpatrick (1999) for an old metal-rich stellar population (12 Gyr and solar metallicity) are listed in Table 1. As discussed in the Appendix A of Dong et al. (2014), the relative extinctions () in the ten HST bands are insensitive to the adopted background spectrum.
2.3 Region Selection
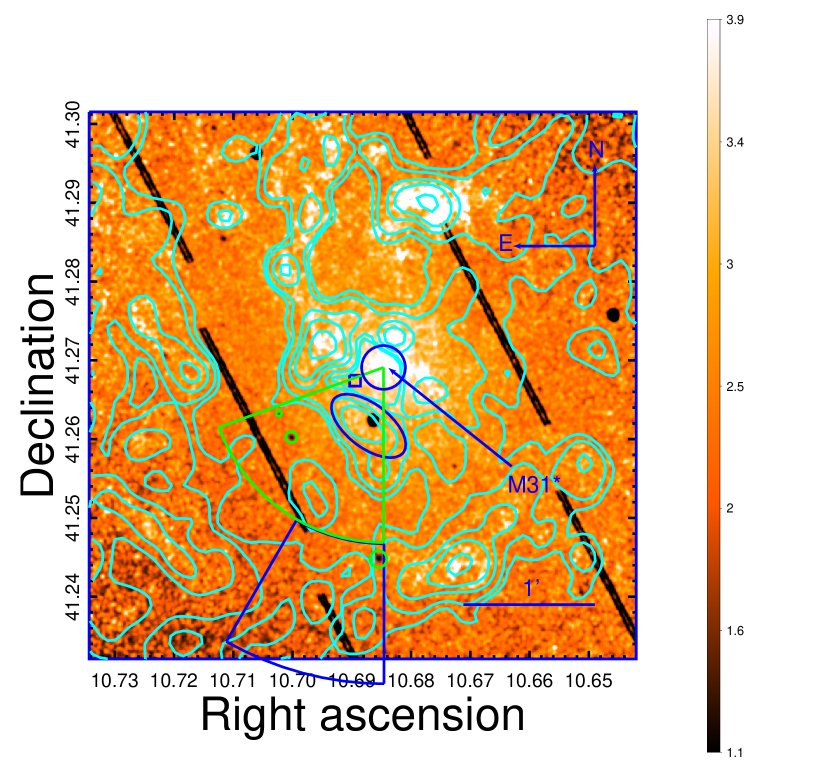
To break the well-known degeneracy between extinction, age and metallicity, we selected only low extinction regions for the present study. Fig. 2 presents a map of NIR-to-NUV (F160W/F336W) intensity ratio for the inner bulge. This ratio increases with the foreground extinction, as well as with the age and metallicity of unresolved stars. Fig. 2 shows that the ratio is generally high in regions with hot dust, as traced by the Spitzer/IRAC ‘dust-only’ 8 m intensity map of Li, Wang & Wakker (2009). This conclusion breaks down in the central 10″ (38 pc) region, where there is a high ratio of F160W to F336W, but no corresponding excess in 8 m emission. We discuss this region in §5.2. A previously known dusty clump located at 30″ (120 pc) southeast of M31* (as outlined by the blue ellipse in Fig. 2) has significant 8 m emission and is also detected in CO observations (Melchior & Combes, 2013), but is not prominent in our flux ratio map; Melchior & Combes (2013) suggest that this dusty clump is located at the far side of the bulge.
The mean ratio in the South East quadrant of Fig. 2 is smaller than those in the other three quadrants by at least 10%, indicating low foreground extinction. We isolate two sectors in this region to avoid the dusty clumps apparent in the flux ratio map and in the Spitzer/IRAC 8 m observations. We use the region between PA = 110o to 180o (green sector) for the central 100″, while beyond this radius, we use the region between PA=150o to 180o (blue sector), to avoid a dusty clump at PA140o and 160″ in projected radius away from M31*. According to Li et al. (in preparation), the two-dimensional light distribution in the M31 bulge in the ten HST bands can be characterized by elliptical isophotes with a PA=50.9o (East of North) and an axis ratio of 0.8. We divide these two chosen sectors into elliptical annuli steps of 5″ along the major-axis for the SED fitting in §5.2. We will refer to “radius” in this paper as being major axis length of each ellipse.
3 Color Gradients
We first analyze the radial gradients in UV-optical colors, which give us hints about the spatial variation of the properties of underlying stellar populations. Fig. 3 presents the HST WFC3/ACS colors obtained from the light intensities in four bands and along the minor-axis of the M31 bulge out to 144″, corresponding to a major-axis distance of 180″ (680 pc) and restricted to the two sectors we are using for analysis. In the same plot, we overlay the radial surface brightness distribution of the Spitzer/IRAC ‘dust-only’ 8 m emission. The colors tend to become bluer when moving away from M31* and are not correlated with the dust distribution. Therefore, the color gradients cannot be solely caused by the decrease of extinction and most likely represent a change in the intrinsic properties of the stellar populations.
Our HST UV-optical color gradients differ from those of GALEX FUVNUV in Thilker et al. (2005). Fig. 4 shows the radial color distributions of: F275WF475W and GALEX/FUVF475W, as well as GALEX FUVNUV. If the integrated flux in the F275W band was dominated by the EHB stars, as suggested by Rosenfield et al. (2012), the F275WF475W color, just like the FUVF475W color, can then be used to constrain the ratio of EHB to main-sequence turnoff stars. We would expect that the FUVF475W and F275WF475W colors follow the FUVNUV color, becoming increasingly red with the galactocentric distance, due to the decreasing contribution from EHB stars. But in the fact, the F275WF475W color turns bluer when moving away from M31*; although the FUVF475W color shows a positive radial gradient within the central 50″ (190 pc), it turns negative beyond that. These different color gradients suggest that the same population of stars that dominates the FUV flux (presumed by EHB stars in the old stellar population) probably dominate the FUV channel, but do not dominate the intensity in F275W and that instead the variation of the F275WF475W color along the radius may be due to another stellar population (see further discussion in §6.1.1).
4 The SED-fitting Method
We compare the observed and theoretical SEDs to constrain the properties of underlying stellar populations. To do this, we minimize the deviation between the observed flux in the nth filter, , and the predicted by a stellar synthesis model of given stellar age and metallicity,
| (1) |
where , /, and are the fraction of obscured starlight, the relative extinction, the absolute extinction and the normalization, respectively. is the uncertainty of , as described in §2.2. The sum in this expression is over all available filters (N10).
We utilize ‘Starburst99’ (Vázquez & Leitherer, 2005) to calculate the theoretical SEDs. Padova stellar synthesis models with full AGB treatments (but not the EHB stars and their descendants) are adopted. We use the default Kroupa (2002) Initial Mass Function (IMF) in Starburst99 (, =1.3 for 0.1 M⊙0.5 M⊙, 2.3 for 0.5 M⊙100 M⊙). Conroy & van Dokkum (2012) suggest that the IMF of the nuclear region of M31 is normal, rather than bottom heavy. While ‘Starburst99’ does not include the recipe for EHB stars, the presence of such stars should not affect our results, because their contribution in our multi-bands is small (see §3 and §6.1.1). We choose instantaneous burst populations of ages from 100 Myr to 15 Gyr with a step size of 0.01 dex (Myr) and five default metallicities (Z=0.02 , 0.2 , 0.4 , 1 and 2.5 ). We generate spectra for these ages and metallicities, which are then convolved with the filter transmission curves using the ‘SYNPHOT’ to obtain the corresponding fluxes in the ten HST bands. We then linearly interpolate the fluxes from these grids to obtain the fluxes of stellar populations with various ages (from 100 Myr to 15 Gyr) and metallicities (from 0.02 to 2.5 ).
Before we perform the minimization, we choose to fix two parameters. The first parameter is the fraction of the starlight that is obscured by dust in M31, 01, which is degenerate with (see Fig. 1 of Dong et al., 2014). However, is insensitive to in regions of low attenuation. This applies to the region that we select for the SED-fitting in §2.3. Therefore, we simply fix =1 (i.e., assuming that extinction exclusively arises from the foreground of the bulge). Setting free in the SED-fitting would not change the best-fit parameters, but would increase the uncertainties of the output ages and metallicities. The second parameter is the relative extinction, /. We adopt the average extinction curve (/) derived from five dusty clumps within the central 1′ (230 pc) radius of M31 (Dong et al. 2014; Table 1), which is characterized by =2.4. We also test MW-type extinction curve in §5 and our results remain unchanged, again because of low foreground extinction to the regions of interest.
5 Results
5.1 The Presence of Intermediate-age Stars
As an illustration of our method, we first select a region in the inner bulge of M31 (blue box in Fig. 2) to examine whether or not an intermediate-age stellar population may exist beyond the central 5″ (19 pc) of the M31 bulge. This region (5″5″, 19 pc19 pc) is 11″ (42 pc in projection) southeast of M31* and appears dim in the Spitzer/IRAC ‘dust-only’ 8 m image, indicating little local foreground extinction. The size of the region is large enough for us to obtain the photometry with statistical uncertainties 0.3% in all the ten bands and is sufficiently small to neglect any potential variation of the SED along the minor-axis of the bulge (§5.2).
We first fit the observed SED with one instantaneous stellar population as suggested by Saglia et al. (2010). This fit has four free parameters: , age, metallicity and normalization (). We search for the best fit with MPFIT (Markwardt, 2009). The fit is rather poor, especially for the UV bands (see Fig. 5), with /d.o.f.=24.6/6=4.1. The age and metallicity of the best-fit single stellar population are 4.4 Gyr and 2.2 Z⊙, respectively, with 0.08. The age is much smaller than 12 Gyr as derived by Saglia et al. (2010). If we fix the metallicity to the value of [Z/H]=0.16 (1.4 ) derived from Fig.12 of Saglia et al. (2010) at the corresponding radius, the reduced becomes even larger and the fitting is still poor for the UV bands.
We thus add another instantaneous stellar population to try to improve the fit. The model now includes three more parameters: the age, metallicity and mass fraction of the second stellar population. The resultant /d.o.f. of the model fit is 4.8/3=1.6, which is a significant improvement over the fit with the single population. According to the -test, the fit is improved with the null-hypothesis probability =0.13. The fitted extinction is formally zero, consistent with the ratio map in Fig. 2. The new model fits the UV bands well (see Fig. 5). The age of the old stellar population becomes 14.8 Gyr444This value is older than the Universe’s age, 13.8 Gyr. However, considering its uncertainty, 0.15 dex, it does not contradict the scenario that these stars formed in the early Universe., while the metallicity is 1.5 , similar to the values obtained by Saglia et al. (2010). The second stellar population has an age of 660 Myr and a metallicity of 2 . We estimate the uncertainties of the fitting parameters via a Monte Carlo simulation. We generate 100 fake SEDs based on the best-fit model and the flux measurement errors (assumed to be Gaussian; §2.2). Each of the fake SED is refitted. The 68% percentiles around the best fit value of a parameter are used as its 1 uncertainty. Because the SED predicted by the stellar synthesis model is a non-linear function of the input parameters, these errors are not symmetric to the best-fit value. In Fig 6, we show the correlation between the age and metallicity of the second stellar population. The age is tightly constrained (0.15 dex), whereas the metallicity has a large uncertainty ([Z/H]0.4). This intermediate-age stellar population, though accounting for only 0.9% of the total mass, contributes more than 50%, 20% and 25% of the integrated intensity in the F275W, F336W and F390M bands, respectively.
We also perform three tests to check the reliability of our result. First, we randomly select several regions of similar sizes and radius in the southeast of the M31 bulge and obtain similar ages/metallicities for the two stellar populations. Next, we check for EHB contamination in the F275W band. We repeat the two component fit excluding F275W band and find that the ages and the metallicities, as well as the light contribution by the intermediate-age stellar population, vary by less than 20%. Finally, we run the SED fitting without the UV bands (F275W, F336W, F390M). For a single instantaneous stellar population, the /d.o.f. value reduces to 3.9/3=1.3. The resultant age and metallicity of 9.8 Gyr and Z⊙ are similar to those of Saglia et al. (2010). When we utilize two stellar populations, the mass fraction of the intermediate-age stars decreases by a factor of 10, which indicates that the optical and IR data alone give little indication for the presence of the intermediate-age stellar population. Therefore, we conclude that our finding of the intermediate-age stellar population is firm.
5.2 Spatial Variation of the Stellar Populations
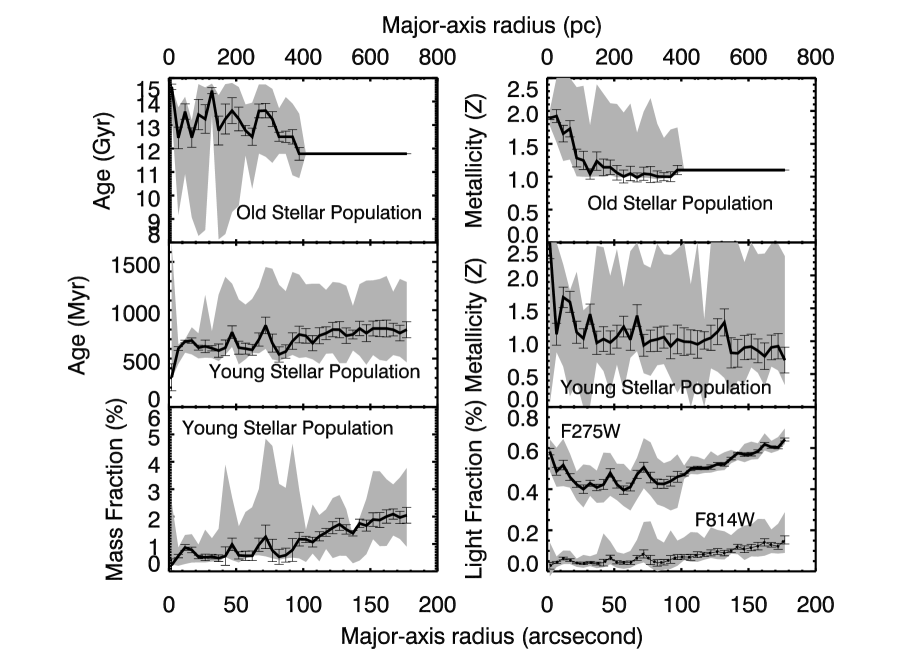
We now turn to investigate the radial variation of the stellar populations in the inner bulge of M31. We apply the same SED fitting as in §5.1 for the annuli defined in §2.3 with two instantaneous starbursts: one traces the old stellar population and the other represents a younger population. Within the sector outlined in green (see Fig. 2), data in all ten bands are available for the SED fit, for which the stellar ages and metallicities of the two populations are left as free parameters. For the large off-center sector (100″to 180″, marked blue in Fig. 2), which has data in only seven bands (six PHAT bands + F435W), we fix the age and metallicity of the old stellar population to the best-fit values obtained for the annulus of 95″ 100″ in the green sector, considering that from 100″ to 180″, the properties of the old stellar population are likely to be constant (see Fig.12 in Saglia et al. 2010). is also fixed to zero, which has little effect on the fit. The similar Monte Carlo simulations as used in §5.1 give the uncertainties of these parameters, which are dominated by the systematic photometric errors in the ten bands (the statistical uncertainty in each annulus is small, 0.6%). The fitting results are listed in Table 2 and the radial profiles of the fitted parameters are plotted in Fig. 7. If the two populations are distributed axisymmetrically in the bulge, the total mass of the old stellar population is 1.41010 M⊙ and the mass of the intermediated age population is 1.5108 M⊙ within the central 180″ (680 pc).
6 Discussion
Using a relatively extinction-free region in the inner bulge of M31, we have characterized the radial variations in age and metallicity of the stellar populations. Due to the limitations of the available filters, we use only two instantaneous starbursts to fit the observed SED. We have found strong evidence for the presence of an intermediate-age stellar population, in addition to a plethora of old stars in the inner bulge of the galaxy.
In this section, we first examine the possibility that the extra UV light, which has been attributed to the intermediate-age stellar population, may instead come from either old metal-rich, evolved low-mass stars in the bulge or main-sequence turnoff stars in the projected galactic disk and halo (§6.1). We then discuss why the intermediate-age stellar population has not been revealed in previous studies (§6.2). Lastly, we explore the potential origin of the population and the implications for the star formation history of the M31 bulge in §6.3.
6.1 Potential UV sources
6.1.1 Evolved Low-mass Stars
We find that EHB stars cannot dominate the unresolved emission in the three UV bands: F275W, F336W and F390M. The emission peak of the coolest EHB stars with temperature K (O’Connell, 1999) is around 2100 Å, near the short wavelength edge of the transmission curve of the F275W filter. Furthermore, the intensity observed in the broad-band F275W image is contaminated by the emission at optical wavelengths, where the M31 bulge is particularly bright, due to a well known red leak in the filter. This contribution from optical light means that only a fraction of the observed F275W emission is available to potentially be explained by EHB stars. The longer-wavelength F336W and F390M bands sit on the Rayleigh-Jeans tail of the EHB SED, making EHB stars very inefficient contributors to these bands. Our finding is supported by the data. In §3, we find that the gradients of F275WF475W and FUVNUV are totally different, suggesting that the FUV band is the only one where the EHB flux dominates. Further evidence is present in the UV-optical spectrum of the central 10″20″ region of M31 from O’Connell (1999) (Fig. 1). The spectral intensity decreases from the optical toward the UV and then increases shortward of 2000 Å, presumably due to the presence of EHB stars. We use a blackbody to fit the spectrum below 2000 Å minimizing the potential contamination from low-mass main-sequence turnoff stars and find that log (Teff)4.45, consistent with the value expected for EHB stars. From convolving the UV-optical spectrum and the blackbody with the HST WFC3/UVIS transmission curves, we find that the EHB contributes at most roughly 23%, 2.9% and 1.2% of the total fluxes in the F275W, F336W and F390M bands, respectively, even in these central regions where the fraction of EHB stars is expected to be highest. These values decrease with increasing radius, because of a decreasing fraction of EHB stars due to the presumably decreasing metallicity.
We suggest that main-sequence turnoff stars in the intermediate-age stellar population found in §5.1 explain the radial gradients of the near-UV and optical colors. In §5.2, we find that this relatively young population contributes at least 40% of the emission in F275W (the rest is from numerous low-mass main-sequence turnoff stars in the old stellar population) in the central 5″. This contribution reaches 62% at 180″ away from M31*. The metallicity of this population seems to be constant beyond 30″. Therefore, the increasing mass fraction of the population at larger radius is expected to cause the systematic blueing of the F275WF475W color with increasing radius. In the central 50″, EHB stars probably still dominate the FUV and NUV emission, which explains the positive radial gradient in FUVF475W. However, beyond the central 50″, the EHB contribution decreases while the FUV and NUV intensities are increasingly contributed by the intermediate-age stellar population. Fig. 8 shows the radial distribution of the light contribution in the observed GALEX FUV band for the intermediate-age stellar population. Although with large variation due to the limitation of our SED fitting, there is still a potential trend in this plot; the light contribution by this population increases from 20% near M31* to 60% at 180″. Therefore, the emission from main-sequence turnoff stars in that population offsets the metallicity effect of the old stellar population on FUVNUV. As a result, FUVNUV increases much slowly with radius, compared to the central 50″. Thus, the intermediate-age stellar population detected here is in addition to the EHB stars suggested in previous works.
6.1.2 Contamination by Disk and Halo Stars
Considering that the mass fraction of the intermediate-age stellar population increases with radius, one might suspect a substantial contamination from stars in the disk and/or halo of M31. We quantify the contamination based on existing disk and halo models. Kormendy & Bender (1999) and Courteau et al. (2011) have decomposed the light contributions from the disk, bulge and halo of M31 through fitting the surface brightness distributions in the ad bands, respectively. Their decomposition gives the half-light radius of the bulge and the scale length of the exponential disk as 0.8 kpc (210″) and 5 kpc (1320″) (see also the recent characterization in Dorman et al. 2013). The scale length of the disk is substantially larger than the size of our regions. With the small field-of-view considered here, their absolute contamination should be approximately uniform. Fig. 9 compares the model-predicted contribution in the band from the bulge and the disk and our measured contribution from intermediate-age stellar population. We find that within the central 100″, the disk can account for only 40% (16%49% at the 68 percentile uncertainties) of the flux of the intermediate-age stellar population. Similarly, Figure 9 of Courteau et al. (2011) shows that the halo contributes less than 2% in the band (the analog of the F814W band) in the inner bulge of M31. If halo stars are 13 Gyr old and 0.02 (Kalirai et al., 2006), for example, we then expect that they contribute 3% of the flux of the intermediate-age stellar population in the band. Halo stars are also too metal-poor to explain the intermediate-age stars. Most importantly, the observed mass surface density distribution of the intermediate-age stellar population (Fig. 10) is very much different from a flat distribution as may be expected from the disk and halo contamination. Therefore, we conclude that the bulk of the intermediate-age stellar population indeed arises from the M31 bulge.
6.2 Comparison with Previous Work
Previous studies of the stellar populations in the inner bulge of M31 use optical and/or near-IR data which are not particularly sensitive to intermediate-age stars. Olsen et al. (2006) analyze the images taken by Gemini/NIRI and HST/NICMOS observations of the M31 bulge. Even with the high angular resolution provided by the the Gemini/NIRI with Adaptive Optics (0.09″) and HST/NICMOS (0.185″), they detect only individual stars at the tip of the red giant branch (RGB) with ages 1 Gyr. Saglia et al. (2010) fit the ground-based long-slit optical spectra within the central 5″ (19 pc) radius with two stellar populations. They find an intermediate-age stellar population with age 600 Myr, which contributes less than 10% of the total stellar mass, with the rest from the old stellar population (8 Gyr), which is consistent with our result. At larger radii, they only use one old stellar population to infer the presence of a negative radial gradient in metallicity, as well as the stellar age of 12 Gyr, a trend we also see from the broad band fits. They then compare their Lick index analysis results with the u-g color of the SDSS data and conclude that they are consistent.
The non-detection of the intermediate-age stellar population in bulge regions beyond the central 5″ in previous works is likely due to their detection limit. According to the Padova stellar evolutionary tracks (Bressan et al., 2012), for a stellar population with Z⊙ and age=0.7 1 Gyr, stars with masses 3 M⊙ have died, while stars with 2.12.4 M⊙ should have just left the main-sequence. The F275W and F336W magnitudes of these latter stars (25 mag) are still fainter than the 90% completeness limit of the PHAT survey in the UV band (24.5 at F275W and F336W, Rosenfield et al. 2012). Their age can also explain why they are not detected in the study by Saglia et al. (2010). In the Lick index method, the H 4861 Å absorption line is a critical age discriminator, because it is strong in A-type stars of age around few hundred years. Under-subtracting the H emission line from the nuclear gas spiral surrounding M31* (Li, Wang & Wakker, 2009) may have led to an overestimate of the stellar age based on the Lick index method, although Saglia et al. (2010) mention that they estimate the properties of the underlying stellar population and emission lines, simultaneously. Because of the strong H absorption line, the existence of 300600 Myr old stars near M31* is well recognized. Away from M31*, the age of the intermediate-age stellar population detected here is large enough that the corresponding decrease in the equivalent width of the H line makes it hard to detect the population in the integrated spectrum, which is dominated by the old stellar population. In §5.1, we have shown that without the three UV bands, the observed SED could indeed be fitted reasonably well with a single stellar population, reaching the same results as those of Saglia et al. (2010). Therefore, including the UV bands into the SED fitting is critical to the identification of the intermediate-age stellar population. As a result, we are more sensitive to this population than any previous study.
6.3 The Building History of the M31 Bulge
The existence of metal-rich intermediate-age stars in the M31 inner bulge is not a unique phenomenon. Bensby et al. (2013) present a study of the high-resolution spectra of 58 dwarfs and supergiants in the Galactic bulge. Metal-poor stars are shown to have relatively old ages (1012 Gyr), whereas metal-rich ones ([Fe/H]-0.1) have a wide range of ages from 2 to 12 Gyr and at least 5% of them are younger than 5 Gyr. Based on a study of eight nearby spiral galaxies, MacArthur et al. (2009) find positive radial gradients of luminosity-weight age, which indicate the existence of young stellar populations in the galactic nuclei. They suggest that relatively young ( 1 Gyr) stellar populations contribute as much as 70% of the optical emission from the galatic bulges, although their mass contribution are small, 20%.
The radial gradients in the age and metallicity of stellar populations provide insights into not only their origins, but the formation history of the M31 bulge as well. The stellar bulges of spiral galaxies may be classified into three types: 1) ‘classical’, 2) ‘disk-like’ and 3) boxy/peanut-shaped (Kormendy & Kennicutt, 2004; Athanassoula, 2005). Classical bulges have Sèrsic index 2 and have properties similar to elliptical galaxies. They also fall into the fundamental plane of elliptical galaxies and are supported primarily by random motion (Kormendy & Kennicutt, 2004). Such spheroids are suggested to be constructed through monolithic collapses of primordial gas clouds and/or major mergers of galaxies (MacArthur et al., 2009, and reference therein). In the monolithic collapse scenario, inner parts of spheroids experience an intense star formation in the early Universe over a short time interval. Heavy elements released by this activity are locked in the galactic nucleus, because of its deep potential well. As a result, stars formed in subsequent star formation tend to be metal-rich. Meanwhile, metal-poor intergalactic gas could keep falling into the galaxy, which may trigger new star formation in outskirts and produce younger and metal-poorer stars. Therefore, this scenario predicts negative age and metallicity gradients. After a major merger, galactic disk could be disturbed, or even destroyed to form galactic bulge. The age and metallicity distributions in the new spheroid are smoothed and become flat. ‘Disk-like’ bulges with Sèrsic index 2 are offen identified as ‘pseudobulges’. Boxy/peanut bulges are generally interpreted as edge-on barred pseudobulges (Bureau & Athanassoula, 2005). A pseudobulge is likely built through ‘secular evolution’ (Kormendy & Kennicutt, 2004). The disk instability introduces a rotating bar, which buckles and heats the disk vertically to increase its scale height. The bar can also transport the disk material into the inner region, leading to star formation and thus the growth of the bulge. This kind of bulge still keeps the memory of the galactic disk, so that they are primarily rotationally supported. Because it takes a long time for materials to spiral into the inner parts of such a bulge, a negative age gradient and a uniform metallicity are expected.
The M31 bulge is classified as a classical bulge, because of its Sèrsic index, 2.2 (Courteau et al., 2011), although this value is close to the boundary to a pseudobulge (Fisher & Drory, 2010) and Beaton et al. (2007) finds boxy structures. The large velocity dispersion, 160 km/s (Saglia et al., 2010), also supports that M31 has a classical bulge. While the monolithic collapse scenario could explain the age and metallicity gradients of the old stellar population found in §5.2 (see also Saglia et al., 2010), the supersolar metallicity indicates subsequent major merger(s). But the presence of the dynamic fragile galactic disk indicates that no recent major merger has happened in M31. Therefore, the high stellar metallicity and its negative gradient in the M31 bulge suggest that the early M31 experienced several major mergers, which triggered the formation of stars with enhanced metallicity. After that, accreted intergalactic materials have reduced the metallicity of stars in the outer parts of the bulge.
On the other hand, the intermediate-age stars may be due to secular evolution, instead of mergers. M31 has likely experienced minor mergers recently, with its satellite galaxies, as indicated in stellar number density maps produced by wide-field imaging surveys (Ibata et al., 2014, and references therein). A potential head-on collision between M31 and M32 about 200 Myr ago has also been proposed to explain the young stars in the central 5″ (e.g. Saglia et al., 2010; Lauer et al., 2012), as well as the 10 kpc star forming ring (Block et al., 2006); although recently Dierickx et al. (2014) suggest that head-on collision is not required to produce the ring and Lewis et al. (2015) find that the 10 kpc ring is long-lived and stationary, which cannot be due to a purely collisional origin. Block et al. (2006) suggest that the M32 just passed the inner bulge of M31 recently, which triggered the star formation in its nucleus. This scenario predicts that the age of the intermediate-age stellar population should be constant in the inner bulge of M31, which is inconsistent with the positive radial age gradient. Therefore, although we cannot exclude the possibility that this fly-by interaction produced the young star cluster in the central 5″, it cannot explain the intermediate-age stars further beyond. Most likely, the intermediate-age stellar population was formed in the secular evolution scenario. The presence of a bar in the M31 bulge is reported by Beaton et al. (2007). Courteau et al. (2011) also suggest that the ratio of the bulge-to-disk scale lengths of M31 is 0.2, a prediction of secular evolution models (Courteau, 1996), which also naturally explains the age gradient and roughly constant metallicity of the intermediate-age stellar population. If we assume a 5% star formation efficiency (Evans et al., 2009) and that disk gas was smoothly transported into the bulge during the last 1 Gyr, an infall rate, 3.4 M⊙/yr, is expected. This value falls within within the range predicted by the numerical simulations of the evolution of the galactic disks (0.1-10 M⊙/yr, Minchev et al., 2012).
The pseudobulge and classical bulge could co-exist (Erwin et al., 2015). Fisher & Drory (2010) find that there are a group of pseudobulges (defined by their low Sèrsic index and morphology) with very low specific star formation rates, just like the classical bulges. Adding a pseudobulge into the classical bulge could also efficiently reduce its Sèrsic index (Fisher & Drory, 2010). This may explain the low Sèrsic index of the M31 bulge, compared to the other classical bulges.
Apparently, the suggested secular evolution contributes little to the overall mass of the M31 bulge. Assuming secular evolution is responsible for the entire intermediate-age stellar population detected, the mass fraction of intermediate-age stars derived from our SED fitting is indeed small, 1%. This is consistent with the result in MacArthur et al. (2009), which suggest that bulge growth via secular processes generally contributes little to the stellar mass budget in their eight nearby spiral galaxies. Therefore, the M31 bulge is similar to the MW bulge, in which the dominant majority of old stars is only contaminated by relatively few young stars.
7 Summary
We have studied stellar populations in the inner bulge of M31 with multi-wavelength observations taken with HST WFC3/ACS. The broad wavelength range coverage of our data set from near-ultraviolet to near-infrared enables us to decompose multiple stellar populations in regions beyond the central 5″. We summarize our results below:
-
•
In the near-ultraviolet to near-infrared range, the light becomes increasingly blue with the galactocentric distance in the bulge. This trend is in sharp contrast to the positive radial gradient seen in the GALEX FUVNUV color. The FUVF475W radial color gradient changes at about 50″ major-axis radius. These trends cannot be explained by the possible presence of old post-EHB stars with a negative radial metallicity gradient.
-
•
We have found that in addition to the known old stellar population, an intermediate-age stellar population is most likely needed to explain the observed SED and its radial change across the inner bulge, especially in the three UV bands. Although the mass fraction of this new population is low (0.22%), its emission is significant (e.g., 40% in the F275W band).
-
•
The mass surface density of intermediate-age stars decreases with the radius. This trend rules out the possibility that they represent the projected galactic disk contribution of M31. We find that this contribution accounts for at most 50% of the band intensity in the central 100″ region. Meanwhile, the metal-poor M31 halo stars can only contribute at most extra 3% the band intensity in the same region.
-
•
The age (300 Myr1 Gyr) and mass fraction of the intermediate-age stellar population increase with the galactocentric distance from the center of M31, while the metallicity is roughly constant (Z⊙).
-
•
Because the intermediate-age stars are older than the young star cluster (age 200 Myr) in the central 5″, their formation is unlikely due to the possible head-on collision between M31 and M32. We propose that the population represents the secular evolution of the inner bulge via star formation from the inflow gas, probably induced by the presence of the bar of the galaxy. This secular evolution could also explain the positive radial age gradient of the intermediate-age stellar population.
-
•
The intermediate-age population contributes only 1% of the stellar mass in the central 180″, indicating that secular growth plays an insignificant role in building the M31 bulge.
-
•
The radial age and metallicity profiles of the old stellar population are consistent with those of Saglia et al. (2010); its age does not show any significant variation, while its metallicity changes from 2Z⊙ to Z⊙ in the field considered here. This suggests that major mergers taking place in the early Universe produced the majority of old metal-rich stars. Subsequent star formation from the accretion of metal-poor materials may have resulted in the negative metallicity gradient observed.
Acknowledgments
This article is based on observations made with the NASA/ESA Hubble Space Telescope and obtained from the data archive at the Space Telescope Science Institute, which is operated by the Association of Universities for Research in Astronomy, Inc. under NASA contract NAS 5-26555. We are grateful to Philip Rosenfield, Luciana Bianchi, Antonela Monachesi, Morgan Fouesneau for valuable comments and discussion. This work is supported by NASA grant GO-12055 provided by the Space Telescope Science Institute, which is operated by the Association of Universities for Research in Astronomy, Inc., under NASA contract NAS 5-26555. H. D. acknowledges the support and hospitality of the Key Laboratory of Modern Astronomy and Astrophysics at Nanjing University during his visit, and would like to thank Robert W. O’Connell and Daniela Calzetti for providing the the spectrum used in Figure 1. Z.L. acknowledges support from the Recruitment Program of Global Youth Experts and the National Natural Science Foundation of China (grant 11133001).
References
- Athanassoula (2005) Athanassoula, E. 2005, MNRAS, 358, 1477
- Beaton et al. (2007) Beaton, R. L., Majewski, S. R., Guhathakurta, P., et al. 2007, ApJ, 658, L91
- Bender et al. (2005) Bender, R., Kormendy, J., Bower, G., et al. 2005, ApJ, 631, 280
- Bensby et al. (2013) Bensby, T., Yee, J. C., Feltzing, S., et al. 2013, A&A, 549, A147
- Block et al. (2006) Block, D. L., Bournaud, F., Combes, F., et al. 2006, Nature, 443, 832
- Bressan et al. (2012) Bressan, A., Marigo, P., Girardi, L., et al. 2012, MNRAS, 427, 127
- Brown et al. (1998) Brown, T. M., Ferguson, H. C., Stanford, S. A., & Deharveng, J.-M. 1998, ApJ, 504, 113
- Bureau & Athanassoula (2005) Bureau, M., & Athanassoula, E. 2005, ApJ, 626, 159
- Crane et al. (1992) Crane, P. C., Dickel, J. R., & Cowan, J. J. 1992, ApJ, 390, L9
- Conroy & van Dokkum (2012) Conroy, C., & van Dokkum, P. G. 2012, ApJ, 760, 71
- Courteau (1996) Courteau, S. 1996, ApJS, 103, 363
- Courteau et al. (2011) Courteau, S., Widrow, L. M., McDonald, M., et al. 2011, ApJ, 739, 20
- Dalcanton et al. (2012) Dalcanton, J. J., Williams, B. F., Lang, D., et al. 2012, ApJS, 200, 18
- Dierickx et al. (2014) Dierickx, M., Blecha, L., & Loeb, A. 2014, ApJ, 788, L38
- Dong et al. (2011) Dong, H., Wang, Q. D., Cotera, A., et al. 2011, MNRAS, 417, 114
- Dong et al. (2014) Dong, H., Li, Z., Wang, Q. D., et al. 2014, ApJ, 785, 136
- Dorman et al. (2013) Dorman, C. E., Widrow, L. M., Guhathakurta, P., et al. 2013, ApJ, 779, 103
- Dressler & Richstone (1988) Dressler, A., & Richstone, D. O. 1988, ApJ, 324, 701
- Erwin et al. (2015) Erwin, P., Saglia, R. P., Fabricius, M., et al. 2015, MNRAS, 446, 4039
- Evans et al. (2009) Evans, N. J., II, Dunham, M. M., Jørgensen, J. K., et al. 2009, ApJS, 181, 321
- Fisher & Drory (2010) Fisher, D. B., & Drory, N. 2010, ApJ, 716, 942
- Fitzpatrick (1999) Fitzpatrick, E. L. 1999, PASP, 111, 63
- Garcia et al. (2010) Garcia, M. R., Hextall, R., Baganoff, F. K., et al. 2010, ApJ, 710, 755
- Ibata et al. (2014) Ibata, R. A., Lewis, G. F., McConnachie, A. W., et al. 2014, ApJ, 780, 128
- Kalirai et al. (2006) Kalirai, J. S., Gilbert, K. M., Guhathakurta, P., et al. 2006, ApJ, 648, 389
- Kaviraj et al. (2007) Kaviraj, S., Rey, S.-C., Rich, R. M., Yoon, S.-J., & Yi, S. K. 2007, MNRAS, 381, L74
- King et al. (1995) King, I. R., Stanford, S. A., & Crane, P. 1995, AJ, 109, 164
- Kormendy (1988) Kormendy, J. 1988, ApJ, 325, 128
- Kormendy & Bender (1999) Kormendy, J., & Bender, R. 1999, ApJ, 522, 772
- Kormendy & Kennicutt (2004) Kormendy, J., & Kennicutt, R. C., Jr. 2004, ARA&A, 42, 603
- Kroupa (2002) Kroupa, P. 2002, Modes of Star Formation and the Origin of Field Populations, 285, 86
- Lauer et al. (1998) Lauer, T. R., Faber, S. M., Ajhar, E. A., Grillmair, C. J., & Scowen, P. A. 1998, AJ, 116, 2263
- Lauer et al. (2012) Lauer, T. R., Bender, R., Kormendy, J., Rosenfield, P., & Green, R. F. 2012, ApJ, 745, 121
- Lewis et al. (2015) Lewis, A. R., Dolphin, A. E., Dalcanton, J. J., et al. 2015, arXiv:1504.03338
- Li, Wang & Wakker (2009) Li, Z., Wang, Q. D., & Wakker, B. P. 2009, MNRAS, 397, 148
- Li et al. (2011) Li, Z., Garcia, M. R., Forman, W. R., et al. 2011, ApJ, 728, L10
- MacArthur et al. (2009) MacArthur, L. A., González, J. J., & Courteau, S. 2009, MNRAS, 395, 28
- Markwardt (2009) Markwardt, C. B., 2009, ASPC, 411, 251M
- Minchev et al. (2012) Minchev, I., Famaey, B., Quillen, A. C., et al. 2012, A&A, 548, AA126
- McConnachie et al. (2005) McConnachie, A. W., Irwin, M. J., Ferguson, A. M. N., et al. 2005, MNRAS, 356, 979
- Morris & Serabyn (1996) Morris, M., & Serabyn, E. 1996, ARA&A, 34, 645
- Melchior & Combes (2013) Melchior, A.-L., & Combes, F. 2013, A&A, 549, A27
- O’Connell (1999) O’Connell, R. W. 1999, ARA&A, 37, 603
- Olsen et al. (2006) Olsen, K. A. G., Blum, R. D., Stephens, A. W., et al. 2006, AJ, 132, 271
- Rosenfield et al. (2012) Rosenfield, P., Johnson, L. C., Girardi, L., et al. 2012, ApJ, 755, 131
- Saglia et al. (2010) Saglia, R. P., Fabricius, M., Bender, R., et al. 2010, A&A, 509, A61
- Sarajedini & Jablonka (2005) Sarajedini, A., & Jablonka, P. 2005, AJ, 130, 1627
- Schlafly & Finkbeiner (2011) Schlafly, E. F., & Finkbeiner, D. P. 2011, ApJ, 737, 103
- Skrutskie et al. (2006) Skrutskie, M. F., Cutri, R. M., Stiening, R., Weinberg, M. D., Schneider, S., Carpenter, J. M., Beichman, C., Capps, R., Chester, T., Elias, J. et al., 2006, AJ, 131, 1163S
- Stephens et al. (2003) Stephens, A. W., Frogel, J. A., DePoy, D. L., et al. 2003, AJ, 125, 2473
- Thilker et al. (2005) Thilker, D. A., Hoopes, C. G., Bianchi, L., et al. 2005, ApJ, 619, L67
- Vázquez & Leitherer (2005) Vázquez, G. A., & Leitherer, C. 2005, ApJ, 621, 695
- Williams et al. (2014) Williams, B. F., Lang, D., Dalcanton, J. J., et al. 2014, ApJS, 215, 9
- Williams et al. (2005) Williams, B. F., Garcia, M. R., Kong, A. K. H., Primini, F. A., & Murray, S. S. 2005, ApJ, 620, 723

.


| Pivot | Program | Number of | Exposure | PHOTFLAM | Systematic error | Median of | ||||
|---|---|---|---|---|---|---|---|---|---|---|
| Filter | Detector | () | ID | dithered exposures | time (s) | ergs | of PHOTFLAMa | /I (%)b | Milky Wayc | M31 bulged |
| F275W | WFC3 /UVIS | 2704 | 12058 | 2 | 925 | 3.3010e-18 | 3.5% | 13.1 | 1.94 | 2.80 |
| F336W | WFC3 /UVIS | 3355 | 12058 | 2 | 1250 | 1.3129e-18 | 2% | 3.7 | 1.64 | 1.92 |
| F390M | WFC3 /UVIS | 3897 | 12174 | 3 | 2700 | 2.5171e-18 | 2% | 3.1 | 1.47 | 1.58 |
| F435W | ACS/WFC | 4319 | 10006 | 4 | 2200 | |||||
| F435W | ACS/WFC | 4319 | 10760 | 8 | 4360 | 3.1840e-19 | 2% | 3.6 | 1.31 | 1.37 |
| F435W | ACS/WFC | 4319 | 11833 | 8 | 4360 | |||||
| F475W | ACS/WFC | 4747 | 12058 | 5 | 1900 | 1.8210e-19 | 2% | 4.1 | 1.18 | 1.21 |
| F547M | WFC3 /UVIS | 5447 | 12174 | 3 | 2700 | 4.6321e-19 | 2% | 4.1 | 1.0 | 1.0 |
| F665N | WFC3 /UVIS | 6656 | 12174 | 3 | 2700 | 1.9943e-18 | 2% | 5.0 | 0.75 | 0.73 |
| F814W | ACS/WFC | 8057 | 12058 | 4 | 1715 | 7.0332e-20 | 2% | 7.8 | 0.55 | 0.61 |
| F110W | WFC3 /IR | 11534 | 12058 | 1 | 699 | 1.5274e-20 | 2% | 12.7 | 0.31 | 0.46 |
| F160W | WFC3 /IR | 15369 | 12058 | 4 | 1600 | 1.9276e-20 | 2% | 14.7 | 0.19 | 0.43 |
Note. — a) The ‘PHOTFLAM’ information are from: http://www.stsci.edu/hst/wfc3/phot_zp_lbn (WFC3) and http://www.stsci.edu/hst/acs/analysis/zeropoints/#tablestart (ACS). b) and ‘I’ are the uncertainty and intensity of each pixel. c) The relative extinction for the MW-type dust. d) The average relative extinction of five dusty clumps in the M31 bulge, derived by Dong et al. (2014).
| Major-axis | Mass fraction of the | Reduced | ||||||
|---|---|---|---|---|---|---|---|---|
| radius(″) | (Gyr) | () | () | (Myr) | () | () | young population (%) | |
| 0-5 | 2.74 | |||||||
| 5-10 | 1.53 | |||||||
| 10-15 | 1.38 | |||||||
| 15-20 | 1.36 | |||||||
| 20-25 | 1.33 | |||||||
| 25-30 | 1.52 | |||||||
| 30-35 | 1.68 | |||||||
| 35-40 | 1.25 | |||||||
| 40-45 | 1.22 | |||||||
| 45-50 | 1.17 | |||||||
| 50-55 | 1.13 | |||||||
| 55-60 | 1.16 | |||||||
| 60-65 | 1.30 | |||||||
| 65-70 | 1.38 | |||||||
| 70-75 | 1.47 | |||||||
| 75-80 | 1.43 | |||||||
| 80-85 | 1.63 | |||||||
| 85-90 | 1.72 | |||||||
| 90-95 | 1.82 | |||||||
| 95-100 | 1.97 | |||||||
| 100-105 | 11.8 | 1.10 | 1.38 | |||||
| 105-110 | 11.8 | 1.10 | 1.52 | |||||
| 110-115 | 11.8 | 1.10 | 1.45 | |||||
| 115-120 | 11.8 | 1.10 | 1.51 | |||||
| 120-125 | 11.8 | 1.10 | 1.68 | |||||
| 125-130 | 11.8 | 1.10 | 1.45 | |||||
| 130-135 | 11.8 | 1.10 | 1.37 | |||||
| 135-140 | 11.8 | 1.10 | 1.30 | |||||
| 140-145 | 11.8 | 1.10 | 1.27 | |||||
| 145-150 | 11.8 | 1.10 | 1.19 | |||||
| 150-155 | 11.8 | 1.10 | 1.14 | |||||
| 155-160 | 11.8 | 1.10 | 1.03 | |||||
| 160-165 | 11.8 | 1.10 | 0.98 | |||||
| 165-170 | 11.8 | 1.10 | 0.97 | |||||
| 170-175 | 11.8 | 1.10 | 0.94 | |||||
| 175-180 | 11.8 | 1.10 | 0.92 |
Note. — The superscript and subscript represent the 68% confidence range. Beyond the 100″, there are no F390M, F547M and F665N observations. In order to have enough freedom for the least fitting, we freeze the age and metallicity of the old stellar population to the values at the annulus 95″-100″.