From Radio to TeV: The surprising Spectral Energy Distribution of AP Librae
Abstract
Following the discovery of high-energy (HE; ) and very-high-energy (VHE; ) -ray emission from the low-frequency-peaked BL Lac (LBL) object AP Librae, its electromagnetic spectrum is studied over 60 octaves in energy. Contemporaneous data in radio, optical and UV together with the (non simultaneous) -ray data are used to construct the most precise spectral energy distribution of this source. The data have been found to be modeled with difficulties with single zone homogeneous leptonic synchrotron self-Compton (SSC) radiative scenarios due to the unprecedented width of the high-energy component when compared to the lower-energy component. The two other LBL objects also detected at VHE appear to have similar modeling difficulties. Nevertheless, VHE rays produced in the extended jet could account for the VHE flux observed by H.E.S.S.
keywords:
gamma rays: observations – Galaxies : active – Galaxies : jets – BL Lacertae objects: individual objects: AP Librae1 Introduction
Blazars are among the most energetic objects in the Universe that exhibit non-thermal electromagnetic spectra from radio up to very-high-energy (VHE, E100 GeV) -rays, with a two-component spectral energy distribution (SED) structure in a representation. Multi-wavelength data are of paramount importance to understand the mechanisms at play in the jet.
Blazars are divided into two classes: flat spectrum radio quasars (FSRQs) and BL Lacertae (BL Lac) objects, the latter being sub-divided into high-frequency-peaked BL Lac (HBL) and low-frequency-peaked BL Lac (LBL). The distinction between HBL and LBL classes is based on the low-energy peak position (Padovani & Giommi, 1995). HBL objects present a peak in the UV or X-ray range while the peak of LBL objects is located at lower energies (i.e., in optical wavelengths).
So far, the vast majority of BL Lac objects detected in VHE belong to the HBL sub-class111To keep track of the number of detected object, an up-to-date VHE -ray catalogue can be found in the TeVCat http://tevcat.uchicago.edu. The SEDs of HBL objects are often successfully modeled with a synchrotron self-Compton (SSC) model, in which the low-energy emission is produced by synchrotron radiation of relativistic electrons, and the high-energy component by inverse Compton scattering off the same synchrotron photons. HBL are the dominant class of extragalactic objects detected by ground-based Atmospheric Čerenkov Telescopes (ACTs) in the TeV -ray regime.
Only a few TeV emitters belong to the LBL sub-class and, among them, AP Librae (, Jones et al., 2009) was recently detected by the H.E.S.S. collaboration (Abramowski et al., 2015) with a flux of above 130 GeV and a photon index matching well the spectrum measured by the Fermi Large Area telescope (LAT) in the high energy (HE, 100 MeVE300 GeV) range. Remarkably, the spectral break between the HE and VHE ranges is the smallest ever measured for an LBL object but cannot be explained by extragalactic background light (EBL) attenuation only (Sanchez et al., 2013). In this work, VHE and HE data have been extracted from Abramowski et al. (2015)
After the announcement of this detection by the H.E.S.S. collaboration (Hofmann, 2010), Swift and RXTE data were taken creating contemporaneous spectra in X-ray and UV bands. Analysis and results are presented in sections §2.1 and §2.3. Archival observation by Chandra (§2.2) have been analyzed in this work, revealing the first X-ray extended jet for a VHE blazar. At longer wavelengths, AP Librae is one of the targets of different monitoring programs such as SMARTS (§2.3) and the MOJAVE program (§2.4) which provide long-term optical and VLBA measurements. The VHE detection, together with lower energy-data presented in this paper, enable to draw the first complete SED of this source and to probe mechanisms at play in LBL objects. The broadband SED is then discussed in the framework of different emission models in §3 .
Throughout this paper a CDM cosmology with H km s-1 Mpc-1, and is assumed, resulting in a luminosity distance for AP Librae of D Mpc and a linear scale of 0.947 kpc per arcsecond (Wright, 2006).
2 Multi-wavelength Observations
2.1 Swift-XRT and RXTE-PCA observations
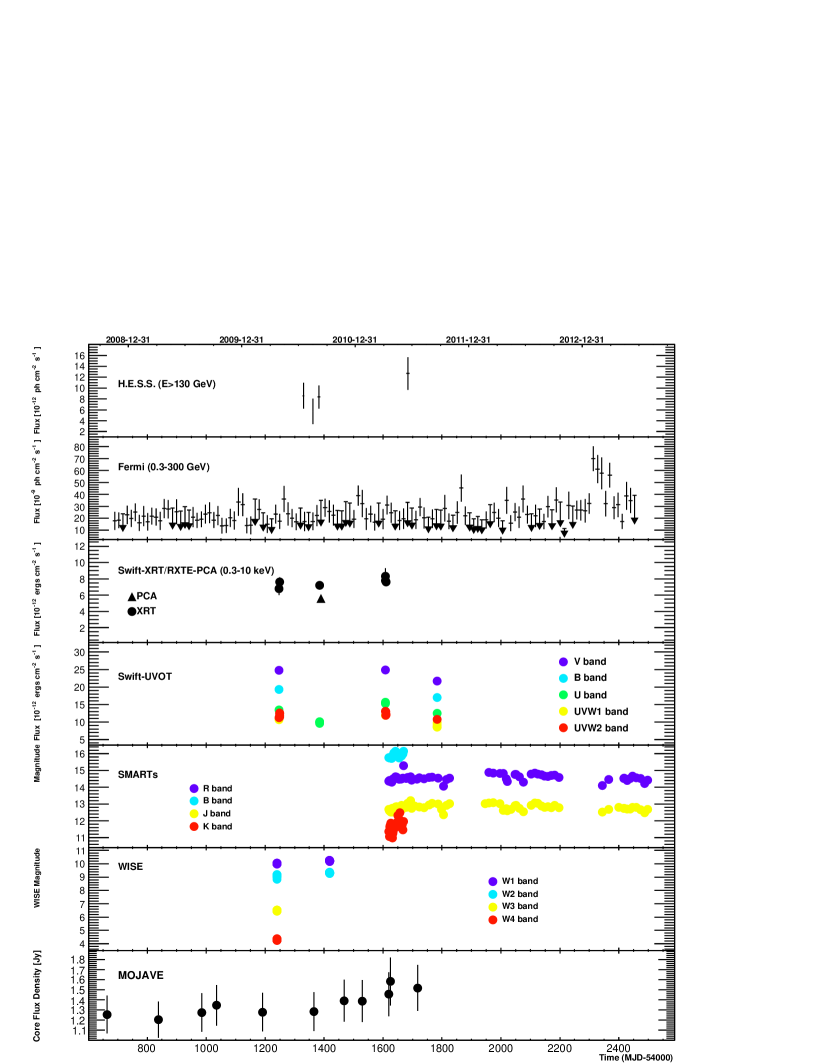
X-ray observations of AP Librae during the period of interest were retrieved using the HEASARC archive. Four consecutive daily observations (ObsID 95141) of each were carried out between 10–14 July 2010 with RXTE (Jahoda et al., 1996), with a total exposure of . The STANDARD2 RXTE-PCA data were extracted using the ftools in the HEASOFT 6.16 software package provided by NASA/GSFC and filtered using the RXTE Guest Observer Facility recommended criteria. Only signals from the top layer (X1L and X1R) of Proportional Counter Unit 2 (PCU2) were used to extract spectra in the range, using the faint-background model. The obtained daily light curve has an average rate of , a variance of compatible with its expected variance of if the source were constant, and a chi-square probability of constancy of , hence no variability is present over the span of 4 days.
During the period of interest, seven observations were carried out by the Swift mission (Burrows et al., 2005), between 20 February 2010 and 16 August 2011 (ObsID 36341005 to 36341011), of which one observation was carried out on 7 July 2010, near the RXTE observation. However, the short observation in ObsID 36341009 was skipped. The photon-counting (PC) mode data are processed with the standard xrtpipeline tool (HEASOFT 6.16), with the source and background-extraction regions defined as a 20-pixel (∼4.7 arcsec) and a 40-pixel radius circle respectively, the latter being centered nearby the former without overlapping. All exposures show a source with a stable average count rate of . Also the large XRT-PC light curve shows the source with an average count rate of and an r.m.s. of for which no variability could be found with a confidence level upper limit on the fractional variance (as defined in Vaughan et al. 2003) of 0.95. Using this count rate in WebPIMMS from HEASARC, a RXTE-PCA count rate of is predicted, compatible with the value actually observed of hinting at the fact that the source was probably in the same state during observations of both observatories. Given the low count rate, no pile-up is expected in PC mode, which is confirmed by the acceptable fit of a King profile to the PSF of all observations.
Spectral fitting of all ObsIDs was performed with PyXspec v1.0.4 (Arnaud, 1996), using a response matrix for the combined PCA data set generated by the ftool pcarsp v11.7.1, and dedicated Ancillary Response Functions (ARFs) for all XRT data sets generated by xrtmkarf (along with the latest spectral redistribution matrices swxpc0to12s6_20110101v014 from CALDB). Spectra from all ObsIDs were rebinned to have at least 20 counts per bin using grppha, channels 0 to 29 were ignored in the XRT-PC data, and only the 3–50 range is used in the PCA data. All data sets are fit to a power-law model , where is the normalization factor at a chosen reference energy keV and the photon index. Using the Leiden/Argentine/Bonn (LAB) Survey of Galactic HI (Kalberla et al., 2005) weighted average hydrogen column density of , good fits are obtained for the power-law function () with a photon index of on average. All XRT observations were also summed, a new exposure file built with ximage, and a new ARF for the summed spectrum. This latter spectrum extends up to . Another spectrum was derived this time limited to 1 count/bin, to allow an extension to higher energies, and was fitted using statistic cstat required in the case of Poisson data. The fit parameters are entirely compatible with those obtained using statistics, but the spectrum extends up to . All fit parameters, along with the unabsorbed 0.3–10 flux (retrieved for each flux using cflux), are shown in Table 1 and the light curve is shown on Figure 1.
| ObsID | Time | ||||
|---|---|---|---|---|---|
| MJD-5500 | ph | % | |||
| 00036341005 | 247.2-247.2 | 18 | |||
| 00036341006 | 249.5-249.7 | 70 | |||
| 00036341007 | 384.7-384.8 | 31 | |||
| 00036341008 | 608.1-608.2 | 35 | |||
| 00036341010 | 608.0-608.0 | 94 | |||
| 00036341011 | 609.8-609.9 | 60 | |||
| sum all above | |||||
| 95141 | 387.9-391.9 | 91 |
Systematic errors on the Swift-XRT spectra and absolute flux are less than and , respectively (Godet et al., 2009), while PCA-XRT cross-calibration details can be found in Tsujimoto et al. (2011).
2.2 Chandra observations
AP Librae was observed by Chandra on July 4, 2003 with a total exposure time of 14 ks. The Chandra data reprocessing and reduction were performed following the standard procedures described in the Chandra Interactive Analysis of Observations222http://cxc.harvard.edu/ciao/index.html (CIAO) threads, using CIAO v4.3 and the Chandra Calibration Database (CALDB) version 4.4.6. The data reveal the presence of an extended jet on arcsecond scales, which is unique amongst the VHE emitting BL Lac class so far. A radio VLA observation was used to align the nuclear X-ray emission with the radio core. A registered, exposure-corrected and adaptively smoothed image of AP Librae in units of , with radio contours overlaid is shown in Figure 2. In order to assess to what degree the RXTE and Swift spectra need corrections for non-core emission, the spectrum of the jet is estimated, with the caveat that this observation is not contemporaneous with the data set presented here.
A spectrum of the jet was taken from a polygon shaped region which avoids the emission of the core and the ACIS readout streak. A core spectrum comes from a 2 arcsecond region centered on the core. A background spectrum was extracted from four circular regions placed to the north and south of the source. The jet and background regions are marked in Figure 2. In order to estimate the effects of pile-up in the core and jet region, the method described by Harris et al. (2011) was used. In the jet region no pile-up was found while it was necessary to correct for mild pile-up in the core.
The spectra of the core and the jet contain and background subtracted counts, respectively. Both spectra were binned to a minimum of 20 counts per bin, and fit in the 0.5–7.0 keV energy band using an absorbed power-law model in XSPEC with the same as in §2.1. The fit of the jet spectrum yields a photon index and a 2–10 keV unabsorbed flux of erg cm-2 s-1, with a for 7 dof, or more than an order of magnitude below the value measured for the source in §2.1 based on the Swift and RXTE data, which can hence safely be used as the X-ray flux of the core in AP Librae. The jet spectrum is comparable with the spectra of large-scale quasar jets observed by Chandra, which may also be sources of relatively intense -ray emission (see the discussion in Sambruna et al., 2004; Finke et al., 2008). Such a scenario is not formally excluded here since an extrapolation of the jet spectrum could connect within the experimental errors with either the HE or VHE fluxes reported here. Assuming no pile-up, the best power-law fit to the core spectrum yields a photon index of and a 2–10 keV unabsorbed flux of erg cm-2 s-1. Using the pileup model in XSPEC, a pile-up corrected spectrum appears however to be softer with and erg cm-2 s-1, with a for 129 dof. The pile-up model of Davis (2001) was used in the fit of the core spectrum, and the value of the pile-up parameter indicates that the fit is indeed affected by this. However, it was not possible to obtain an error estimate on , and hence we also do not have an error estimate on the unabsorbed and pile-up corrected flux. Due to pile-up effects, the fit results for the core should be treated with caution. This extended X-ray jet was first reported by Kaufmann et al. (2013). Our results differ slightly, probably because we used different extraction and background regions, and Kaufmann et al. did not take into account the above-mentioned ACIS readout streak.

2.3 Swift-UVOT and SMARTS observations
All of the available archival data taken on AP Librae with the ultra-violet and optical telescope (UVOT) on the Swift satellite were analyzed. This comprised 35 exposures taken between April 2007 and July 2010, 13 of which occurred during the time frame with which this paper is concerned (see Figure 1). After extracting the source counts from an aperture of 5.0″radius around AP Librae and the background counts from four neighboring regions, each of the same size, the magnitudes were computed using the uvotsource tool with calibrations from Breeveld et al. (2011). These were converted to fluxes using the values from Poole et al. (2008) after correction for extinction following the procedure and Rv value of Roming et al. (2009). The values of and from Roming et al. (2009), computed following the procedure of Cardelli et al. (1989), were used. The value from Schlafly & Finkbeiner (2011), accessed through the NASA/IPAC Extragalactic Database, was used. Results are summarized in Table 2.
AP Librae was observed in context of the Yale Fermi/SMARTS project333http://www.astro.yale.edu/smarts/glast/pubs.html (Bonning et al., 2012). Observations were performed in the B, R, J and K bands between February 27, 2011 (MJD 55619) and March 3st, 2013 (MJD 56739) and shown on Figure 1. The number of observations and the mean magnitudes are given in Table 2 together with the corresponding fluxes. Magnitudes have been corrected for Galactic absorption using values from Schlafly & Finkbeiner (2011) and converted in flux units using the Bessell zero points (Bessell, 1990).
| Filter | Energy | magnitude | Flux | |
|---|---|---|---|---|
| [eV] | [] | |||
| SMARTS: | ||||
| K | 25 | 0.56 | 11.630.37 | 1.960.78 |
| J | 79 | 0.99 | 12.760.17 | 3.260.54 |
| R | 74 | 1.77 | 14.530.18 | 1.880.34 |
| B | 29 | 2.86 | 15.850.13 | 1.350.18 |
| Swift-UVOT: | ||||
| V | 3 | 2.30 | 15.18 0.04 | 2.43 0.10 |
| B | 3 | 2.86 | 15.94 0.04 | 1.69 0.06 |
| U | 7 | 3.54 | 15.68 0.04 | 0.96 0.03 |
| UVW1 | 6 | 4.72 | 15.88 0.05 | 0.63 0.03 |
| UVW2 | 10 | 6.12 | 16.12 0.05 | 0.57 0.02 |
| UVM2 | 3 | 5.57 | 16.09 0.06 | 0.55 0.03 |
The host galaxy of AP Librae is bright and therefore the contribution from starlight must be taken into account to estimate the non-thermal flux from the core in the near-infrared to UV band. The dereddened near-infrared and optical measurements of AP Librae reported in Figure 1 of Falomo et al. (1993), where the total emission was modeled with a giant elliptical galaxy template and a superposed non-thermal power-law continuum, are given for illustration in the composite SED of Figure 3. The synchrotron emission probably peaks in the optical- to near-IR range, since the spectral index for AP Librae in that range is . In Hyvönen et al. (2007), the fluxes in the B and U bands were calculated for the host galaxy and the core. The fractional contribution of the latter was 42% in the B band and 69% in the U band. At higher energies the emission from the core accounts for an even higher percentage. To take this result into account, the host galaxy template of Silva et al. (1998) has been used and with a normalization ajusted to fit the data.
2.4 MOJAVE
The parsec-scale structure of the radio jet of AP Librae has been monitored throughout the past decade as part of the MOJAVE program444http://www.physics.purdue.edu/astro/MOJAVE (Monitoring of Jets in Active galactic nuclei with VLBA Experiments) with the Very Long Baseline Array (VLBA) at a frequency of 15 GHz. The VLBA data have been calibrated and analyzed following the procedures described by Lister et al. (2009). The source shows a bright, continuous inner jet region with a bright jet core, i.e apparent jet base, extending towards the South. At a resolution of typically milli-arcsecond (mas), the core is not clearly separated from the inner jet. Elliptical Gaussian components were used to model the brightness distribution and to determine radio flux densities of different emission regions within the source. For the comparison with higher-energy multiwavelength data, we focused on the inner mas ( pc) region, which could typically be modeled with 2–3 Gaussian model components. We have used different models with circular and elliptical model components and tested the formal statistical model-fitting uncertainties of the total flux density, which turn out to be much smaller ( %) than the absolute calibration uncertainty, which can be conservatively estimated to be of the order of %.
The 16 MOJAVE observations from MJD 53853 to 55718 do not show sign of significante variability in the VLBI core region. Figure 3 shows the value of 1.48 Jy of the radio flux density, averaged over the full observations, from the inner 1.5 mas jet core.
3 Discussion
3.1 The radiative components
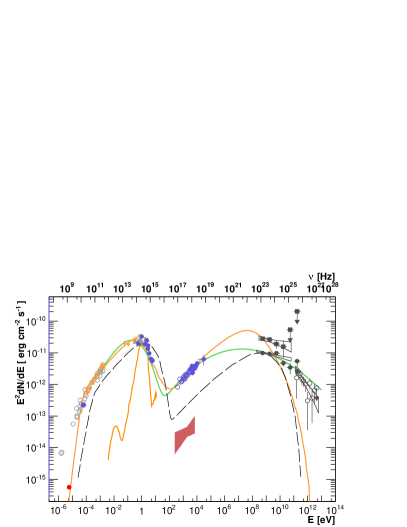
The composite SED of AP Librae is shown in Figure 3. Together with the MOJAVE, SMARTS, Chandra, Swift-UVOT, Swift-XRT, RXTE, Fermi-LAT and H.E.S.S. data analyzed in this work, archival data from NED are reported. In the 30–353 GHz band, the Planck measurements from the Early Release Compact Source Catalog (ERCSC, Planck Collaboration et al., 2011) are in good agreement with the archival data as are the Wide-field Infrared Survey Explorer (WISE, Wright et al., 2010) data in the bands 3.4, 4.6, 12, and 22 m.
An extrapolation of the hard X-ray to the optical-UV power-law spectrum reported here underestimates the simultaneous UVOT flux by at least 2 orders of magnitude, though the steeply falling UV spectrum possibly connects with the onset of the XRT spectrum. This indicates the presence of an inflection point in the SED widely attributed to a transition from synchrotron to IC dominated radiation. This feature shows that the Compton component of AP Librae is the broadest ever observed in any blazar, spanning more than 10 decades in energy from to . Indeed, only two other objects of the same class as AP Librae, and hence with broad Compton components, have been detected at VHE energies so far: BL Lacertae (), the first LBL object to be proved as being a VHE emitter (Albert et al., 2007), and S5 0716+714 () following an optical trigger (Anderhub et al., 2009). The observed VHE spectrum of the former is not as energetic as AP Librae, and the X-ray spectrum of the latter appears to still belong to the synchrotron component.
An empirical characterization of the two radiative components, through a third degree polynomial fit of each hump in representation (as in, e.g., Abdo et al. 2010), is used to estimate the synchrotron and IC peak energies. The values of the parameters obtained from a fit555The EBL absorption has been taken into account in the fit. are given in Table 3 and the results are represented in the composite SED of Figure 3. As mentioned above, the SMARTS and the Swift-UVOT measurements in the V, B and U were not used in the fit of the synchrotron peak as well as the data from Falomo et al. (1993). The position of the synchrotron peak is then estimated to be , which is compatible with the value of derived by Abdo et al. (2010) on a different data set. The same authors estimated for AP Librae in Table 13 based on a strong correlation of with the HE photon index , as expressed in their Equation 5666The quoted uncertainty, not given in their table, is derived from their estimation of an error of 0.7 associated with the estimation of the log of in Equation 5.. Using the photon index found by Abramowski et al. (2015), which is based on an order of magnitude larger data set, yields a lower but still compatible value of and this value was constrained to be below 1 GeV by fitting the HE-VHE data (Abramowski et al., 2015). The polynomial fit presented here yields a much lower value of , which can be attributed to use of the entire SED. This is the lowest IC component peak ever measured for a TeV-emitting blazar.
| Energy Range (eV) | ||||
|---|---|---|---|---|
| -10.79 | -0.52 | -0.41 | -0.048 | |
| -13.36 | 0.82 | -0.068 | -0.001 |
The third degree polynomial also provides a straightforward estimation of the curvatures and at the peak positions and , respectively, which pertain to the widths of each hump. Paggi et al. (2009) show that a relation is expected in a pure Thomson scattering regime, using a logparabolic parametrization of each of the two humps generated by a single zone homogeneous SSC model, while in the Klein-Nishina (KN) regime. The curvatures found here for AP Librae yield a surprising , emphasizing the broadness of the IC component compared to the synchrotron hump, which is hardly possible to reproduce with simple radiative models.
3.2 Radiative scenarios
In a one zone homogenous SSC framework, electrons produce synchrotron photons which are upscattered through the IC mechanism by the same electrons to generate the HE and VHE photons. If this upscattering occurs predominantly in the Thomson regime up to the peak energy, then it becomes possible to constrain the product of the magnetic field and the Doppler factor for a single zone homogenous SSC model (following Tavecchio et al. 1998, Equation 4):
| (1) |
where the peak energies are expressed in eV. Using the range for found previously and 17 MeV yields . The value of the break Lorentz factor of the underlying electron distribution can also be derived from the ratio of the peak emission energies as .
Assuming now that the observed synchrotron radiation does not exceed , (i.e. the lowest energy bin in the XRT spectrum), which is more likely to belong to the onset of the IC component, then this constrains the maximal Lorentz factor of the underlying electron population through the maximum synchrotron energy
where G is the critical magnetic field leading to
| (2) |
Using Equation 2 and Equation. 1 then yields , which is consistent with being a factor higher than as expected.
Supposing that electrons with an apparent energy of have sufficient energy to upscatter photons to at least the maximal observed Compton energy , then the Doppler factor is constrained to a reasonable value of . If the scattering of 0.1 keV photons occurs in the Thomson regime, the Doppler factor should be such that . Using the value for found above leads to an unusually high value of . If however the scattering occurs in the KN regime for these highest energy seed photons, then which, combined with the above constraint (Equation 2) on , then yields
| (3) |
from which follows, using the above constraint , a reasonable constraint of . In Appendix A, similar conclusions are drawn for an arbitrary type of seed photons.
Lister et al. (2013) measured an apparent superluminal motion 6.4c. This is compatible with for a viewing angle below degrees and with for 1.7 degrees.
3.3 Application of an SSC model to the SED
The time-averaged SED of AP Librae was modeled with a canonical one zone homogeneous SSC model (Band & Grindlay, 1985). A spherical region of size , with an electron distribution , moving with a bulk Doppler factor , is filled uniformly with a magnetic field . As in Tavecchio et al. (2010), is described by a broken power-law of index between and and between and . The electrons lose their energy by synchrotron emission, producing a field of photons which become the targets for the same electron population through the IC process. The KN effects are taken into account using the Jones kernel (Jones, 1968) to compute the IC cross-section.
A tentative model is shown in Figure 3, where the shape of the electron distribution (, and ) is constrained by the observed synchrotron component. The remaining parameters (, , , and the total number of electrons ) are adjusted to reproduce the onset of the Compton component in the X-rays. The obtained parameters and model curves, as given in Table 4 and Figure 3, respectively (together with the model parameters and curves derived by Tavecchio et al. (2010) for comparison) obey the constraints found in §3.2. Not surprisingly, the broad IC component of the SED is difficult to reconcile with the synchrotron distribution using such a simple model, for which strong indications were already presented in §3.1.
The SSC calculation reproduces well the lower energy part of the SED, up to the X-rays, but the spectral prediction in the Fermi-LAT energy range is much softer, as well as about one order of magnitude above the observed HE flux. The direct consequence of the broadness of the IC component is that the H.E.S.S. flux is largely underestimated. Directly linked to the electron distribution and to the well measured synchrotron component, this shape can only be affected by the KN effects, which tend to soften the spectrum leading inevitably to even larger disagreements.
| Model | S1 | S2 | ||||||
|---|---|---|---|---|---|---|---|---|
| [G] | [cm] | |||||||
| This work | 1.1 | 2 | 4.9 | 5.4 | 0.9 | 3.5 | 20 | |
| Tavecchio et al | 2.0 | 5 | 2 | 4.9 | 0.4 | 1.2 | 1 | 40 |
3.4 VHE Rays from the extended jet?
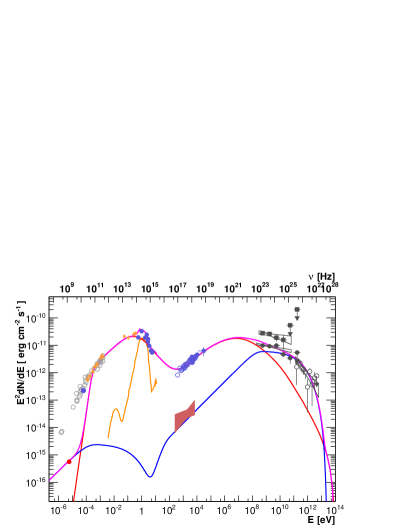
As seen in the previous sections, one-zone SSC models cannot reproduce the broadband SED of AP Librae. However, Böttcher, Dermer, & Finke (2008) proposed that the Compton-scattering of the cosmic microwave background (CMB) by electrons in an extended kpc-scale jet could make VHE -rays. This model was suggested to explain the hard VHE spectrum from 1ES 1101232 as observed by H.E.S.S. (Aharonian et al., 2006, 2007), when EBL attenuation was taken into account with the models available at the time. AP Librae has an extended kpc-scale jet resolved in radio (see Figures 3 and 4) and X-rays (see section 2.2), and it has long been thought that the Compton-scattering of CMB photons could produce the X-rays observed from these extended jets (e.g., Tavecchio et al., 2000; Celotti et al., 2001). Therefore, it seems natural to apply this model to AP Librae, to see if the extended jet emission could plausibly make up the VHE rays. Thus, the broadband SED of AP Librae has been modeled with a compact, synchrotron/SSC model based on Finke et al. (2008), and an additional component from the extended jet, emitting synchrotron and inverse Compton-scattering of CMB photons (hereafter ICCMB).
The result of this model is shown in Figure 4, with the model parameters in Table 5. The model parameters are fully described in Finke et al. (2008). The compact component can explain the radio, optical (not including emission that is clearly from the host galaxy), X-ray, and the lower-energy Fermi-LAT -ray data. The extended component can explain the extended radio and X-ray data, as well as the highest -ray emission detected by the LAT and H.E.S.S. A double-broken power-law was used to describe the electron distribution in the compact component, while only a single broken power-law was needed for the electron distribution in the extended component. Parameters in the compact component are broadly comparable to synchrotron/SSC modeling results for other BL Lac objects, including the jet power in electrons being several orders of magnitude greater than that in the magnetic field (e.g., Finke et al., 2008; Abdo et al., 2011a, b, d, c; Aliu et al., 2013, 2014a, 2014b). The extended jet is much closer to equipartition between electron and magnetic field density by design; a model out of equipartition would still be able to reproduce the data. These parameters are also close to previous results for modeling extended jets, although the magnetic field is a bit lower than usual (typically found ; e.g., Tavecchio et al., 2007). This may be because previous ICCMB models of extended jets are for FSRQs, rather than BL Lac objects. One hypothesis can be that the magnetic fields in extended jets of BL Lac objects are lower than those in the extended jets of FSRQs.
It should be noted that the ICCMB model for explaining the X-ray emission from extended jets is controversial. It could be that X-rays are instead produced by synchrotron emission from another population of electrons in the extended jet (e.g., Atoyan & Dermer, 2004; Hardcastle, 2006). In this alternative framework, HE and VHE emission is unlikely. Recently, Meyer & Georganopoulos (2014) used Fermi-LAT observations to rule out the ICCMB model for the X-ray emission from the extended jet in the FSRQ 3C 273.
| Parameter | Symbol | Compact component | Extended Jet |
| Bulk Lorentz Factor | 20 | 8 | |
| Doppler factor | 20 | 8 | |
| Magnetic Field [G] | 0.05 | ||
| Variability Timescale [s] | |||
| Comoving radius of blob [cm] | |||
| First Electron Spectral Index | 2.0 | 2.0 | |
| Second Electron Spectral Index | 3.0 | 4.0 | |
| Third Electron Spectral Index | 4.2 | ||
| Minimum Electron Lorentz Factor | |||
| Break Electron Lorentz Factor 1 | |||
| Break Electron Lorentz Factor 2 | |||
| Maximum Electron Lorentz Factor | |||
| Jet Power in Magnetic Field [] | |||
| Jet Power in Electrons [] |
3.5 Comparison with other LBL objects
The SEDs of LBL objects detected in VHE -rays challenge single zone homogeneous SSC radiative models, which usually reproduce reasonably well the time-averaged SEDs of the HBL class.
The most complete simultaneous coverage of the BL Lacertae was established by Abdo et al. (2011d) during a multi-wavelength campaign including the Fermi-LAT and the X-ray observatories mentioned in this study for the high-energy part. The X-ray spectrum during that campaign was soft, indicating that its origin was synchrotron radiation rather than Comptonized photons, making for a wider synchrotron distribution than is reported here for AP Librae. The difficulty in this case for modeling BL Lacertae was that the simulated SED required the energy densities to be far from equipartition. However, a 1997 Beppo-SAX observation (Ravasio et al., 2002) of BL Lacertae showed a clear IC origin for the X-ray radiation, yielding a narrower synchrotron distribution, for which the SSC model failed to reproduce a reasonable (non-simultaneous) HE spectrum, and an external contribution was added.
The broad Compton distribution of S5 0716+714, with emission up to , is either an order of magnitude below the best SSC model prediction from Anderhub et al. (2009), or is too wide if the Fermi-LAT spectrum constrains the flux at (Figure 6 in Tavecchio et al. 2010; see also the similar situation for BL Lacertae in the same Figure). Note that the HE and VHE data were not taken simultaneously in these two LBL objects.
4 Conclusions
Contemporaneous observations of AP Librae with many currently available space- and ground-based instruments have been presented. The data have revealed the broadest Compton distribution of any known blazar to date, which spans from X-ray to TeV energies.
The SED of AP Librae is difficult to reproduce with a single zone SSC model: the steep UV spectrum, probably synchrotron emission, does not connect smoothly with the X-ray spectrum, which is underestimated by an order of magnitude if a match is required with the HE -ray spectrum (as was also pointed out by Tavecchio et al. 2010). If a match is required with the X-rays, the Fermi-LAT spectrum is then largely overestimated. The new H.E.S.S. spectrum further complicates the situation, as none of the previous constraints allows this SSC model to reach the VHE domain, even assuming a predominantly Thomson scattering regime which yields Compton components roughly twice as large in as the synchrotron component. There are ways out of the conundrum but at the cost of increased model complexity. An example is blob-in-jet model, recently proposed by Hervet et al. (2015) to reproduce the SED of Ap Librae. Another possiblility is a model where electrons also upscatter soft photons originating outside of the high-energy emission site. It has been shown in this work that VHE rays from the extended jet, seen in X-ray, can be produced and can explain the H.E.S.S. spectrum.
AP Librae is the third of VHE detected LBL-type object for which single zone SSC models fail to reproduce the SED, and is currently the only BL Lac type object combining VHE emission and a resolved X-ray jet. The LBL class of VHE emitting objects proves to be an interesting laboratory to test radiative model scenarios, and perhaps to identify parameters on which the LBL-HBL sequence could depend.
Acknowledgements
The Fermi LAT Collaboration acknowledges generous ongoing support from a number of agencies and institutes that have supported both the development and the operation of the LAT as well as scientific data analysis. These include the National Aeronautics and Space Administration and the Department of Energy in the United States, the Commissariat à l’Energie Atomique and the Centre National de la Recherche Scientifique / Institut National de Physique Nucléaire et de Physique des Particules in France, the Agenzia Spaziale Italiana and the Istituto Nazionale di Fisica Nucleare in Italy, the Ministry of Education, Culture, Sports, Science and Technology (MEXT), High Energy Accelerator Research Organization (KEK) and Japan Aerospace Exploration Agency (JAXA) in Japan, and the K. A. Wallenberg Foundation, the Swedish Research Council and the Swedish National Space Board in Sweden.
Additional support for science analysis during the operations phase is gratefully acknowledged from the Istituto Nazionale di Astrofisica in Italy and the Centre National d’Études Spatiales in France.
This research has made use of data from the MOJAVE database that is maintained by the MOJAVE team (Lister et al. 2009). The MOJAVE program is supported under NASA-Fermi grant NNX12A087G.
The National Radio Astronomy Observatory is a facility of the National Science Foundation operated under cooperative agreement by Associated Universities, Inc.
This research has made use of the NASA/IPAC Extragalactic Database (NED) which is operated by the Jet Propulsion Laboratory, California Institute of Technology, under contract with the National Aeronautics and Space Administration.
This publication makes use of data products from the Wide-field Infrared Survey Explorer, which is a joint project of the University of California, Los Angeles, and the Jet Propulsion Laboratory/California Institute of Technology, funded by the National Aeronautics and Space Administration.
The authors want to acknowledge C.C. Cheung for the VLA radio observation used for contours presented in Figure 2. A.S. acknowledges useful discussions with Dan Harris on the problematics of Chandra data analyses. We thank the Swift and RXTE teams for their cooperation in joint observations of AP Librae. This research has made use of data provided by the SIMBAD database, operated at CDS, Strasbourg, France.
D.S. was partially supported by the Labex ENIGMASS
YYK and ABP were supported in part by the Russian Foundation for Basic Research (project 13-02-12103)
TS was partly supported by the Academy of Finland project 274477.
References
- Abdo et al. (2010) Abdo, A. A., et al. 2010, ApJ, 716, 30
- Abdo et al. (2011a) —. 2011a, ApJ, 736, 131
- Abdo et al. (2011b) —. 2011b, ApJ, 727, 129
- Abdo et al. (2011c) —. 2011c, ApJ, 726, 43
- Abdo et al. (2011d) —. 2011d, ApJ, 730, 101
- Abramowski et al. (2015) Abramowski, A., et al. 2015, A&A, 573, A31
- Ackermann et al. (2011) Ackermann, M., et al. 2011, ApJ, 743, 171
- Aharonian et al. (2006) Aharonian, F., et al. 2006, Nature, 440, 1018
- Aharonian et al. (2007) —. 2007, A&A, 470, 475
- Albert et al. (2007) Albert, J., et al. 2007, ApJL, 666, L17
- Aliu et al. (2013) Aliu, E., et al. 2013, ApJ, 779, 92
- Aliu et al. (2014a) —. 2014a, ApJ, 782, 13
- Aliu et al. (2014b) —. 2014b, ApJ, 797, 89
- Anderhub et al. (2009) Anderhub, H., et al. 2009, ApJL, 704, L129
- Arnaud (1996) Arnaud, K. A. 1996, in Astronomical Society of the Pacific Conference Series, Vol. 101, Astronomical Data Analysis Software and Systems V, ed. G. H. Jacoby & J. Barnes, 17–+
- Atoyan & Dermer (2004) Atoyan, A., & Dermer, C. D. 2004, ApJ, 613, 151
- Band & Grindlay (1985) Band, D. L., & Grindlay, J. E. 1985, ApJ, 298, 128
- Bessell (1990) Bessell, M. S. 1990, PASP, 102, 1181
- Błażejowski et al. (2000) Błażejowski, M., Sikora, M., Moderski, R., & Madejski, G. M. 2000, ApJ, 545, 107
- Bonning et al. (2012) Bonning, E., et al. 2012, The Astrophysical Journal, 756, 13
- Böttcher et al. (2008) Böttcher, M., Dermer, C. D., & Finke, J. D. 2008, ApJL, 679, L9
- Breeveld et al. (2011) Breeveld, A. A., Landsman, W., Holland, S. T., Roming, P., Kuin, N. P. M., & Page, M. J. 2011, in American Institute of Physics Conference Series, Vol. 1358, American Institute of Physics Conference Series, ed. J. E. McEnery, J. L. Racusin, & N. Gehrels, 373–376
- Burrows et al. (2005) Burrows, D. N., et al. 2005, Space Sci. Rev., 120, 165
- Cardelli et al. (1989) Cardelli, J. A., Clayton, G. C., & Mathis, J. S. 1989, ApJ, 345, 245
- Celotti et al. (2001) Celotti, A., Ghisellini, G., & Chiaberge, M. 2001, MNRAS, 321, L1
- Davis (2001) Davis, J. E. 2001, ApJ, 562, 575
- Falomo et al. (1993) Falomo, R., Bersanelli, M., Bouchet, P., & Tanzi, E. G. 1993, AJ, 106, 11
- Finke et al. (2008) Finke, J. D., Dermer, C. D., & Böttcher, M. 2008, ApJ, 686, 181
- Franceschini et al. (2008) Franceschini, A., Rodighiero, G., & Vaccari, M. 2008, A&A, 487, 837
- Godet et al. (2009) Godet, O., et al. 2009, A&A, 494, 775
- Hardcastle (2006) Hardcastle, M. J. 2006, MNRAS, 366, 1465
- Harris et al. (2011) Harris, D. E., et al. 2011, ApJ, 743, 177
- Hervet et al. (2015) Hervet, O., Boisson, C., & Sol, H. 2015, ArXiv e-prints
- Hofmann (2010) Hofmann, W. 2010, The Astronomer’s Telegram, 2743, 1
- Hyvönen et al. (2007) Hyvönen, T., Kotilainen, J. K., Falomo, R., Örndahl, E., & Pursimo, T. 2007, A&A, 476, 723
- Jahoda et al. (1996) Jahoda, K., Swank, J. H., Giles, A. B., Stark, M. J., Strohmayer, T., Zhang, W., & Morgan, E. H. 1996, in Society of Photo-Optical Instrumentation Engineers (SPIE) Conference Series, Vol. 2808, Society of Photo-Optical Instrumentation Engineers (SPIE) Conference Series, ed. O. H. Siegmund & M. A. Gummin, 59–70
- Jones et al. (2009) Jones, D. H., et al. 2009, MNRAS, 399, 683
- Jones (1968) Jones, F. C. 1968, Physical Review, 167, 1159
- Kalberla et al. (2005) Kalberla, P. M. W., Burton, W. B., Hartmann, D., Arnal, E. M., Bajaja, E., Morras, R., & Pöppel, W. G. L. 2005, A&A, 440, 775
- Kaufmann et al. (2013) Kaufmann, S., Wagner, S. J., & Tibolla, O. 2013, ApJ, 776, 68
- Lister et al. (1998) Lister, M. L., Marscher, A. P., & Gear, W. K. 1998, ApJ, 504, 702
- Lister et al. (2009) Lister, M. L., et al. 2009, AJ, 137, 3718
- Lister et al. (2013) —. 2013, AJ, 146, 120
- Meyer & Georganopoulos (2014) Meyer, E. T., & Georganopoulos, M. 2014, ApJL, 780, L27
- Nolan et al. (2012) Nolan, P. L., et al. 2012, ApJS, 199, 31
- Padovani & Giommi (1995) Padovani, P., & Giommi, P. 1995, ApJ, 444, 567
- Paggi et al. (2009) Paggi, A., Massaro, F., Vittorini, V., Cavaliere, A., D’Ammando, F., Vagnetti, F., & Tavani, M. 2009, A&A, 504, 821
- Planck Collaboration et al. (2011) Planck Collaboration et al. 2011, A&A, 536, A7
- Poole et al. (2008) Poole, T. S., et al. 2008, MNRAS, 383, 627
- Ravasio et al. (2002) Ravasio, M., et al. 2002, A&A, 383, 763
- Roming et al. (2009) Roming, P. W. A., et al. 2009, ApJ, 690, 163
- Sambruna et al. (2004) Sambruna, R. M., Gambill, J. K., Maraschi, L., Tavecchio, F., Cerutti, R., Cheung, C. C., Urry, C. M., & Chartas, G. 2004, ApJ, 608, 698
- Sanchez et al. (2013) Sanchez, D. A., Fegan, S., & Giebels, B. 2013, ArXiv e-prints
- Schlafly & Finkbeiner (2011) Schlafly, E. F., & Finkbeiner, D. P. 2011, ApJ, 737, 103
- Shaw et al. (2013) Shaw, M. S., et al. 2013, The Astrophysical Journal, 764, 135
- Sikora et al. (1994) Sikora, M., Begelman, M. C., & Rees, M. J. 1994, ApJ, 421, 153
- Silva et al. (1998) Silva, L., Granato, G. L., Bressan, A., & Danese, L. 1998, ApJ, 509, 103
- Tavecchio et al. (2010) Tavecchio, F., Ghisellini, G., Ghirlanda, G., Foschini, L., & Maraschi, L. 2010, MNRAS, 401, 1570
- Tavecchio et al. (1998) Tavecchio, F., Maraschi, L., & Ghisellini, G. 1998, ApJ, 509, 608
- Tavecchio et al. (2000) Tavecchio, F., Maraschi, L., Sambruna, R. M., & Urry, C. M. 2000, ApJL, 544, L23
- Tavecchio et al. (2007) Tavecchio, F., Maraschi, L., Wolter, A., Cheung, C. C., Sambruna, R. M., & Urry, C. M. 2007, ApJ, 662, 900
- The Fermi-LAT Collaboration (2013) The Fermi-LAT Collaboration. 2013, ArXiv e-prints 1306.6772
- Tsujimoto et al. (2011) Tsujimoto, M., et al. 2011, A&A, 525, A25
- Vaughan et al. (2003) Vaughan, S., Edelson, R., Warwick, R. S., & Uttley, P. 2003, MNRAS, 345, 1271
- Wright (2006) Wright, E. L. 2006, PASP, 118, 1711
- Wright et al. (2010) Wright, E. L., et al. 2010, AJ, 140, 1868
- Zensus et al. (2002) Zensus, J. A., Ros, E., Kellermann, K. I., Cohen, M. H., Vermeulen, R. C., & Kadler, M. 2002, AJ, 124, 662
Appendix A Constraints for an arbitrary field of seed photons
In leptonic class models, the inverse Compton process is responsible for the high energy part of the SED. The seed photons originate either from synchrotron radiation produced within the jet (SSC models) or from a source outside of the jet (external Compton models). In the latter case, the sources can be either the broad-line regions or the dust torus (Sikora et al., 1994; Błażejowski et al., 2000).
The peak observed energy of an electron with Lorentz factor is given by
and the Compton-scattered photon energy by
where the energy777The notation is adopted here. of the seed photons is (respectively in the jet’s frame).
Efficient Compton scattering will occur only for electrons below the KN limit:
| (4) |
This KN limit means that Compton-scattered photons will be mainly restricted to energies:
The synchrotron photons produced by the electrons having the energy have a peak energy given by:
Combining the last two equations with the constraints on maximal values for keV and TeV derived from the observations yields:
| (5) |
which requires either an unusually high Doppler factor, or an unusually low magnetic field. If the 1 TeV photons are produced by IC scattering in the KN regime, Eq. 4 becomes
and the observed photon energy is (Tavecchio et al., 1998)
Then Eq. 5 reads
| (6) |
which is a reasonable constraint. Note that this calculation applies no matter what the seed photon source is (broad-line region or dust torus or synchrotron photons produced within the jet), illustrating the difficulties of either radiative scenarios to account for the main SED features of AP Librae in the Thomson regime.
Appendix B Candidates for VHE observations
The detection of AP Librae by the H.E.S.S. telescopes has revealed the broadest IC component for a blazar with a peak position at very low energy. Unfortunately, only a handful of LBL-type objects have yet been detected at VHEs. To decide if AP Librae is a special case or a typical representative of the LBL class, other LBL objects have to be observed by Čerenkov telescope and detected at VHE.
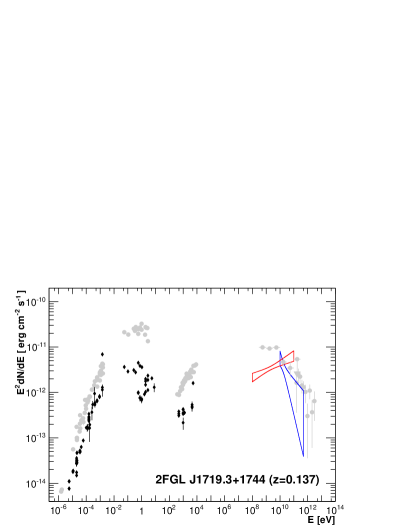
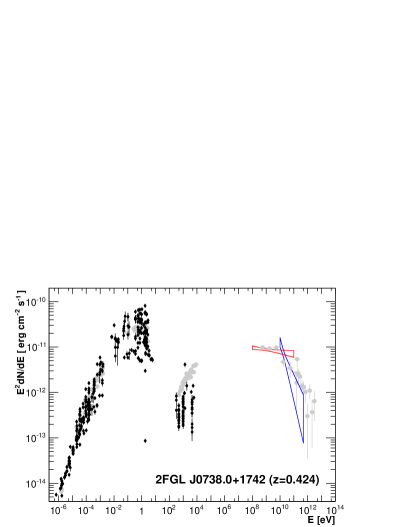
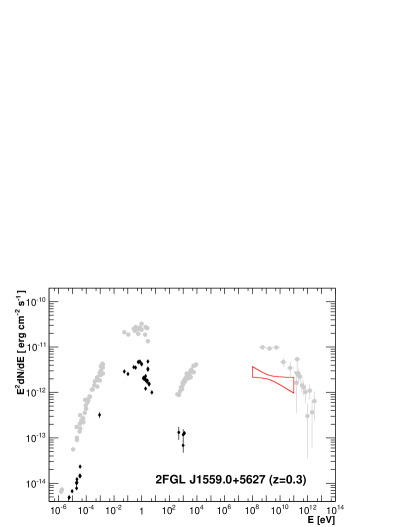
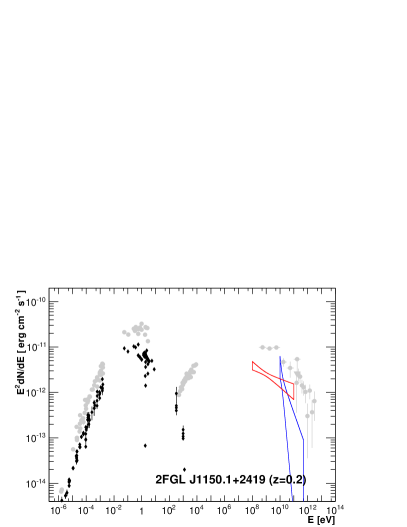
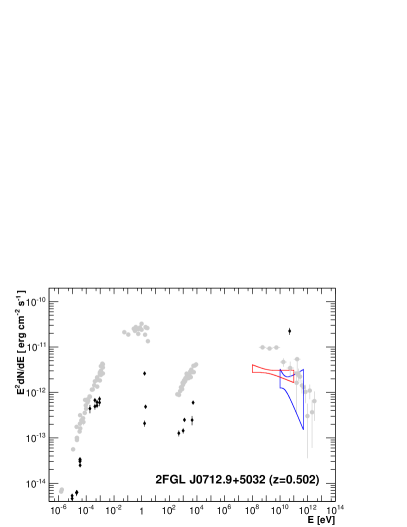
Due to their limited field of view (), an extra-galactic survey performed by Čerenkov telescopes is not possible yet. As a consequence, good targets for observations have to be found based on multi-wavelengths data. In this appendix, six LBL-type objects, present in the second catalog of Fermi sources (2FGL, Nolan et al., 2012) were selected based on their possible VHE emission. The 2FGL best fit power-law, measured in the 100 MeV-100 GeV band, was extrapolated above 200 GeV and EBL correction was made based on the Franceschini et al. (2008) model. The redshift information was extracted either from the second catalog of AGN (2LAC, Ackermann et al., 2011) or from Shaw et al. (2013). Sources without redshift measurement were excluded and only sources classified as a BL Lac of the LBL class were retained. Note that AP Librae appeared to be the first on this list when building it.
The names of six candidates, ranked by predicted flux above 200 GeV, are given in Table 6. For illustration, their SEDs, built from archival data using the ASDC SED builder888http://tools.asdc.asi.it/SED/, are presented in Figure 5. Two out of the six sources can be observed by H.E.S.S. and five by the northern facilities (VERITAS and MAGIC). Despite its location and with a redshift of , the source 2FGL J0738.0+1742 can be well suited for H.E.S.S. II telescope observations given the lower energy threshold (50 GeV) of the instrument. The redshifts of 2FGL J1150.1+2419 and 2FGL J1150.1+2419, found in the 2LAC, were not confirmed by Shaw et al. (2013). Five out of 6 are also present in the first Fermi-LAT Catalog of Sources Above 10 GeV (1FHL, The Fermi-LAT Collaboration, 2013, see Figure 5).
| 2FGL name | redshift | Association | Instruments | ||
|---|---|---|---|---|---|
| 2FGL J1719.3+1744 | 0.137 | PKS 1717+177 | VERITAS/MAGIC | ||
| 2FGL J0617.6-1716 | 0.098 | CRATES J061733.67-171522.8 | H.E.S.S. | ||
| 2FGL J0738.0+1742 | 0.424 | PKS 0735+17 | VERITAS/MAGIC - H.E.S.S. | ||
| 2FGL J1559.0+5627 | 0.3 | TXS 1557+565 | VERITAS/MAGIC | ||
| 2FGL J1150.1+2419 | 0.2 | B2 1147+24 | VERITAS/MAGIC | ||
| 2FGL J0712.9+5032 | 0.502 | GB6 J0712+5033 | VERITAS/MAGIC |