The Globular Cluster System of NGC 6822
Abstract
We present a comprehensive analysis of the globular cluster (GC) system of the Local Group dwarf irregular galaxy NGC 6822. Our study is based on homogeneous optical and near-IR photometry, as well as long-slit spectroscopic observations which are used to determine new radial velocities for 6 GCs, two of which had no previous spectroscopic information. We construct optical-near IR colour-colour diagrams and through comparison to simple stellar population models infer that the GCs have old ages consistent with being 9 Gyr or older, while their metallicities are in the range between . We conduct a kinematic analysis of the GC population and find tentative evidence for weak net rotation of the GC system, in the same sense as that exhibited by the underlying spheroid. The most likely amplitude of rotation is km s-1, approximately half the magnitude of the observed velocity dispersion. Finally, we use the GCs to estimate the dynamical mass of NGC 6822 within kpc and we formally find it to be in the range between . This implies an overall mass-to-light ratio in the range of and indicates that NGC 6822 is highly dark matter dominated. The mass and the corresponding mass-to-light ratio estimates are affected by various additional systematic effects due to limitations of the data and the model that are not necessary reflected in the formal uncertainties.
keywords:
Local Group — galaxies: individual (NGC 6822) — galaxies: kinematics and dynamics — globular clusters: general1 Introduction
According to the CDM cosmological model, massive galaxies build up in part through the amalgamation and merger of smaller galaxies. The globular cluster (GC) systems of such massive galaxies, which are often quite rich, are also thought to be assembled, at least partially, from GCs donated by the smaller accreted galaxies (e.g. Côté et al., 1998, 2000). If this is indeed the case, GCs can act as valuable tracers of such events, while offering the potential to understand the formation history of their host galaxy. In their influential study, Searle & Zinn (1978) uncovered important clues about the formation of the Milky Way through its GC system, namely that accretion played a significant part in the process. Modern studies of the Galactic GC system arrive at the same conclusion (e.g. Zinn, 1993; Mackey & Gilmore, 2004; Mackey & van den Bergh, 2005; Marín-Franch et al., 2009; Dotter et al., 2010, 2011; Keller et al., 2012). Indeed the growth of our Galaxy and its GC system is still ongoing. Observations of the Sagittarius dwarf galaxy, which is currently being accreted onto the Milky Way while donating at least 5 GCs to the Galactic halo, provide the strongest evidence that this is the case (e.g. Bellazzini et al., 2003; Law & Majewski, 2010). The work of our group has shown that a similar situation is also observed in M31. The halo of this galaxy features a number of prominent stellar streams with which many GCs are associated, bearing witness to an ample accretion history (e.g. Mackey et al., 2010b, 2013a, 2014; Huxor et al., 2011; Veljanoski et al., 2013b, 2014).
The study of dwarf irregular galaxies (dIrr) is a particularly important topic within the context of understanding galaxy formation. Being by far the most common galaxy type at high redshift (e.g. Stiavelli et al., 2004; van der Wel et al., 2011), dIrr systems could have provided a significant contribution toward the growth of massive galaxies at early times. In addition, in order to use GC as probes of galaxy assembly, it is crucial to understand the properties of GC systems in dwarf galaxies, and how they relate to the host galaxy properties and to the properties of GCs formed in situ around a massive galaxy. In this context, dIrr galaxies are especially helpful, since in the local universe they are often found either in isolation or in groups without a massive dominating companion, making them excellent systems for studying the pristine properties of GC systems.
Lying in the southern hemisphere with Galactocentric coordinates of , NGC 6822 is one of the most intriguing dwarf galaxies in the Local Group. Discovered by Barnard (1884), this barred dIrr galaxy features a number of peculiar properties that has made it the focus of much attention over the years, even though its low Galactic latitude makes observations quite challenging. It has an absolute magnitude and a half-light radius of kpc (Hodge, 1977; Hodge et al., 1991). Located at a distance of kpc (Górski et al., 2011), it is the closest dIrr galaxy save for the Magellanic Clouds. It does not appear to be associated with either the Milky Way or M31, and it has no other neighbouring companions. This galaxy contains a substantial spheroidal component, that has been traced via its constituent red giant branch stars out to a radius of at least kpc (Battinelli et al., 2006). Demers et al. (2006) used carbon stars in the spheroid as kinematic tracers, finding evidence for rotational support. In addition, NGC 6822 contains large quantities of HI gas forming a disc, the semi-major axis of which is positioned perpendicular to the stellar spheroid (e.g de Blok & Walter, 2000, 2006; Weldrake et al., 2003). The HI gas is also observed to be rotating, but at right angles to the rotation of the spheroid, showing that there are at least two different kinematic components present in NGC 6822. This is further supported by a recent study on planetary nebulae and HII regions by Flores-Durán et al. (2014), showing that the planetary nebulae have kinematics similar to the carbon stars, while the HII regions share the kinematics of the HI disc.
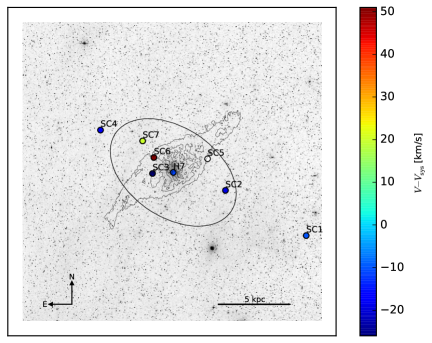
In recent years, dedicated searches have substantially increased the number of GCs known around Local Group galaxies (e.g. Huxor et al., 2008; Veljanoski et al., 2013a), including NGC 6822. Hubble VII, originally discovered by Hubble (1925), was long considered the only old GC in NGC 6822. However, this changed when Hwang et al. (2011) discovered 4 new GCs in wide-field CFHT/MegaCam imagery covering an area of deg around NGC 6822, . Later, Huxor et al. (2013) re-examined this data and by complementing it with additional archival Subaru and CFHT imagery which expanded the observed footprint, uncovered 3 additional GCs, bringing the total number of members to 8. Figure 1 shows the positions of the GCs superimposed on an image of NGC 6822, on which are also marked the contours of the HI distribution, ranging between 3.5 - 42 cm-2 (de Blok & Walter, 2000), and the known extent of the red giant branch stars in the galaxy spheroid (Battinelli et al., 2006). It is notable that the GC system of NGC 6822 is quite spatially extended, with the most remote cluster, SC1, having a projected radius of nearly 11 kpc. Furthermore, the GCs are arranged in a rather linear configuration, with an orientation aligned quite closely with the major axis of the spheroid (Hwang et al., 2011; Huxor et al., 2013). Five of the 8 GCs in NGC 6822 are fairly extended in nature and thus resemble the extended clusters found in the haloes of M31 (e.g. Huxor et al., 2005; Huxor et al., 2014) and M33 (Stonkutė et al., 2008). The coordinates, position angles, projected radii (), GC type and Galactic extinction values (Schlegel et al., 1998) of the clusters are listed in Table 1.
| ID | RA (J2000) | Dec (J2000) | GC type | Reference | ||||
|---|---|---|---|---|---|---|---|---|
| [h m s] | [d m s] | [kpc] | [deg] | [pc] | [mag] | |||
| Hubble-VII | 19 44 55.8 | -14 48 56.2 | 0.1 | 227 | C | 2.50.1 | 0.24 | Hubble (1925) |
| SC1 | 19 40 11.9 | -15 21 46.6 | 10.7 | 244 | E | 14.00.2 | 0.16 | Hwang et al. (2011) |
| SC2 | 19 43 04.5 | -14 58 21.4 | 4.1 | 250 | E | 11.50.2 | 0.22 | Hwang et al. (2011) |
| SC3 | 19 45 40.2 | -14 49 25.8 | 1.4 | 94 | E | 7.50.5 | 0.19 | Hwang et al. (2011) |
| SC4 | 19 47 30.4 | -14 26 49.3 | 6.0 | 60 | E | 13.80.3 | 0.19 | Hwang et al. (2011) |
| SC5 | 19 43 42.3 | -14 41 59.7 | 2.7 | 290 | E | … | 0.22 | Huxor et al. (2013) |
| SC6 | 19 45 37.0 | -14 41 10.8 | 1.6 | 52 | C | … | 0.19 | Huxor et al. (2013) |
| SC7 | 19 46 00.7 | -14 32 35.0 | 3.0 | 43 | C | … | 0.21 | Huxor et al. (2013) |
In this paper we present a comprehensive analysis of the GC system in NGC 6822, based on uniform optical and near IR photometry and long-slit spectroscopy. The photometry is used to constrain the ages and metallicities. Even though deeper optical data exist for some clusters (e.g. Hwang et al., 2011; Huxor et al., 2013), the uniformity of the data presented in this study ensures no systematic offsets are present in the age and metallicity estimates due to heterogeneous imaging. The spectroscopy yields new radial velocity measurements for 6 of the GCs, two of which had no previous velocity information. These data are also used to redetermine the dynamical mass and mass-to-light ratio of this galaxy.
2 The Data
2.1 Optical data
The optical imagery has been obtained as part of the PanSTARRS1 3 Survey (Kaiser et al. 2010; K. Chambers et al., in preparation). This survey has targeted three quarters of the sky () in five optical bands, , with the 1.8 m PanSTARRS1 telescope located on Haleakala, Hawaii (Tonry et al., 2012). The optical system of PanSTARRS1 features a 1.4 Gigapixel imager (Onaka et al., 2008; Tonry & Onaka, 2009) with a field of view of 7 deg2. The sky has been observed up to four times a year in each band, with individual exposures being between 30 and 45s in length. The data are automatically processed in real time with the Image Processing Pipeline (ipp, Magnier, 2006). After the standard reduction processes such as flat-fielding, the pipeline resamples all images to a uniform pixel size of of 0.25 arcsec and aligns them to the equatorial axes onto “skycells” – regular patches on the sky of 6250 pixels across. The data are calibrated to each other self-consistently using partially overlapping exposures (Schlafly et al., 2012), yielding a calibration precision better than 10 mmag as measured against SDSS. For the work presented here, we use data from the processing version 2 (PV2) and 2 2 arcmin cutouts of stacked images of the GCs provided by the postage stamp server.
2.2 Near-IR data
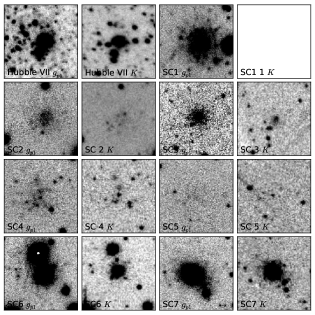
The near-IR imaging of NGC 6822 was taken as part of a project to survey red stellar populations of Local Group galaxies. The data were obtained in October 2008 using the WFCAM instrument (Casali et al., 2007) mounted on UKIRT. WFCAM has four individual detectors, each with a pixel scale of 0.4 arcsec, arranged such that four dithered pointings cover a square of 0.75 deg2 when properly aligned. Our observations were conducted in three near-IR bands , and . The data were processed with a pipeline created by the Cambridge Astronomy Survey Unit111http://casu.ast.cam.ac.uk, which carries out the standard dark current correction, flat-fielding, crosstalk removal, systematic noise and sky removal. The pipeline, described in Cioni et al. (2008) and Hodgkin et al. (2009), also performs full astrometric and photometric calibration, based on the 2MASS point source catalogue. The reduced images are stacked and microstepped to produce individual science frames. The finalised frames are not resampled, and thus they retain the original pixel scale of the detector. The nightly zero-point variation is %. Figure 2 shows 60 60 arcsec wide cutouts of each GC hosted by NGC 6822 in the PanSTARRS1 and UKIRT/WFCAM bands. Note that SC1 falls outside the near-IR coverage and thus no thumbnail is shown, while SC5 is only marginally detected in both optical and near-IR data sets.
2.3 Spectroscopic data
Moderate resolution spectra for 6 GCs were acquired in the summer of 2009 using the ISIS instrument mounted on the 4.2-m William Hershel Telescope (WHT), the RC-spectrograph installed on the 4-m Kitt-Peak National Observatory (KPNO) telescope, and the DEIMOS spectrograph used by the 10-m W. M. Keck telescope. Several exposures of each GC were obtained, with individual integration times determined according to the brightness of each target. Our observing log is shown in Table 2.
| ID | Date of obs. | Number of | Integration time | Telescope | Principal |
|---|---|---|---|---|---|
| exposures | per exposure [s] | investigator | |||
| Hubble VII | 14/08/2009 | 3 | 900 | KPNO | A. Ferguson |
| SC1 | 16/08/2009 | 3 | 1800 | KPNO | A. Ferguson |
| SC3 | 17/08/2009 | 3 | 1800 | KPNO | A. Ferguson |
| SC6 | 15/08/2009 | 3 | 900 | KPNO | A. Ferguson |
| SC7 | 15/08/2009 | 3 | 600 | KPNO | A. Ferguson |
| SC2 | 16-17/08/2009 | 3 | 1800 | WHT | A. Huxor |
| SC7 | 16/08/2009 | 2 | 600 | WHT | A. Huxor |
| SC1 | 26/06/2009 | 3 | 300 | Keck | J. Hurley |
| SC2 | 26/06/2009 | 3 | 300 | Keck | J. Hurley |
| SC6 | 26/06/2009 | 3 | 300 | Keck | J. Hurley |
| SC7 | 26/06/2009 | 3 | 420 | Keck | J. Hurley |
2.3.1 WHT and KPNO data
The ISIS instrument comprises two individual detectors, attached to separate ‘arms’ of the spectrograph, that independently sample different wavelength ranges. The blue arm covers a wavelength range between Å with a dispersion of 0.4 Å pixel-1, selected via the usage of the EE12 camera along with the R600B grating. The resolving power is R . Conversely, the red arm uses the RED-PLUS detector together with the R600R grating to select the wavelength range between Å with a dispersion of 0.49 Å pixel-1. The resolving power in this case is R . A similar set up was used for the KPNO observations. The T2KB detector, in conjunction with the KPC007 grating were employed in order to select the wavelength range between Å with a dispersion of 0.139 Å pixel-1 and a resolving power of R . The spectra obtained with both telescopes were not binned in either the spatial or the wavelength directions. The typical S/N of the spectra is per Å.
The reduction of the spectroscopic data was carried out in iraf222iraf is distributed by the National Optical Astronomy Observatories, which are operated by the Association of Universities for Research in Astronomy, Inc., under cooperative agreement with the National Science Foundation.. The basic reduction steps – bias and overscan subtraction, flat-fielding, illumination correction – were done with appropriate tasks in the ccd package. Having completed the initial reduction steps on the two-dimensional frames, the apall task in the kpnoslit package was used to extract one-dimensional spectra from them. We set the extraction aperture to be between 2-4 arcsec. With the same task, we interactively selected appropriate background sky regions, which we fit with a 2nd order Chebyshev polynomial and subtracted. The spectra were then traced using a 3rd order cubic spline function, and extracted using the optimal variance weighting option in apall.
We established wavelength calibration of the one-dimensional frames via Cu-Ne-Ar and He-Ne-AR lamps for WHT and KPNO spectra respectively. Comparison ‘arcs’ were acquired before and after each cluster exposure. We extracted the arc spectra with an identical strategy as the target GCs they were used to calibrate. Using the identify task, we pinpointed blue, red and lines in the arc spectra and fitted a dispersion solution with a 3rd order cubic spline function. The root-mean-square residuals of the fits are Å, Å and Å for the data obtained with the ISIS blue, ISIS red and RC instruments respectively. Since two arc spectra were observed for each target exposure, the resulting wavelength solutions were averaged before being applied to the appropriate GC via the dispcor task. To assess the reliability of the wavelength calibration, we measured the positions of sky emission lines in the sky spectra, which are a by-product of the apall extraction. We found that the wavelength calibration is accurate to 0.08 Å for the WHT and 0.1 Å for the KPNO data.
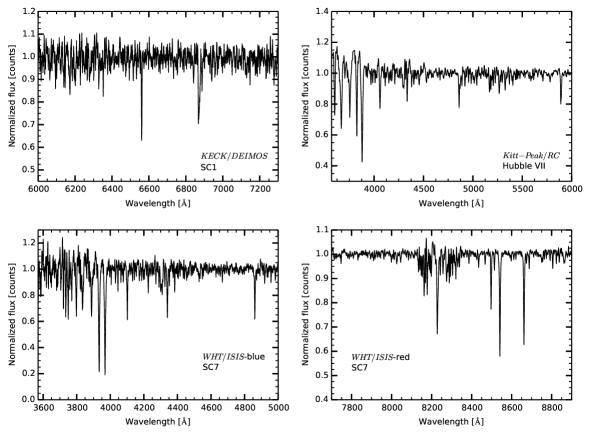
Given that all but one cluster were observed as a series of separate exposures with each instrument, these were stacked using an inverse variance weighting technique (e.g. Veljanoski et al., 2014). Finally, we continuum subtracted the spectra for the purpose of measuring radial velocities. Examples of the fully reduced spectra obtained with each instrumental set up are shown on Figure 3. The displayed spectra are continuum normalized rather than continuum subtracted in order to preserve the relative strengths of the absorption lines for better visualisation.
2.3.2 Keck data
We used the Deep Extragalactic Imaging Multi-Object Spectrograph (DEIMOS) in longslit mode to observe four NGC 6822 GCs (Swinburne Keck program 2009A_W006D, PI Hurley). The longslit mode of DEIMOS is achieved by inserting a standard single slit mask into the optical path of the instrument. For all observations with this spectrograph we used a mask featuring a slit 0.8 arcsec wide. The DEIMOS camera comprises of 8 CCD chips arranged in a mosaic pattern, with the long axis of this array oriented in the spatial direction and the short axis in the dispersion direction. This setup essentially produces two spectra simultaneously for a given compact target – one on a ‘blue’ CCD and one on a ‘red’ CCD. We selected a central wavelength of 6040 Å via the 1200 l mm-1 grating, resulting in a dispersion of 0.33 Å pixel-1. The resolving power of the spectra observed with the red CCD is R .
To reduce observations of a given GC we first identified the relevant CCD chips covered by the blue and red spectra. We isolated these and reduced them separately; the remaining 6 CCD chips were discarded, as they contained no signal coming from our target. Following this, the standard reduction steps such as bias and overscan subtraction, and flat-fielding, were undertaken with appropriate routines in the ccd package in iraf. Inspecting the reduced 2-dimensional frames, significant geometrical distortions in the dispersion of the target objects are clearly evident, as well as distortions in the sky lines. To rectify these we simply wavelength calibrated the 2-dimensional frames prior to extracting a 1-dimensional spectrum.
The wavelength solution is based on a Ne-Ar-Kr-Xe lamp, taken during the baseline calibrations of the instrument. For the frames containing the redder part of the spectrum, we identified 23 lines in the arc spectrum via the identify and reidentify tasks. The 2-dimensional wavelength solution was then determined with the fitcoords task located in the twodspec package. The root-mean-square residuals of the fit were Å. We next applied the wavelength solution to the appropriate frames via the transform routine found in the same package. Inspecting the wavelength calibrated frames, one sees that the distortions in the spatial axis have disappeared, and the skylines are perfectly straight in a direction perpendicular to the dispersion axis. This is a good indicator that the wavelength calibration is reliable. For clarity, the wavelength range of our spectra observed with the red chip spanned Å.
Unfortunately, we were unable to wavelength calibrate the frames containing the blue part of the spectra. This is because the arc spectrum observed at these wavelengths contained only three reliable lines, all of which sit extremely close to the edge of the frame. This is a well known calibration issue for data taken in this specific wavelength range (albeit one that is nowadays possible to cicumvent). Even though this problem forced us to proceed further using only the ‘red’ frames, it did not hinder any of the velocity estimation and kinematic analysis which we present in the later sections of this paper.
From the appropriate 2-dimensional frames we extracted 1-dimensional spectra and stacked these in the same manner as for the 4-m data, with the only difference being the width of the extraction aperture, which for the Keck data we set to 1.1 arcsec. As before, we used the sky spectra associated with the extracted 1-dimensional spectra to assess the accuracy of the wavelength calibration. We find that the wavelength calibration is typically accurate to 0.06 Å. An example of a fully reduced, wavelength calibrated Keck spectrum is shown in Figure 3.
3 Photometry
We determined the total magnitudes of each GC in NGC 6822 via aperture photometry in all 8 bands, , , , , , , , and . The photometric measurements were conducted using the phot task in iraf. Accurate centres for the classical, i.e. compact, GCs were established with the centroid algorithm within phot. Since the astrometric calibration is identical for the entire PanSTARRS1 data set we performed the centring in the band imaging, since the clusters are best seen there. For the diffuse, extended clusters, we determined the centre via visual inspection. Offsets from a nearby bright star were used to accurately redetermine the centre of each cluster through the rest of the data.
We used circular apertures to sum the total flux coming from each cluster. The aperture size for a given cluster was chosen such that the aperture enclosed the entire extent of the target; these sizes are listed in Table 3. The background sky was determined between two concentric circular annuli surrounding the photometric aperture. We carefully placed these in a way so as to exclude unwanted contaminants such as extended background galaxies or foreground Milky Way stars. The reported magnitude uncertainties, which also include the variation in the sky, are formally determined by the phot task.
All our photometric measurements were zero-point calibrated and corrected for atmospheric extinction, and then subsequently corrected for foreground reddening using values from Schlegel et al. (1998). We calculated the extinction coefficients for the PanSTARRS1 bands using the relations presented in Tonry et al. (2012):
| (1) | ||||
| (2) | ||||
| (3) | ||||
| (4) | ||||
| (5) |
Schlafly & Finkbeiner (2011) recalibrated the from Schlegel et al. (1998) and recommend that the PanSTARRS1 reddening coefficients be further multiplied by a factor of 0.88, which we included in the magnitude derivation. Finally, Table 3 lists the extinction-corrected total magnitudes of all GCs in NGC 6822.
| ID | Aperture | ||||||||
|---|---|---|---|---|---|---|---|---|---|
| [arcsec] | [mag] | [mag] | [mag] | [mag] | [mag] | [mag] | [mag] | [mag] | |
| Hubble VII | 3.7 | 15.46 0.02 | 14.99 0.02 | 14.72 0.02 | 14.58 0.03 | 14.47 0.04 | 13.44 0.01 | 12.98 0.02 | 12.86 0.01 |
| SC1 | 7.0 | 16.62 0.02 | 16.19 0.02 | 15.97 0.02 | 15.83 0.03 | 15.72 0.04 | … | … | … |
| SC2 | 8.0 | 17.64 0.02 | 16.98 0.02 | 16.80 0.02 | 16.63 0.03 | 16.57 0.05 | 15.53 0.03 | 15.11 0.03 | 14.86 0.03 |
| SC3 | 3.0 | 18.79 0.02 | 18.35 0.02 | 18.08 0.02 | 17.98 0.03 | 17.77 0.04 | 16.93 0.04 | 16.44 0.04 | 16.32 0.05 |
| SC4 | 8.0 | 17.94 0.02 | 17.37 0.02 | 17.00 0.02 | 16.84 0.03 | 16.78 0.02 | 15.74 0.04 | 15.31 0.04 | 15.11 0.04 |
| SC51 | 7.5 | ||||||||
| SC6 | 4.7 | 15.76 0.02 | 15.26 0.02 | 15.03 0.01 | 14.91 0.03 | 14.83 0.02 | 13.89 0.01 | 13.42 0.02 | 13.30 0.01 |
| SC7 | 5.0 | 15.24 0.02 | 14.60 0.02 | 14.29 0.01 | 14.12 0.03 | 13.99 0.02 | 12.93 0.01 | 12.39 0.02 | 12.30 0.01 |
| ID | ||||
|---|---|---|---|---|
| [mag] | [mag] | [mag] | [mag] | |
| Hubble VII | 15.05 0.02 | 14.18 0.03 | ||
| SC1 | 16.30 0.02 | 15.48 0.03 | ||
| SC2 | 17.15 0.03 | 16.25 0.03 | ||
| SC3 | 18.44 0.04 | 17.57 0.03 | ||
| SC4 | 17.52 0.03 | 16.47 0.02 | ||
| SC51 | ||||
| SC6 | 15.38 0.02 | 14.51 0.02 | ||
| SC7 | 14.77 0.02 | 13.75 0.02 |
It is important to note that SC5 is at best marginally detected in the imaging, and thus the measured values represent lower limits to its magnitudes in all bands (i.e., upper limits to its luminosity). The extended cluster SC1 is the most remote object in this system and is located outside the coverage of the near-IR data.
To allow for comparison with other studies, we convert the photometry measurements from the PanSTARRS1 system to the classical Johnson/Cousins system using equations derived in Tonry et al. (2012):
| (6a) | |||
| (6b) | |||
The conversion to the Johnson and Cousins bands adds an additional 0.012 mag and 0.017 mag to the uncertainty, respectively. The results of the conversions are listed in Table 4. This table also lists the absolute magnitudes , calculated assuming each cluster has the same distance of 472 kpc as the centre of NGC 6822. In Table 5 we compare our photometric measurements to those in previously published studies. In their discovery paper, Huxor et al. (2013) presented optical photometric for SC6 and SC7, measured on CFHT/MegaCam archival images. There is an excellent agreement between the photometry presented in this work to that in Huxor et al. (2013), with the measurements being less than one standard deviation apart. Comparing the optical colour from our study to those published in Hwang et al. (2011), one finds mixed results. While there is an excellent agreement between the colour measurements of our present study and that of Hwang et al. (2011) for SC1 and SC2, there is a poor agreement regarding the colour values of SC4, and even a strong disagreement in the case of SC3. In addition, the colours presented by Hwang et al. (2011) are always redder than those in this study.
4 Ages and Metallicities
The best way of determining metallicities and ages of GCs is through the analysis of deep colour-magnitude diagrams of their resolved stellar populations. Second to that, high quality spectroscopic data can also be used to derive the metal content and age of GCs. However, not all of our spectra have sufficiently high S/N to reliably determine these quantities. Broadband colour-colour diagrams using a combination of optical-optical and optical-near-IR colours are another way to estimate ages and metallicities of GCs, and require only the existence of homogeneous well-calibrated photometry (e.g. Puzia et al., 2002; Hempel et al., 2003; Veljanoski et al., 2013a; Muñoz et al., 2014). The mechanism behind this is that both and have similar sensitivity to the stars located near the main sequence turn off point, which are most sensitive to age, but is considerably more affected by the temperature of the red giant branch which is more dependant on metallicity than age. Hence, comparing where GCs on such a plot sit relative to simple stellar population model tracks allows a crude estimate of age and metal content of each cluster.
In Figure 4 we show a vs colour-colour diagram constructed with the photometry presented in Table 3. Integrated magnitudes, in appropriate filters, of simple stellar populations having several discrete ages are also overlaid on the same plot. They are derived from the PARSEC1.1 models (Bressan et al., 2012), and span the metallicity range of . Formally, the diagram shows that the clusters have old ages spanning the range between and 12 Gyrs, but they are all consistent with being 9 Gyrs or older. This is in agreement with the spectroscopic study by Hwang et al. (2014). The only exception is the cluster SC5, which being only marginally detected at best in both the optical and near-IR imaging, does not lie near the model tracks and thus its age and metallicity can not be reliably constrained. For completeness, it is shown as a filled square in Figure 4.
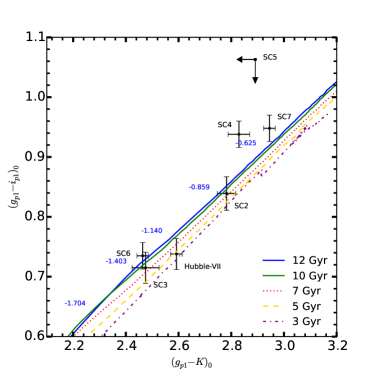
We estimate the metallicities of the clusters via two different methods. In both methods, we ignore SC5 since this cluster does not have reliable photometry. In the first method, the metallicity of each cluster is determined directly from Figure 4. To do this, we projected the position of each GC onto a grid of 12 Gyr isochrones in color-color space and determined which track lay closest to the GC. The 12 Gyr isochrone set is well sampled in metallicity and thus no interpolation is needed for extracting the correct metallicities. The upper and lower uncertainties are determined in the exactly the same way, considering the bluest and reddest possible combination of colours of each clusters respectively, as allowed by the colour uncertainties. The metallicities of the clusters determined in this way are presented in the first column in Table 6.
A different method of estimating GC metallicities is through empirical colour-metallicity relations. Here we use the relation derived by Kissler-Patig et al. (2002), calibrated using 129 Milky Way and M31 GCs that have , to set additional constraints on the metallicities of the NGC 6822 GCs. The relation is valid over a metallicity range of [Fe/H] dex, and it has the form:
| (7) |
with an rms of 0.29 dex. Note that such a linear relation between colour and metallicity is a crude assumption (Cantiello & Blakeslee, 2007).
The metallicities obtained via Equation 7 are also shown in Table 6. It is apparent that there is a modest discrepancy between the estimated metallicities via the two different methods. Although all measurements, except that for SC2, formally agree with each other, a clear and nearly constant offset of dex is present. This mismatch is most likely due to systematics in the stellar evolutionary models. Given how rapidly these models progress, at the moment we find the metallicities estimated via the empirical relation more reliable.
Table 6 also lists the [Fe/H] estimates from the spectroscopic study of Hwang et al. (2014), as well as spectroscopic metallicities for Hubble VII from earlier studies (Cohen & Blakeslee, 1998; Chandar et al., 2000). In general, the photometric metallicities derived here are considerably higher than those presented by Hwang et al. (2014), with only SC3 being in formal agreement. However, no uniform offset is present between these two sets of measurements. Furthermore, while our photometric [Fe/H] value for Hubble VII is also higher than those derived in Cohen & Blakeslee (1998) and Chandar et al. (2000), the measurements agree within the reported uncertainties.
| ID | [Fe/H](a) | [Fe/H](b) | [Fe/H](c) | [Fe/H](d) | [Fe/H](e) |
|---|---|---|---|---|---|
| [dex] | [dex] | [dex] | [dex] | [dex] | |
| Hubble-VII | |||||
| SC1 | … | … | … | … | |
| SC2 | … | … | |||
| SC3 | … | … | |||
| SC4 | … | … | |||
| SC5 | … | … | … | … | |
| SC6 | … | … | |||
| SC7 | … | … |
The reason for the discrepancy between the results presented in this contribution and those by Hwang et al. (2014) is unclear. It is known that NGC 6822 contains young and more metal rich populations of stars, and they could be the cause of the observed results if they were contaminating the photometric apertures. However, repeating the photometry with smaller apertures in order to exclude possible contaminants did not change the results in Figure 4. In addition, the ages are recovered to be old which argues against younger stellar populations contaminating the derived total magnitudes. As already noted, the optical (V-I) colours presented by Hwang et al. (2011) are always redder than those in this work. It is clear from examining Figure 4 that neither our or their optical colours are consistent with their low spectroscopic metallicities, at least when interpreted using the PARSEC1.1 models. A colour-magnitude diagram analysis of the resolved stellar populations in these GCs would certainly help to resolve this issue, and might even indicate the reason for the mismatch.
Another effect to be considered is the internal reddening within NGC 6822 itself. As discussed earlier, this galaxy contains a significant amount of gas and dust, which, if not properly accounted for could cause the clusters to appear redder and thus more metal-rich than they actually are. Looking at Figure 1 this seems to be unlikely since many GCs are located outside the extent of the HI disc, including several which are inferred to have high metallicities.
5 Kinematics
5.1 Radial velocity measurements
We derived heliocentric radial velocities from the spectra obtained with the 4-m class telescopes via a customized minimisation routine, using a number of appropriate radial velocity standard stars and bright M31 GCs as templates (see Veljanoski et al., 2014). The derived velocity from each science spectrum is the average of all minimisations between that spectrum and the applied velocity templates. A full description of the minimisation process, as well as the radial velocity standard stars and clusters is presented in Veljanoski et al. (2014). The minimisation method is similar to the more frequently used cross-correlation technique (Tonry & Davis, 1979), with the advantage that it uses the uncertainties in the spectra of both the target and template objects, which helps to weed out spurious peaks in the functions and reduces the resulting velocity uncertainties.
During the course of the Keck observations no radial velocity standard stars were observed. However, the bright cluster SC7 was observed with both the KPNO and the WHT telescopes, essentially providing three independent velocity estimates that all agree with each other very well (one of these comes from KPNO, while two come from the red and blue arms of the ISIS spectrograph on the WHT). Thus we use our Keck observation of this cluster as a radial velocity template against which the other Keck spectra were matched, and adopt as its velocity the error weighted mean of the three independent measurements obtained from the 4-m data sets. The same algorithm was used to estimate the radial velocity of the Keck targets.
From all these data we have up to three independent velocity estimates for 6 of the 8 GCs in NGC 6822, two of which (SC6 and SC7) possess no previous velocity information. Table 7 lists the velocity estimates coming from the different datasets and their associated uncertainties. Since these all agree within the measurement uncertainties, we combine them into a single value by performing an error weighted average and use these values for the forthcoming analysis. For comparison, Table 7 also lists the velocity information available in the literature, as well as the systemic velocity of NGC 6822. Our measurements are generally in good agreement with those from the literature, while possessing considerably smaller uncertainties.
Of the remaining two clusters, SC5 is sufficiently faint that to date there have been no successful velocity measurements made for this object. Hwang et al. (2014) present a velocity measurement for SC4 (see Table 7); however the uncertainties on their estimate are large. Although we did not obtain a longslit spectrum of SC4 during any of our observing runs, individual stars within this object were targeted with DEIMOS in multislit mode during our Keck run. The purpose of these observations was to investigate the internal kinematics of this rather extended cluster, and this analysis will be presented elsewhere (Mackey et al., 2015, in prep.). Here we adopt the outcome of a computation to determine the most-likely radial velocity of this cluster given individual measurements for seven member stars, km s-1.
| ID | combined | Literature | Reference for | ||||
|---|---|---|---|---|---|---|---|
| [km s-1] | [km s-1] | [km s-1] | [km s-1] | [km s-1] | [km s-1] | literature data | |
| NGC 6822 | … | McConnachie (2012) | |||||
| Hubble VII | Cohen & Blakeslee (1998); Hwang et al. (2014) | ||||||
| SC1 | Hwang et al. (2014) | ||||||
| SC2 | Hwang et al. (2014) | ||||||
| SC3 | Hwang et al. (2014) | ||||||
| SC4 | Hwang et al. (2014); Mackey et al. (in prep.) | ||||||
| SC5 | |||||||
| SC6 | |||||||
| SC7 | template |
5.2 Bayesian kinematic modelling
Constraining the kinematic properties of the GCs around NGC 6822 is one of the main goals of this paper. Unlike in massive galaxies, the GC systems of dwarfs are typically populated by only a few members, so it is important to use a method which will extract the maximum information from the sparse data that are available. Following the example from Veljanoski et al. (2014), we work in the Bayesian framework, which enables us to construct a kinematic model and deduce the most likely values for the quantities of interest.
Given the known rotation of both the HI disk and the spheroid (as traced with carbon stars), we particularly want to test whether the GC system of NGC 6822 exhibits any measurable degree of rotation. We thus construct a kinematic model which features both rotational and velocity dispersion components. The rotation component is constructed following the prescription from Côté et al. (2001):
| (8) |
where are the measured radial velocities, and are the position angles of the GCs and the GC rotation axis respectively and is the rotation amplitude. The systemic radial motion of the GC system taken to be the heliocentric motion of NGC 6822, is labelled as . As elaborated in Côté et al. (2001), this simple motion along circular orbits assumes that the GC system being studied is spherically distributed, that the rotation axis lies in the plane of the sky and that the projected angular velocity is a function of radius only.
Looking carefully at Figure 1 and Table 7, it is noticeable that even though the mean velocity of the GCs, which is km s-1, is similar to the systemic motion of NGC 6822, there is a preference for the GCs to have radial velocities more negative than the systemic velocity of their host. Thus we retain as a free parameter instead of fixing in to the known systemic velocity of NGC 6822.
The velocity dispersion is assumed to possess a Gaussian form, and not to change as a function of projected radius. It is mathematically described as:
| (9) |
where is the intrinsic velocity dispersion of the NGC 6822 GC system while are the uncertainties in the radial velocity measurements.
Combining these two components, our kinematic model takes the following form:
| (10) |
where, as before, is the systemic rotation described by Equation 8, are the observed heliocentric radial velocities of the GCs as presented in Table 7, and is a velocity dispersion as modelled by Equation 9. Hence, the likelihood function for the above kinematic model is:
| (11) |
where and are the observed properties of the GCs, while and are the model free parameters. We assume all priors for the free parameters to be flat.
Even though our model features four free parameters, we systematically calculate the likelihood function via a “brute-force” method over a regular grid shaped by the parameter space of the kinematic model. The rotation amplitude and the velocity dispersion parameters range from 0 to 180 km s-1 and from 0 to 120 km s-1respectively, both with a resolution of 2 km s-1. The axis of rotation, , is searched from 0 to rad with a step size of 0.15 rad, while the ranges from -200 to 45 km s-1 with a step size of 3 km s-1.
With this set-up, however, it quickly became apparent that the algorithm could not properly converge with the position angle allowed to vary as a free parameter. This is due to the unusual linear configuration of the GCs and the small size of the sample. Thus, in order to investigate the general kinematic properties of this GC system, we consider three constrained models. In the first scenario, we assume that if the GC system is rotating, the rotation axis is perpendicular to the GC alignment in the plane of the sky. This is a reasonable assumption given that rotating configurations usually form flattened ellipsoids or disks. We refer to this model as to the “disk model”; in this scenario the rotation axis would lie close to that inferred for the spheroid by Demers et al. (2006). In the second case we fix so that the rotation axis lies parallel to the apparent alignment of the GCs. This rotating “cigar model” represents the case where the cluster system might share the rotation exhibited by the HI disk. Finally we consider a scenario in which the GCs have kinematic properties separate from those of the spheroid and the HI disk, and exhibit no net rotation signal (i.e., in Equation 10 is set to zero and the problem is reduced to one with only two free parameters). This outcome would match that inferred by Hwang et al. (2014) from their kinematic study of SC1-SC4.
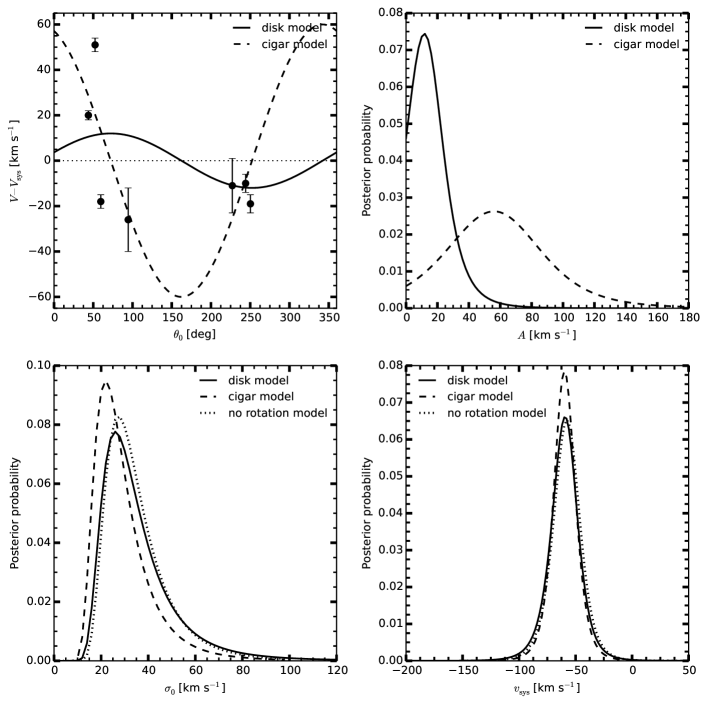
The results of our analysis are shown in Figure 5. The general kinematic picture for this GC system is best described in the top left panel, where the radial velocities of the GCs, corrected for the systemic motion of NGC 6822, are plotted against their position angles. In the same panel the best-fit rotation curves are overplotted, as described by Equation 8, from our two scenarios which allow for rotation. The top right panel shows the marginalized posterior probability distribution functions for the amplitude in these two rotation-enabled models. From these two panels, one can see that the disk model detects a low signature of net rotation, where the most likely amplitude is km s-1 with 68% confidence. The probability of not having any net rotation signal is moderately high according to this model.
For the cigar model, on the other hand, a strong coherent rotation motion is inferred for the GC system. The most likely amplitude is km s-1with 68% confidence. This is quite a surprising result, since any rapidly rotating system ought naturally to form a flattened ellipsoid or disk structure. One possibility is that we are observing a dynamically young system; however, there is at present no evidence that this is true for the NGC 6822 GCs – for example one might expect to see a stellar stream or other tidal debris associated with the clusters. A small amount of experimentation revealed that this rotation signal is most likely a false detection driven by SC3 on the one hand, and SC6 and SC7 on the other. These objects have strong deviations from the mean systemic velocity in opposite directions, and happen to lie either side of the rotation axis when it is arranged parallel to the GC alignment. A small change in the assumed value of in either direction strongly decreases the rotation signal. Because there are only a handful of GCs in the entire system, these few points are able to substantially influence the outcome of the calculation (and indeed we believe it was this numerical instability as moves across the GC alignment that led our original four-parameter analysis to fail).
The lower left and right panels of Figure 5 show the marginalized posterior distributions of the velocity dispersion and the systemic velocity of NGC 6822 . Regardless of the assumed model, the most likely value of is always found to be between -59 and -60 km s-1with 68% confidence intervals of up to km s-1. This is in excellent agreement with the literature value for the systemic velocity of NGC 6822 from McConnachie (2012). The velocity dispersion is also well defined and does not show a large variation depending on the assumed model. Its most likely value is , , km s-1for the cigar model, disk model, and no-rotation model, respectively.
6 The Dynamical Mass of NGC 6822
GCs have a long history of being used as probes for estimating the dynamical masses of the galaxies they surround (e.g. Federici et al., 1990; Federici et al., 1993; Evans & Wilkinson, 2000). We estimate the mass of NGC 6822 using its GCs as dynamical tracers following a common approach (e.g. Woodley et al., 2010; Veljanoski et al., 2013b, 2014). Since we considered three kinematic scenarios, we will use the results of each to estimate the mass of this dwarf galaxy. Solving the Jeans equations (Binney & Tremaine, 1987) is one common approach. Since our rotation-enabled models found a varying degree of rotation in NGC 6822’s GC system, the total mass of this dwarf galaxy can be thought of as the sum from two components: a rotating component, and a non-rotating pressure-supported component.
In the scenarios where a net rotation signature is detected, the rotation component, , is simply calculated via:
| (12) |
where is the rotation amplitude of the GC system, is the projected radius of the outermost constituent, and is the gravitational constant.
The pressure supported mass component is determined using the ‘Tracer Mass Estimator’ (TME) devised by Evans et al. (2003). The TME is mathematically described as:
| (13) |
where is the projected radius from the centre of NGC 6822 for a given GC, is the radial velocity of that GC, corrected for global rotation of the system, while is the systemic radial velocity of NGC 6822 itself. The index loops over each GC in the sample of GCs that have available radial velocities. The constant is dependent on the shape of the underlying gravitational potential, , assumed to be scale-free; the radial distribution of the mass tracers, assumed to be a power law with index ; and the anisotropy of the system. For an anisotropic system, it takes the form:
| (14) |
For , which is typical for a spheroidal stellar halo, becomes:
| (15) |
We consider cases where the slope of the underlying gravitational field, , is set to 0, which assumes an isothermal halo potential for NGC 6822, and to 0.55, as for a NFW profile (Navarro et al., 1996; Watkins et al., 2010). For and we adopt the smallest and largest projected radii, respectively, exhibited by the GCs in our sample. As before, we include the velocity measured for SC4 by Mackey et al. (in prep.); however, we now exclude Hubble-VII from the analysis. If a tracer object having a projected radius of zero is used in the TME, it will produce a singularity in Equation 15. Hubble-VII has a projected radius of just 0.13 kpc, which causes the constant to increase anomalously.
| Model | NGC | Mp [] | Mr [] | Mtotal [] | M/L[/L⊙] | |
|---|---|---|---|---|---|---|
| Disk | 6 | 0 | 40 | |||
| Disk | 6 | 0.55 | 40 | |||
| cigar | 6 | 0 | 400 | |||
| cigar | 6 | 0.55 | 400 | |||
| No rotation | 6 | 0 | 40 | |||
| No rotation | 6 | 0.55 | 30 |
Table 8 lists estimated masses for NGC 6822 within kpc, i.e. the projected radius of the most remote cluster (SC1). The uncertainties of the pressure-supported mass component are calculated via the jackknifing technique, while the uncertainties in the rotation component are only due to the error propagation of the detected amplitude in the relevant scenarios. Total massess estimated assuming the rotating disk and the non-rotating scenario yield similar results, which is unsurprising given the low degree of rotation detected in the disk model. For these cases our measurements yield an estimated mass of , with a corresponding mass-to-light ratio of . These estimates are, however, smaller than those from Hwang et al. (2014) who found the mass of NGC 6822 within 11 kpc to be using four extended clusters only (SC1-SC4). The discrepancy in the estimates is likely due to the large uncertainties in the velocity measurements, in combination with their smaller cluster sample. Still, our inferred mass-to-light ratio makes NGC 6822 a highly dark matter dominated system when compared to other dwarf galaxies of similar luminosity (e.g. Mateo, 1998; McConnachie, 2012; Kirby et al., 2014).
On the other hand, assuming the rotating cigar scenario we estimate the mass of NGC 6822 to be unreasonably high, about , as indicated by the associated mass-to-light ratio. This adds further confidence that the high rotation signal found for this model is indeed a spurious detection.
It is worth acknowledging the caveats regarding the choice of and parameters which feature in the TME. It is unclear whether their assumed values are indeed the right choices when estimating the mass of NGC 6822, thus adding additional uncertainty which is not formally included. Using the same method and identical assumptions, but only 4 extended GCs, Hwang et al. (2014) found the total mass of NGC 6822 enclosed within 11 kpc to be . This most likely indicates that when dealing with a small samples such as this one, the inclusion or exclusion of a single data point can have an important effect on the results. For reference, using the kinematics of the HI gas, Weldrake et al. (2003) found a mass of within kpc from the centre of NGC 6822.
7 Discussion
GCs hosted by dwarf galaxies have been often found to have similar colours as GCs residing in the haloes of massive galaxies (e.g. Kundu & Whitmore, 2001; Larsen et al., 2001; Peng et al., 2006), and our results are in keeping with that. Comparing the optical colours of the GCs hosted by NGC 6822 with those located in the M31 outer halo, it is found that they are all mutually consistent, having . This is also true for the GCs residing in the dwarf elliptical galaxies NGC 147 and NGC 185, located in the outer halo of M31 (Veljanoski et al., 2013a). In terms of their number, extended GCs dominate the population of NGC 6822 and there is a similarity between the mean absolute magnitudes of the extended GCs hosted by NGC 6822 and by M31, which are found to be and , respectively. This may either be a fundamental property of extended GCs in general, or is a result of a bias arising from the faint limit of the survey imaging from which these objects were discovered. Given that some of them lie right at the detection limit, it is possible that the extended GCs have a larger range of absolute magnitudes than observed at present, but the currently available data allows only for the bright end of the luminosity function to be observed, resulting in the low spread and similar values. Nonetheless, the range of luminosities, structures, ages and metallicities spanned by the GCs in NGC6822 is broadly consistent with that observed in the M31 halo population (e.g. Mackey et al., 2006, 2007, 2010a, 2013a, 2013b; Alves-Brito et al., 2009; Sakari et al., 2015).
A number of studies have focused on GC systems hosted by dIrr galaxies outside the Local Group (e.g. Seth et al., 2004; Sharina et al., 2005; Georgiev et al., 2006; Georgiev et al., 2008). They have found that GCs have typical optical colours within the range of , consistent with our measurements. In their study, Georgiev et al. (2008) searched for GCs in 19 nearby (2-8 Mpc) dIrr galaxies using archival HST data. The galaxies in their sample are members of dwarf galaxy associations only, without a dominant massive galaxy nearby. In the final sample of GC candidates that passed all their selection criteria, Georgiev et al. (2008) found an absence of objects having and , i.e. faint and blue GCs. The authors claim that this effect is not due to a bias in their GC selection criteria, nor a bias due to the depth of the imaging, since they are able to identify clusters down to . In NGC 6822 however, there are 2 extended GCs which satisfy these criteria. If such clusters were present in the sample of Georgiev et al. (2008), they were most likely missed because of their low surface brightness as well as their extended morphology.
We have considered three scenarios for the kinematic configuration of the GC system of NGC 6822. As indicated in the previous Section, the so-called “disk” and “no-rotation” models are the most plausible of these. In the disk scenario our analysis provides tentative evidence for a weak rotation signal of amplitude km s-1, although clearly the case of zero rotation is not strongly excluded. It is interesting to note that this putative rotation would be in the same sense as that detected for stars in the underlying stellar spheroid by Demers et al. (2006), and also of a comparable magnitude (although we note that the Demers et al. measurements do not extend to particularly large galactocentric radii). Similarly, the velocity dispersion we infer for the GC system matches closely that determined from the Demers et al. (2006) kinematic sample, once the global rotation has been accounted for (see Hwang et al., 2014). These similarities suggest that the GC system of NGC 6822 is plausibly associated with its stellar spheroid, and indeed this would be consistent with the clear linear alignment of the GCs with the major axis of the spheroid.
Our third kinematic model – the so-called “cigar” model – would imply a large systemic rotation amongst the GC population, although this is strongly sensitive to the precise orientation of the rotation axis. In this case, the sense of rotation would be opposite to that seen for the HI gas by de Blok & Walter (2000); furthermore, the inferred amplitude would be considerably larger than that seen for the HI gas at comparable distances along its major axis to those of the GCs. In the event this model was correct, it would appear that the GCs are not asscociated with the HI gas component of NGC 6822. The GCs could constitute a dynamically young system, in which case a search for a stellar stream along the major axis of the NGC 6822 spheroid may prove fruitful.
8 Summary
In this paper we present a uniform optical and near-IR photometric study of the GC system hosted by NGC 6822. The photometric measurements are used to estimate the ages and metallicities of the GCs via a colour-colour plot and an empirical colour-metallicity relation. All GCs are found to have ages consistent with 9 Gyrs or older, in agreement with past studies. On the other hand, the clusters are found to exhibit a range of metallicities (), at odds with previous spectroscopic studies which found them to be very metal-poor ([Fe/H]). Metallicity measurements from resolved colour-magnitude diagrams would alleviate this tension, as would higher S/N spectroscopy.
We also modelled the kinematics of the GC system using new velocities for six members, two of which had no previous spectroscopic information. With the caveat at our results are based on a small sample, we found tentative evidence for a weak rotation signal of amplitude km s-1 in the case where the rotation axis sits perpendicular to the linear arrangement of the GCs on the sky. However, zero rotation is not strongly excluded by our analysis. If the rotation is real, then it would be in the same sense as inferred for the underlying stellar spheroid by Demers et al. (2006), and of a comparable amplitude. Furthermore, the velocity dispersion we determine for the GC system, km s-1is very similar to that exhibited by stars in the spheroid (see Hwang et al., 2014). These similarities suggest to us that the GCs are plausibly associated with the spheroidal component of NGC 6822.
Finally, using the GCs as dynamical mass tracers, the total mass of NGC 6822 is recalculated to be roughly , subject to various systematic effects due the small data sample and the implicit assumptions built into the TME. The corresponding mass-to-light ratio sits in the range , implying that NGC 6822 hosts a substantial dark matter component.
Acknowledgments
JV and AMNF acknowledge support from an STFC Consolidated Grant awarded to the IfA. JV acknowledges partial support from NOVA. ADM is grateful for support by an Australian Research Fellowship (Discovery Projects Grant DP1093431) from the Australian Research Council. APH was partially supported by Sonderforschungsbereich SFB 881 “The Milky Way System” of the German Research Foundation. We are thankful to Alexander B. Rogers for parallelizing our kinematics code. We are also thankful to Erwin de Blok for kindly providing the data for the HI map used in Figure 1.
The WHT is operated on the island of La Palma by the Isaac Newton Group in the Spanish Observatorio del Roque de los Muchachos of the Instituto de Astrofísica de Canarias.
References
- Alves-Brito et al. (2009) Alves-Brito A., Forbes D. A., Mendel J. T., Hau G. K. T., Murphy M. T., 2009, MNRAS, 395, L34
- Barnard (1884) Barnard E. E., 1884, Astronomische Nachrichten, 110, 125
- Battinelli et al. (2006) Battinelli P., Demers S., Kunkel W. E., 2006, AAp, 451, 99
- Bellazzini et al. (2003) Bellazzini M., Ferraro F. R., Ibata R., 2003, AJ, 125, 188
- Binney & Tremaine (1987) Binney J., Tremaine S., 1987, Galactic dynamics. Princeton, NJ, Princeton University Press
- Bressan et al. (2012) Bressan A., Marigo P., Girardi L., Salasnich B., Dal Cero C., Rubele S., Nanni A., 2012, MNRAS, 427, 127
- Cantiello & Blakeslee (2007) Cantiello M., Blakeslee J. P., 2007, ApJ, 669, 982
- Casali et al. (2007) Casali M. et al., 2007, AAp, 467, 777
- Chandar et al. (2000) Chandar R., Bianchi L., Ford H. C., 2000, AJ, 120, 3088
- Cioni et al. (2008) Cioni M.-R. L. et al., 2008, AAP, 487, 131
- Cohen & Blakeslee (1998) Cohen J. G., Blakeslee J. P., 1998, AJ, 115, 2356
- Côté et al. (1998) Côté P., Marzke R. O., West M. J., 1998, ApJ, 501, 554
- Côté et al. (2000) Côté P., Marzke R. O., West M. J., Minniti D., 2000, ApJ, 533, 869
- Côté et al. (2001) Côté P. et al., 2001, ApJ, 559, 828
- de Blok & Walter (2000) de Blok W. J. G., Walter F., 2000, ApJL, 537, L95
- de Blok & Walter (2006) de Blok W. J. G., Walter F., 2006, AJ, 131, 343
- Demers et al. (2006) Demers S., Battinelli P., Kunkel W. E., 2006, ApJL, 636, L85
- Dotter et al. (2011) Dotter A., Sarajedini A., Anderson J., 2011, ApJ, 738, 74
- Dotter et al. (2010) Dotter A. et al., 2010, ApJ, 708, 698
- Evans & Wilkinson (2000) Evans N. W., Wilkinson M. I., 2000, MNRAS, 316, 929
- Evans et al. (2003) Evans N. W., Wilkinson M. I., Perrett K. M., Bridges T. J., 2003, ApJ, 583, 752
- Federici et al. (1993) Federici L., Bonoli F., Ciotti L., Fusi-Pecci F., Marano B., Lipovetsky V. A., Niezvestny S. I., Spassova N., 1993, AAp, 274, 87
- Federici et al. (1990) Federici L., Marano B., Fusi Pecci F., 1990, AAp, 236, 99
- Flores-Durán et al. (2014) Flores-Durán S. N., Peña M., Hernández-Martínez L., García-Rojas J., Ruiz M. T., 2014, AAp, 568, A82
- Georgiev et al. (2008) Georgiev I. Y., Goudfrooij P., Puzia T. H., Hilker M., 2008, AJ, 135, 1858
- Georgiev et al. (2006) Georgiev I. Y., Hilker M., Puzia T. H., Chanamé J., Mieske S., Goudfrooij P., Reisenegger A., Infante L., 2006, AAp, 452, 141
- Górski et al. (2011) Górski M., Pietrzyński G., Gieren W., 2011, AJ, 141, 194
- Hempel et al. (2003) Hempel M., Hilker M., Kissler-Patig M., Puzia T. H., Minniti D., Goudfrooij P., 2003, AAp, 405, 487
- Hodge et al. (1991) Hodge P., Smith T., Eskridge P., MacGillivray H., Beard S., 1991, ApJ, 379, 621
- Hodge (1977) Hodge P. W., 1977, ApJS, 33, 69
- Hodgkin et al. (2009) Hodgkin S. T., Irwin M. J., Hewett P. C., Warren S. J., 2009, MNRAS, 394, 675
- Hubble (1925) Hubble E. P., 1925, ApJ, 62, 409
- Huxor et al. (2011) Huxor A. P. et al., 2011, MNRAS, p. 452
- Huxor et al. (2013) Huxor A. P., Ferguson A. M. N., Veljanoski J., Mackey A. D., Tanvir N. R., 2013, MNRAS, 429, 1039
- Huxor et al. (2014) Huxor A. P. et al., 2014, ArXiv e-prints
- Huxor et al. (2008) Huxor A. P., Tanvir N. R., Ferguson A. M. N., Irwin M. J., Ibata R., Bridges T., Lewis G. F., 2008, MNRAS, 385, 1989
- Huxor et al. (2005) Huxor A. P., Tanvir N. R., Irwin M. J., Ibata R., Collett J. L., Ferguson A. M. N., Bridges T., Lewis G. F., 2005, MNRAS, 360, 1007
- Hwang et al. (2011) Hwang N., Lee M. G., Lee J. C., Park W.-K., Park H. S., Kim S. C., Park J.-H., 2011, ApJ, 738, 58
- Hwang et al. (2014) Hwang N., Park H. S., Lee M. G., Lim S., Hodge P. W., Kim S. C., Miller B., Weisz D., 2014, ApJ, 783, 49
- Keller et al. (2012) Keller S. C., Mackey D., Da Costa G. S., 2012, ApJ, 744, 57
- Kirby et al. (2014) Kirby E. N., Bullock J. S., Boylan-Kolchin M., Kaplinghat M., Cohen J. G., 2014, MNRAS, 439, 1015
- Kissler-Patig et al. (2002) Kissler-Patig M., Brodie J. P., Minniti D., 2002, AAp, 391, 441
- Kundu & Whitmore (2001) Kundu A., Whitmore B. C., 2001, AJ, 121, 2950
- Larsen et al. (2001) Larsen S. S., Forbes D. A., Brodie J. P., 2001, MNRAS, 327, 1116
- Law & Majewski (2010) Law D. R., Majewski S. R., 2010, ApJ, 718, 1128
- Mackey et al. (2010a) Mackey A. D. et al., 2010a, MNRAS, 401, 533
- Mackey & Gilmore (2004) Mackey A. D., Gilmore G. F., 2004, MNRAS, 355, 504
- Mackey et al. (2006) Mackey A. D. et al., 2006, ApJL, 653, L105
- Mackey et al. (2007) Mackey A. D. et al., 2007, ApJL, 655, L85
- Mackey et al. (2010b) Mackey A. D. et al., 2010b, ApJL, 717, L11
- Mackey et al. (2013a) Mackey A. D. et al., 2013a, MNRAS, 429, 281
- Mackey et al. (2013b) Mackey A. D. et al., 2013b, ApJL, 770, L17
- Mackey et al. (2014) Mackey A. D. et al., 2014, MNRAS, 445, L89
- Mackey & van den Bergh (2005) Mackey A. D., van den Bergh S., 2005, MNRAS, 360, 631
- Magnier (2006) Magnier E., 2006, in The Advanced Maui Optical and Space Surveillance Technologies Conference.
- Marín-Franch et al. (2009) Marín-Franch A. et al., 2009, ApJ, 694, 1498
- Mateo (1998) Mateo M. L., 1998, ARAA, 36, 435
- McConnachie (2012) McConnachie A. W., 2012, AJ, 144, 4
- Muñoz et al. (2014) Muñoz R. P. et al., 2014, ApJS, 210, 4
- Navarro et al. (1996) Navarro J. F., Frenk C. S., White S. D. M., 1996, ApJ, 462, 563
- Onaka et al. (2008) Onaka P., Tonry J. L., Isani S., Lee A., Uyeshiro R., Rae C., Robertson L., Ching G., 2008, in Society of Photo-Optical Instrumentation Engineers (SPIE) Conference Series.
- Peng et al. (2006) Peng E. W. et al., 2006, ApJ, 639, 95
- Puzia et al. (2002) Puzia T. H., Zepf S. E., Kissler-Patig M., Hilker M., Minniti D., Goudfrooij P., 2002, AAp, 391, 453
- Sakari et al. (2015) Sakari C. M., Venn K. A., Mackey D., Shetrone M. D., Dotter A., Ferguson A. M. N., Huxor A., 2015, MNRAS, 448, 1314
- Schlafly & Finkbeiner (2011) Schlafly E. F., Finkbeiner D. P., 2011, ApJ, 737, 103
- Schlafly et al. (2012) Schlafly E. F. et al., 2012, ApJ, 756, 158
- Schlegel et al. (1998) Schlegel D. J., Finkbeiner D. P., Davis M., 1998, ApJ, 500, 525
- Searle & Zinn (1978) Searle L., Zinn R., 1978, ApJ, 225, 357
- Seth et al. (2004) Seth A., Olsen K., Miller B., Lotz J., Telford R., 2004, AJ, 127, 798
- Sharina et al. (2005) Sharina M. E., Puzia T. H., Makarov D. I., 2005, AAp, 442, 85
- Stiavelli et al. (2004) Stiavelli M., Fall S. M., Panagia N., 2004, ApJ, 600, 508
- Stonkutė et al. (2008) Stonkutė R. et al., 2008, AJ, 135, 1482
- Tonry & Davis (1979) Tonry J., Davis M., 1979, AJ, 84, 1511
- Tonry & Onaka (2009) Tonry J., Onaka P., 2009, in Advanced Maui Optical and Space Surveillance Technologies Conference.
- Tonry et al. (2012) Tonry J. L. et al., 2012, ApJ, 750, 99
- van der Wel et al. (2011) van der Wel A. et al., 2011, ApJ, 742, 111
- Veljanoski et al. (2013a) Veljanoski J. et al., 2013a, MNRAS, 435, 3654
- Veljanoski et al. (2013b) Veljanoski J. et al., 2013b, ApJL, 768, L33
- Veljanoski et al. (2014) Veljanoski J. et al., 2014, MNRAS, 442, 2929
- Watkins et al. (2010) Watkins L. L., Evans N. W., An J. H., 2010, MNRAS, 406, 264
- Weldrake et al. (2003) Weldrake D. T. F., de Blok W. J. G., Walter F., 2003, MNRAS, 340, 12
- Woodley et al. (2010) Woodley K. A., Gómez M., Harris W. E., Geisler D., Harris G. L. H., 2010, AJ, 139, 1871
- Zinn (1993) Zinn R., 1993, in Smith G. H., Brodie J. P., eds, Astronomical Society of the Pacific Conference Series Vol. 48, The Globular Cluster-Galaxy Connection. p. 38