The effect of stellar feedback on a Milky Way-like galaxy and its gaseous halo
Abstract
We present the study of a set of N-body+SPH simulations of a Milky Way-like system produced by the radiative cooling of hot gas embedded in a dark matter halo. The galaxy and its gaseous halo evolve for 10 Gyr in isolation, which allows us to study how internal processes affect the evolution of the system. We show how the morphology, the kinematics and the evolution of the galaxy are affected by the input supernova feedback energy , and we compare its properties with those of the Milky Way. Different values of do not significantly affect the star formation history of the system, but the disc of cold gas gets thicker and more turbulent as feedback increases. Our main result is that, for the highest value of considered, the galaxy shows a prominent layer of extra-planar cold () gas extended up to a few kpc above the disc at column densities of . The kinematics of this material is in agreement with that inferred for the H I halos of our Galaxy and NGC 891, although its mass is lower. Also, the location, the kinematics and the typical column densities of the hot () gas are in good agreement with those determined from the O VI absorption systems in the halo of the Milky Way and external galaxies. In contrast with the observations, however, gas at is lacking in the circumgalactic region of our systems.
keywords:
methods: numerical – Galaxy: evolution – Galaxy: halo – ISM: kinematics and dynamics1 Introduction
Numerical simulations constitute a fundamental tool to understand the processes of galaxy formation and evolution. Simulations of isolated systems have proved to be very powerful to investigate the physics on galactic scales, and they have been widely used in the last decade to interpret the secular evolution of discs (e.g. Debattista et al., 2006; Combes, 2008), to study the role of stellar feedback (e.g. Stinson et al., 2006; Dalla Vecchia & Schaye, 2008, 2012), and to understand the effect of major and minor mergers on the morphology and dynamics of galaxies (e.g. Villalobos & Helmi, 2009; Bois et al., 2011).
Simulations can be used to address a long-standing question in the theory of galaxy evolution, namely how disc galaxies are able to sustain star formation for a Hubble time without consuming their gas reservoir. In our Galaxy, for instance, the star formation rate (SFR) of the solar neighborhood has remained almost constant for the last (Twarog, 1980; Aumer & Binney, 2009), implying that the gas consumed by star formation is continuously replenished. More generally, there is evidence that galaxies, at all times, must have accreted gas at a rate proportional to their SFR density (Hopkins et al., 2008; Fraternali & Tomassetti, 2012). However, there is little observational evidence for cold (H I) gas accretion occurring onto galaxies at the required rate (e.g. Sancisi et al., 2008).
CDM cosmological simulations made a major breakthrough in this field by revealing the modes by which galaxies may accrete their gas from the cosmic web. Low-mass halos are expected to accrete material through the so-called ‘cold-mode’, where filaments of gas at relatively low temperature () are able to penetrate the halos down to the centre and feed directly the formation of the central galaxy (e.g. Kereš et al., 2009). In massive halos, instead, accreting filaments get shock-heated and settle into a rarefied atmosphere of plasma at the virial temperature of the halo, often called coronae (White & Rees, 1978; Crain et al., 2010). Because of the hierarchical formation of structures, the high-redshift universe is expected to be dominated by the cold-mode accretion, which is progressively replaced by the ‘hot-mode’ as structures grow (Kereš et al., 2005; Dekel & Birnboim, 2006). Massive disc galaxies at redshift - including the Milky Way - are therefore expected to be surrounded by a large amount of rarefied hot gas - the so-called ‘coronae’ - which would constitute a vast reservoir of material to fuel star formation.
Simulations also reveal that feedback from stars and active galactic nuclei (AGN) plays a fundamental role in the evolution of galaxies. In most cases, stellar feedback on a galactic scale slows down the star formation in the disc (‘negative’ feedback) (Stinson et al., 2006, hereafter S06) and produces outflows of hot gas from the disc to the halo (Dalla Vecchia & Schaye, 2008). On a cosmological scale, stellar and AGN feedback are used to solve the mismatch between the halo mass function and the galaxy mass function by quenching star formation in both low-mass and high-mass systems. Additionally, stellar feedback pollutes the circumgalactic medium (CGM111In this paper the terms CGM and corona have two different meanings: the first refers to all the gas that surrounds a galaxy disc, the second specifically refers to the hot ( virial-temperature) plasma that settles in equilibrium around the galaxy and is built by the hot-mode accretion.) with metals and produces absorption-line systems consistent with those observed around galaxies in the spectra of background sources (e.g. Stinson et al., 2012). In general, the tuning of feedback in state-of-the-art cosmological simulations nowadays allows a much better match with the observations with respect to the recent past (see Vogelsberger et al., 2014; Schaye et al., 2015).
Despite the importance of feedback processes, there is no general consensus on how they must be implemented in numerical simulations. This is due to two reasons. On the one hand, these processes occur on scales (both spatial and temporal) that are commonly unresolved by the current generation of simulations. This leads to a plethora of different numerical recipes that attempt to approximate the physics of feedback on such ‘sub-grid’ scales, often delivering different outcomes despite the similarities of the initial conditions (Scannapieco et al., 2012). On the other hand, the amount of mechanical and thermal energy deposited into the surrounding gas by these processes is very difficult to constrain observationally. This implies that the feedback energy is treated as a free parameter, which can be tuned ad-hoc to reproduce the observations. Even though state-of-the art feedback recipes are attempting to address these issues (e.g. Keller et al., 2014), a final solution has still to be found.
In this paper we investigate how the properties of a Milky Way-like system surrounded by its CGM are affected by stellar feedback. Our system is produced by the radiative cooling of a rotating hot gas component (a corona) embedded in a NFW dark matter halo. The gas at the bottom of the potential well cools and settles into a disc, eventually reaching the density required to form stars and producing feedback from supernovae and winds. The system constituted by the cold, star-forming disc and the hot CGM evolves in isolation for . Thus the properties of the final object are affected only by the interplay between these two components. This allows us to study the impact of internal processes (like stellar feedback from the disc and radiative cooling of the corona) on the evolution of a Milky Way-like galaxy. The novelties of our work with respect to previous studies of simulations of isolated systems are the followings: a) our galaxies are surrounded by an extended hot corona, which mimics the hot-mode epoch of gas accretion that galaxies like the Milky Way have experienced since redshift of (i.e. lookback time of ); and b) we present a direct comparison of the gas component with real data of the Milky Way by treating the simulated system like an observation.
The paper is structured as follows. In Section 2 we present the simulations used in this work. In Section 3 we describe the morphology, the mass distribution, the kinematics and the gas circulation in these systems. In Section 4 we focus on the gaseous components and mimic observations of the simulations in order make a direct comparison between them and the Milky Way. In Section 5 we discuss the results obtained. We present our conclusions in Section 6.
2 The simulations
The simulations are run with the N-body + SPH code GASOLINE (Wadsley et al., 2004). The initial conditions are set as in Roškar et al. (2008). We considered a spherical NFW dark matter halo with virial radius () of and virial mass of . Note that these values are perfectly compatible with recent estimates of the Galactic dark matter halo (e.g. McMillan, 2011). The halo has an embedded spherical corona of hot gas containing of the total mass and following the same density distribution. This corona is initially in hydrostatic equilibrium for an adiabatic equation of state, and has a spin parameter of (Bullock et al., 2001; Macciò et al., 2007) with specific angular momentum , where is the cylindrical radius. Both gas and dark matter components are described by particles. Gas particles have initial mass of and softening length of , while dark matter particles have softening of and masses of either or , depending on whether they are inside or outside . The initial gas is comprised of a mixture of hydrogen and helium, with no metals.
At the beginning of the simulation radiative cooling is switched-on, allowing the central, densest region of the hot gas to cool and settle into a disc. Star formation and stellar feedback from SNII, SNIa and stellar winds are implemented according to the recipes of S06, and the system is followed up to . We use a base timestep Myr with a refinement parameter such that timesteps satisfy , where is the softening parameter (set to 50 pc for baryons and 100 pc for dark matter) and is the acceleration a particle experiences. Gas particles also satisfy the timestep condition , where , is the SPH smoothing length, is the shear coefficient, which is set to 1, is the viscosity coefficient and is described in Wadsley et al. (2004). The SPH smoothing kernel encloses the 32 nearest neighbours. We use an opening angle for gravity of . Star formation is triggered at a number density , temperature K and provided the gas particle is part of a converging flow; efficiency of star formation is 0.05 per dynamical time. Star particles form with an initial mass of that of the gas particle. Once the mass of a gas particle drops below of its initial mass, the remaining mass is distributed amongst the nearest neighbors. Star particles are assumed to constitute an entire stellar population with a Miller-Scalo (Miller & Scalo, 1979) initial mass function. Feedback from SNII follows a blast-wave recipe where thermal energy is injected into the surrounding gas and, in addition, gas particles within the blast-wave radius have their cooling switched off for a time of the order of (for details see S06). Stellar feedback also pollutes the interstellar medium with metals, whose main impact in the simulation is to affect the cooling timescale of the gas. We adopt a metallicity-dependent cooling function using the prescription of Shen et al. (2010). Metal cooling rates depend on density, temperature and metallicity and computed from tabulated rates. Metallicity cooling would lead to very low temperatures () if allowed to proceed unhindered. However below the Jeans mass then becomes comparable to for reasonable densities, which is much below our mass resolution. In order to prevent the artificial fragmentation that would result, we follow Agertz et al. (2009) in setting a pressure floor .
As we are interested in distinguishing between gas particles that have been ejected into the halo by stellar feedback and those that remain in the CGM throughout, we do not allow metals (or thermal energy) to diffuse from a given gas particle to the surrounding ones. With this choice, all particles have zero metal abundance as long as they are not directly affected by SN feedback and stellar winds from the disc. In order to test whether this choice severely affects our results, we re-ran one of the simulations (F40, see Section 1) by implementing metal and thermal diffusion and we found no significant differences in terms of star formation history and star/gas surface density profile with respect to the non-diffusive version. Therefore we preferred to neglect thermal and metal diffusion in the simulations.
The version of GASOLINE used in this work does not include the most recent improvements made by Hopkins (2013) or Hobbs et al. (2013) in the SPH numerical scheme. This choice makes it easier to compare our findings with the results obtained in previous studies. Hopkins pointed out that, in astrophysical contexts, sub-grid physics is what primarily shapes the outcome of a simulation rather than the numerical scheme adopted. Our simulated galaxies do not seem to show overcooling in their circumgalactic medium, an issue that seems to be caused by the inefficient phase mixing of the classical SPH scheme. In addition, the lack of significant differences between the run with and without thermal diffusion indicates that the details of gas mixing are not crucial to our setup.
2.1 Star formation history and masses
Using the setup described, we produce four different models: F80, F40, F10 and F2.5. Each model uses the same initial conditions but differs by the amount of (thermal) energy injected by SNe II into the interstellar medium (ISM), with F80 being the most energetic model ( of the canonical erg per supernova is transferred to the ISM). The main physical parameters of the four galaxies after of evolution are presented in Table 1. Note that, in terms of stellar and halo masses, all our simulated galaxies are comparable to the Milky Way (e.g. Sofue et al., 2011).
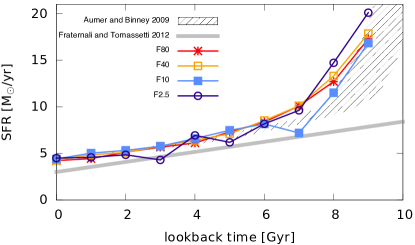
Fig. 1 compares the star formation history (SFH) of all the simulations with those derived for the Milky Way by Aumer & Binney (2009) (double exponential model) and Fraternali & Tomassetti (2012). The former SFH is based on the kinematics and colours of the stars in the solar neighborhood, while the latter is valid for the whole Galaxy and is obtained by assuming a linear trend with lookback time. Note that the model of Aumer & Binney is normalised to the SFR of our systems at t=10 Gyr, while Fraternali & Tomassetti (2012) assume a current SFR of . In all models the SFR is in good agreement with that inferred by Aumer & Binney (2009) at all times, and only slightly above that predicted by Fraternali & Tomassetti for the last . This is an important starting point for the detailed comparison between the Galaxy and the simulations.
| Simulation | F80 | F40 | F10 | F2.5 | units |
|---|---|---|---|---|---|
| SF ratea |
-
a
evaluated by considering the amount of stars born in the last 50 Myr.
2.2 Neutral gas fraction
Since the simulations did not use radiative transfer, there is no direct way to distinguish between neutral and ionised gas. In order to estimate the neutral and ionised gas fractions, we assume simple collision ionisation equilibrium (CIE), and define as ‘neutral’ the gas particles with a temperature below (see Sutherland & Dopita, 1993). The neutral hydrogen mass is then derived by assuming a universal hydrogen abundance fraction of . We make no distinction between atomic and molecular gas in the simulations.
A more elaborate approach is the following. Using -body+SPH cosmological simulations post-processed with radiative transfer, Rahmati et al. (2013) found that, at each epoch, a relation between particle density and photo-ionization rate exists. We use this relation (tuned for redshift ) to derive the neutral gas fraction for each gas particle in the simulations, assuming an UV background radiation field based on the model of Haardt & Madau (2001) (for details see Appendix A of Rahmati et al., 2013). The comparison between the total maps of neutral gas derived with these two approaches revealed almost no differences, thus for simplicity we chose to adopt the former simpler method.
3 Results
3.1 Morphology
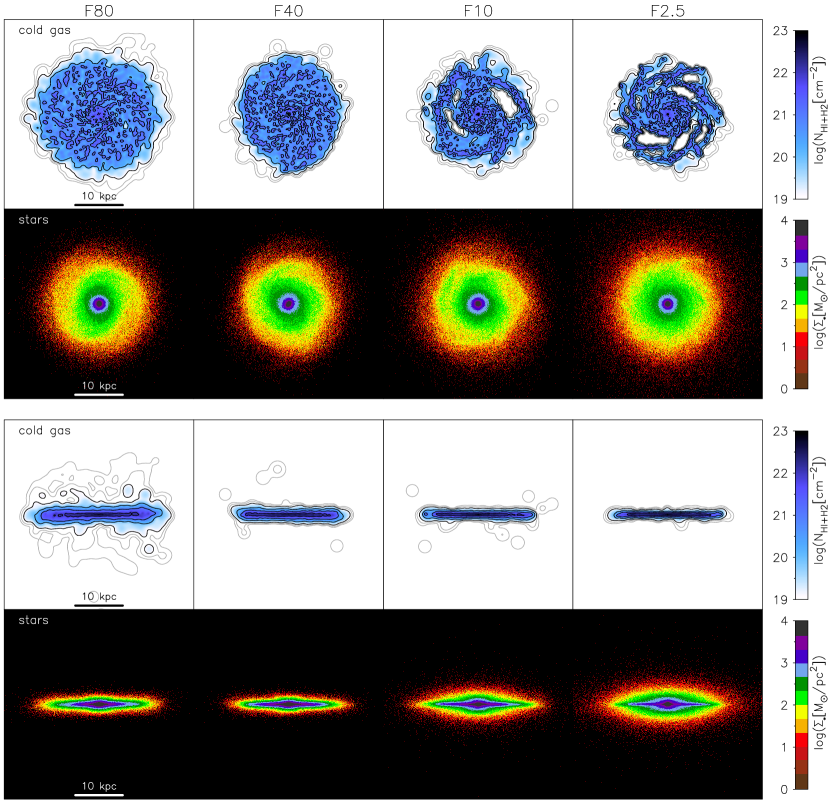
Fig. 2 shows the final images of the neutral hydrogen (atomic+molecular) and of the stellar component, in face-on and edge-on projections, for all the simulated galaxies analyzed. The maps of the gas component are derived by smoothing each particle using a Gaussian kernel with FWHM equal to the smoothing length of that particle. This gives to these maps a ‘smooth’ appearance that is not present in the maps of the stellar component.
The face-on view reveals that the gaseous discs are extended roughly as much as their respective stellar component, ranging from in F2.5 up to in F80 at the column density level of (outermost black contour). Sizes do not increase further at (outermost grey contour), suggesting that the cold gas discs are truncated and gas at larger radii is too hot to be neutral. This truncation is not due to the temperature threshold adopted to define the neutral gas phase, as maps derived by using a more refined approach (see Section 2.2) show the same features at these column densities. Spirals are visible in all the gas maps, but the contrast between arm and inter-arm regions increases with decreasing feedback. An extreme case is F2.5, where the inter-arm regions show extended holes in the neutral gas distributions. When seen face-on, stellar discs are relatively more similar to each other. Spiral features in the gaseous and stellar component of F2.5 are well correlated.
Compared to the size of the H I disc of the Milky Way ( at the column density of , see Kalberla & Kerp, 2009), the discs of cold gas in the simulations are too small. In general, they appear to fall outside the H I mass-scale relation (e.g. Broeils & Rhee, 1997). Since in the models the discs of cold gas are produced by the cooling of the spinning hot halos, their size will depend on how the angular momentum is spatially distributed in these media. We have assumed that rotation in the corona is distributed as , which is arbitrary and probably influences the size of the gas disc. Additionally, mergers and cold flows may also modify the angular momentum distribution in the corona, and in fact Wang et al. (2014) successfully reproduced the H I mass-scale relation by using cosmological simulations in CDM paradigm. Hence, we do not consider the size of the H I discs as a prediction of the simulations.
The most striking features arise when the systems are projected to an edge-on view. Gaseous discs respond to the change in feedback by modifying their thickness. This happens because high values of imply a larger injection of thermal energy inside the disc, which produces more turbulence in the ISM and consequently thickens the gas layer. A few extra-planar gas features are visible already in F40 and F10 at column density lower than ; however, in F80 a thick extra-planar component is visible above and is even more remarkable at , where it extends up to from the midplane. This thick extra-planar component is remarkably similar to that observed in H I for the nearby disc galaxy NGC 891 (Oosterloo et al., 2007), although its column density is about one order of magnitude lower. In Section 4.2 we show that not only the morphology but also the kinematics are similar. The stellar components follow the opposite trend, as stellar discs get significantly thicker (i.e., hotter) as feedback decreases. In Section 5.1 we show that our runs with lower feedback tend to form more stars at early times. These stars have a longer time to heat vertically, ending up at larger heights. A more detailed analysis of this feature will be presented elsewhere.
3.2 Mass distribution and kinematics
The mass distribution and the kinematics of the simulated galaxies are derived by using an approach similar to the ‘tilted ring’ method that is often adopted to model the velocity fields of H I observations (e.g. Begeman, 1987). We focus on the disc of neutral gas, and divide it into a series of concentric rings, each one with a given distance with respect to the centre. This latter is unique and it is given by the mass centre of the dark matter distribution. A generic ring at distance from the centre is oriented perpendicular to the angular momentum vector of the neutral gas particles located at that distance from the centre. Therefore, the difference of our approach with respect to the classical tilted-ring method is that the rings follow the actual three dimensional distribution of gas particles rather than the inclination and position angle inferred from the velocity field. We follow the orientation of each ring in order to properly evaluate the rotation velocity, the velocity dispersion and the mass surface density for all the components as a function of radius. This approach can easily capture symmetric warps of the gas component, although non-axisymmetric features may not be treated properly. However, none of the models show warps in the neutral gas distribution (see Fig. 2). Also, since this approach relies on the neutral gas alone to infer the inclination of the various rings, it can fail if the disc of stars and gas are significantly misaligned. This is also not the case for these models.
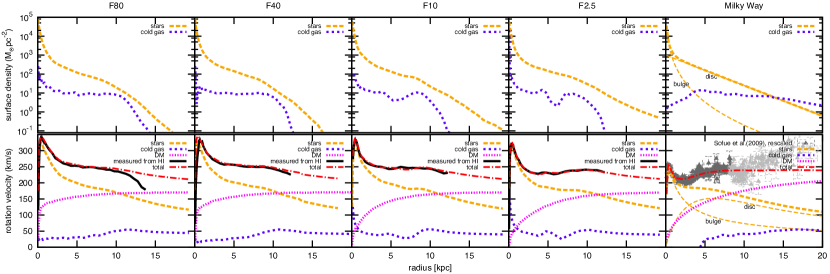
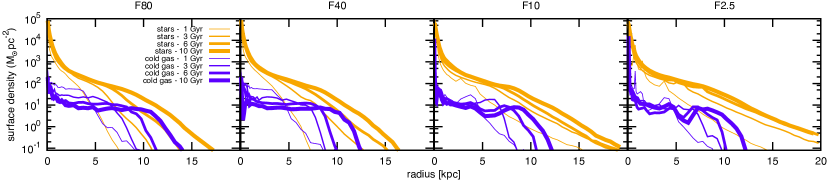
Fig. 3 shows the gas and stellar surface densities (top row) and the decomposed rotation curves of cold gas (bottom row), and a comparison with a mass-decomposition of our Galaxy. To derive this latter, we assumed that the Galactic gravitational potential is produced by four components: a stellar bulge, an double-exponential stellar disc, a NFW dark matter halo and a disc of cold gas. Despite the strong evidence for a ‘peanut-shaped’ boxy-bulge in the Milky Way (e.g. Dwek et al., 1995; Nataf et al., 2010; McWilliam & Zoccali, 2010; Ness et al., 2012), a de Vaucouleurs bulge provides a very good fit to the Galaxy’s rotation curve (Sofue et al., 2009). As modelling the stellar distribution and kinematics of the inner Galaxy is beyond the purpose of this work, for simplicity we decided to adopt the classical de Vaucouleurs profile to describe the Galactic bulge. We fitted the parameters of these components to the Milky Way’s rotation velocity data of Sofue et al. (2009), which we rescaled to more up-to-date values of the Galactic constants and (McMillan, 2011). As the rotation curve in the outer disc is very uncertain, we assumed that the rotation velocity flattens at and discarded the data points in that region (light-grey points in Fig. 3). We used the cold gas (H I+H2, plus a correction for the He) surface density of Binney & Merrifield (1998) and we kept it fixed in our fit. In addition, we constrained the total baryonic surface density at to be in the range (Read, 2014). The details of this mass decomposition will be presented in Marasco & Fraternali (in prep).
The cold gas (H I+H2) surface density profiles of the simulated systems are all flat at the level of (or ), and increase by one order of magnitude close to the centre where star-forming gas piles up. All profiles are truncated, as at about the surface density decreases by two orders of magnitude in a small (2-3 kpc) region. This is different from what has been found in the Milky Way, where the cold gas fades gently as the radius increases. All simulated stellar profiles show the presence of a mass concentration in the centre due to a bulge. We notice that the central stellar surface density increases slightly with feedback, from in F2.5 to in F80. Outside the region of the bulge, stars distribute in a disc that seems to show, in all simulated systems, a double exponential profile, with the break between the two slopes occurring approximately where gaseous discs are truncated. This is not surprising: stars located beyond the gaseous discs must have been transported to that location by radial migration via transient spiral corotation capture (Sellwood & Binney, 2002; Roškar et al., 2008). A break in the slope of stellar profile has been observed in several galaxies (e.g. Kregel et al., 2002) and it is possibly present in the Milky Way as well (Sale et al., 2010; Minniti et al., 2011). Note that the Galactic H I disc also seems to be truncated at (Kalberla & Dedes, 2008), although this truncation is shallower than that shown by our simulated galaxies. Truncated H I discs are sometimes observed in external galaxies, but they are thought to be caused by photo-ionization from the extragalactic UV background (e.g. Maloney, 1993) rather then by an effective drop in cold gas density.
The rotation curves, derived by measuring the actual rotation velocity of cold gas particles in the various rings (black lines), show several interesting features. All rotation profiles are steeply rising up to and then decline and flatten to about beyond . The Milky Way rotation curve has a similar shape, but the innermost peak reaches a lower value (slightly above ) and it flattens to a slightly lower rotational speed, whose precise value depends on the choice of the local standard of rest rotational velocity (here assumed to be , see McMillan, 2011). Using the particle distribution in the simulation it is possible to compute the gravitational potential and therefore to derive the circular rotation for all the mass components separately. In all models, the dynamics of the system is driven by the stellar component out to the radius where the gaseous disc is truncated. Beyond that point, the dark matter becomes the dominant component, while gaseous discs are not dynamically dominant at any radius as is expected in this type of galaxies. As shown in the lower panels of Fig. 3, the neutral gas is in perfect circular rotation except in the outermost regions of F80. However, as we show is Section 4.2, part of the cold gas in these regions is extra-planar and rotates at a slower speed than the gas in the midplane.
The shape of the dark matter profile deserves mention. While the outermost part is similar in all models, the innermost profile rises significantly more steeply when higher feedback energy is coupled to the ISM. This corresponds to a higher mass concentration, baryonic and non-baryonic, in the centre of galaxies with high feedback, and to a higher peak in rotational velocity. This result is surprising as it is opposite to what we expected. Higher feedback has been historically invoked to wash out the mass built-up in the centre of systems (the so-called core-cusp problem, e.g. de Blok, 2010): as baryonic matter is removed from the system centre by stellar feedback, dark matter follows it (e.g. Navarro et al., 1996; Read & Gilmore, 2005; Ogiya & Mori, 2011). Our simulations show the opposite trend, as the central stellar surface densities increases with and consequently compressing the dark matter more in the systems with larger feedback output. This indicates that the feedback scheme adopted is not very efficient in removing low-angular momentum baryons from the system centres: in fact, it promotes their growth. We discuss the impact of stellar feedback on our simulations in more detail in Section 5.1.
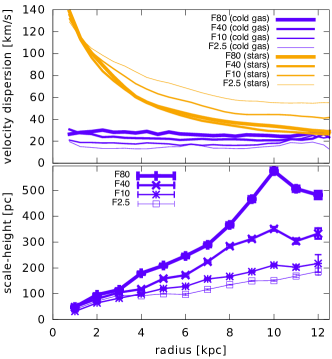
The top panel of Fig. 4 shows the stellar and neutral gas velocity dispersion profile, and , for the different models, computed as
| (1) | |||||
| (2) |
where , and are particle-to-particle velocity dispersions in the various directions (radial, vertical and azimuthal), averaged over all neutral gas particles in each ring, is the mass-averaged temperature of these particles, and is the hydrogen mass.
In all models, is flat and its value depends on the feedback used, with F2.5 being the least turbulent system. F80 has very turbulent motions so that increases up to , larger than that measured for the H I in our Galaxy and in nearby disc galaxies with similar star formation rates (e.g. Boomsma et al., 2008). The velocity dispersion of the stellar component is larger than that of the gas and it increases in the inner regions where the bulge dominates the total surface density. As the edge-on maps suggest (bottom panels of Fig. 2), the thickening of the stellar discs in the models with lower feedback corresponds to a general increase in . At , there is a factor of of difference in between F2.5 and F80.
The bottom panel of Fig. 4 shows the scale-height of cold gas as a function of for the various models. All simulated galaxies show a significant flaring, which is more prominent in the models with higher feedback. The H I scale-height in the inner disc of the Milky Way is between 100 and 200 pc (Dickey & Lockman, 1990), so the cold gaseous disc of F80 is thicker than that of our Galaxy. However, we point out that the gas velocity dispersion, and therefore the scale-height, are resolution dependent. These two quantities are expected to correlate for discs in hydrostatic equilibrium, and in SPH simulations gravity - and therefore hydrostatic equilibrium - cannot be described accurately on scales of the order of the gravitational softening . In all the simulations we adopted for the stars and gas, implying that gravity deviates from Newtonian on scales comparable to the scale-heights of H I discs in galaxies. Thus we stress that, even though the trends shown by the scale-height and velocity dispersion with feedback in the models are certainly genuine, the actual values of these quantities are probably overpredicted as the gravitational restoring force to the plane is underpredicted within a few from the midplane.
3.3 Time-evolution of stars and neutral gas
We evolve the models for . Fig. 5 shows the evolution of the systems. Thinner lines represent earlier stages of the evolution (i.e., larger lookback times). In all systems both gaseous and stellar discs form inside-out. Also, at all times, stellar discs are systematically more extended than cold gaseous discs, with the exception of F80 and F40 at . Stars are born within the cold gas disc then radial migration drives stars outwards, producing the systematic mismatch in sizes. We already noticed in Section 3.2 that stellar discs show a double exponential profile, with the break in the slope occurring at the point where gaseous discs are truncated. Fig. 5 shows that this feature occurs at any time. Stellar migration seems to continuously transfer stars from the place where they are born, the gaseous discs, to outer radii, thus producing the observed double exponential distribution in the stellar profile (see Roškar et al., 2008). Along with stellar discs, gaseous discs also grow inside-out, extending to larger radii at later times. This happens in the simulations because the gas cooling time increases outwards where the density is lower, thus cold gas at large radii becomes available only during the later stage of the evolution of the system (Roškar et al., 2008).
4 Direct comparison with the gas of the Milky Way
In this Section, we focus on the gas component. Our approach is to simulate an ‘observation’ by considering an observer placed inside the disc of the simulated galaxies at from the centre, and studying how - from this specific point of view - gas particles distribute as a function of the angular position in the simulated sky and of the line-of-sight velocity in the local standard of rest (LSR). This ‘pseudo’ LSR is determined by averaging the motion of about star particles around the selected point of view. We stress that this approach allows a direct comparison between the gas component of the simulated systems and that of our Galaxy, for which only 3D position-velocity information are available.
We compare this simulated observation with two different datasets. The neutral gas () is compared with the all-sky H I emission data of the LAB Survey (Kalberla et al., 2005), whereas gas at higher temperatures () is compared with the absorption line measurements of ionized species of Lehner et al. (2012), Sembach et al. (2003) and Savage et al. (2003).
4.1 The H I disc
The LAB Survey is an all-sky datacube of Galactic () H I emission. In order to compare the simulations with the LAB data, we produce a simulated datacube (a ‘modelcube’) by using the following procedure:
-
•
we evaluate the pseudo-LSR as described above;
-
•
in this reference frame, we evaluate the longitude , the latitude and the line-of-sight velocity of each particle. The latitude is chosen to be aligned to the disc midplane, so that this reference frame effectively mimics the Galactic coordinate system.
-
•
We place each particle in a 3D grid () with pixel size equal to that of the LAB data;
-
•
we smooth the neutral gas content of each particle in velocity according to its thermal velocity dispersion .
-
•
we smooth the neutral gas content of each particle according to the desired spatial resolution (see below);
-
•
we convert each pixel of this modelcube to a brightness temperature by assuming an optically thin regime.
The spatial smoothing process deserves further discussion. The ‘natural’ resolution of the simulations is the SPH kernel size, that is the distance between a given particle and its neighbour. If we smooth each particle separately to a spatial resolution equal its SPH kernel size, we assure that the whole simulated box is sampled without discontinuities. However, the smoothing lengths vary significantly from the galaxy centers, where particles crowd and the resolution is high, to the outskirt of the systems, where particles are rarer and the resolution is significantly lower. This effect is dramatically amplified by the inner projection used: we found that, on the midplane, the angular resolution varies from less than at (i.e. in the direction of the galactic centre) up to at . In addition, the angular resolution gets significantly worse at higher latitudes. As we are comparing our modelcubes with data that have a fixed angular resolution, we decided not to use this smoothing method and instead to smooth each particle to a fixed angular resolution by using a 2D Gaussian kernel with a FWHM of .

Fig. 6 shows longitude-velocity () slices taken at three different latitudes ( and ) for our modelcubes, and compare them with the LAB data smoothed at the same spatial resolution (). The H I line profiles of all cubes have been smoothed in velocity by using a Gaussian kernel with a FWHM of in order to emphasize the low-level emission in the LAB data. The midplane () panels show that the velocity spread of the H I emission decreases with decreasing feedback, which can be explained by the drop in discussed in Section 3.2. The main differences between the simulated galaxies and the Milky Way at this latitude are that H I emission in the former reaches larger velocities around and lower velocities around . This happens respectively because a) in the simulations the rotation curves peak at higher velocities than those reached in our Galaxy; b) the gaseous discs are smaller than that of the Milky Way. These considerations apart, from the slice at alone it is not possible to decide which model better resembles the Galactic H I emission.
Moving to different latitudes (top and bottom rows of Fig. 6) it becomes clear that, as feedback decreases, the plots lose more of the sinusoidal shape that is visible in the data. This shape is produced by the rotation of the H I layers located immediately above the midplane and results from the vertical extent and the kinematics of this gas. In the Milky Way, most of the low-level emission visible at these latitudes is due to the extra-planar H I. This medium, which is thought to be produced by the Galactic fountain (Marasco et al., 2012), rotates slower than the gas in the disc and extends up to a few kpc above the midplane (Marasco & Fraternali, 2011). Both these features significantly enhance the sinusoidal shape visible in the LAB data. As a comparison, on each panel we overlaid a thick red contour representing the H I emission (at the level of ) predicted for a differentially rotating disc extended up to and with a scale-height of 150 pc, approximately the value estimated for the thin H I disc of our Galaxy out to (Dickey & Lockman, 1990). For simplicity, we do not attempt to model the warp in the outer H I Galactic disc (e.g. Levine et al., 2006), which at any rate would affect only a small portion of our modelcube (, ). Clearly, most of the low-level emission of the LAB data is located outside this contour. Neither F2.5 nor F10 have extra-planar gas (Section 3.1) and their emission is confined within the contour of the thin disc model. F40 also does not have extra-planar gas, but the average thickness of its disc is larger than 150 pc (bottom panel of Fig. 4) thus some emission leaks outside the red contour. Finally, F80 has a layer of extra-planar gas. Even though at this stage we do not know what the kinematics of this layer is, the fact that emission of F80 is the one that resembles the LAB data best would suggest that the extra-planar material rotates slower than the gas in the thin disc. We show that this is the case in the next Section.
4.2 The extra-planar H I
In the last 10-15 years, deep H I observations reaching column densities of have proved that star-forming disc galaxies often show a vertically extended extra-planar H I component (or ‘thick H I discs’, e.g. Fraternali et al., 2002; Barbieri et al., 2005; Gentile et al., 2013). Our Galaxy is not an exception (Marasco & Fraternali, 2011). A detailed modelling of this component reveals that its rotational velocity decreases with increasing distance from the midplane. These kinematics can be explained by a model of the galactic fountain (Bregman, 1980) interacting with an ambient medium at a lower specific angular momentum than that of the disc (Fraternali & Binney, 2008).
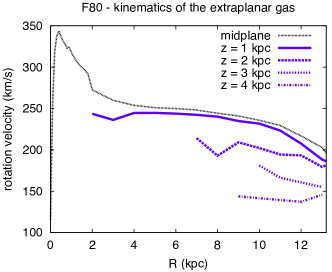
F80 is the only simulated system that shows a prominent thick H I disc. We directly evaluate the rotation curves above the disc: Fig. 7 compares the rotation curve of cold gas derived in the midplane of F80 with those obtained at larger heights. Rings with less than 10 cold gas particles have been neglected. The figure clearly shows that the larger is the distance from the midplane, the slower is the rotation. At above the midplane, the difference in rotational speed with respect to the midplane is about , corresponding to a lag of , in remarkable agreement with that found by Marasco & Fraternali (2011) for the H I halo of the Milky Way and by Oosterloo et al. (2007) for NGC 891. We discuss the origin of this rotational lag in Section 5.2. Fig. 7 also shows that this component is not present in the innermost region of the disc, pointing to an H I halo with a toroidal shape. This is expected in the galactic fountain mechanism, as the gravitational restoring force of the disc decreases outwards making it easier for H I gas to reach larger distances from the plane (Fraternali & Binney, 2006). We found that all the cold gas particles that form the extra-planar gas layer have non-zero metallicity, indicating that this material originated inside the disc. Specifically, the metal abundance of this component is the same as the underlying disc at all radii, which implies that neutral gas ejected from the disc by stellar feedback does not significantly change its galactocentric distance during its trajectory.
In our systems, cold gas is absent at large distances from the discs (see Fig. 9). On the one hand, this is in contrast with the results of the COS-Halo Survey (Tumlinson et al., 2013), which revealed that cold, photo-ionized absorption systems are widespread around galaxies (Werk et al., 2013; Werk et al., 2014). On the other hand, the dense H I clumps that were ubiquitous in the CGM of galaxies in previous SPH simulations (e.g. Kaufmann et al., 2006, 2009) are not present in our simulations. This in agreement with the results of Pisano et al. (2011), who show the lack of massive H I floating clouds at large distances from galaxies in Local-group-like systems.
4.3 The warmhot gas
By analyzing the spectra of background sources, a number of studies have revealed the presence of absorption systems of ionized species (Si III, Si IV, C IV, O VI) at (e.g. Wakker et al., 2003; Lehner et al., 2012). The global kinematics of these absorbers is not consistent with being part of the Galaxy disc, which makes of these systems an ionized counterpart of the classical H I High-Velocity Clouds. All these ionized species are expected to exist at a temperature well below the Milky Way’s virial temperature. Hence, a natural explanation for these absorbers is that they are produced by the cooling of the CGM of the Milky Way and represent a strong evidence for accretion of ionized gas onto the Galaxy disc (Lehner & Howk, 2011; Fraternali et al., 2013).
We now compare the position-velocity distribution and the column densities of these systems with those predicted for the warm-hot () gas in the simulation with the highest feedback (F80) which already shows a layer of extra-planar cold gas in good agreement with the observations. In addition, we use the full 6D information available in the simulation to determine the location of the absorbing material. As we will remark during our analysis, our results remain valid also for the runs with lower feedback.
4.3.1 Kinematics
The analysis that we perform here is similar to that used by Marasco et al. (2013) to compare their galactic fountain model with the absorption data. In the following, we summarize the procedure adopted. First, we use the same method described in Section 4.2 to produce modelcubes of the warm () and hot () gas of F80. The main difference is that here the spatial smoothing uses the SPH kernel size of each particle instead of a fixed angular resolution: as our data consist of a set of absorption line measurements that are randomly distributed in the sky, we prefer to sample the warm-hot gas in the simulated box smoothly and extend its ‘filling-factor’ as much as possible. Each modelcube is produced twice: once using only the polluted gas (i.e., with metal abundance larger than 0), and the second time using both polluted and unpolluted gas. We remind the reader that, as metal diffusion is not used and the simulation starts with no metals, particles can be polluted only by SN explosions in the disc or stellar winds. Therefore, the first modelcube is representative for gas that has been affected by feedback and participates in the fountain-cycle. A qualitative comparison between models and data is carried out by overlapping the position-velocity of the absorbers on top of the diagram of the modelcubes. A more quantitative analysis uses an iterative KS-test to derive the fraction of detections that is consistent with our modelcubes (for the details see Marasco et al., 2013).
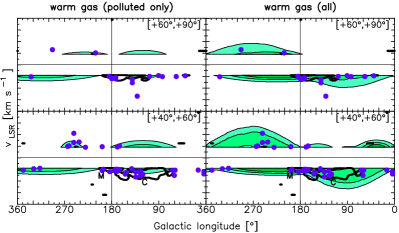
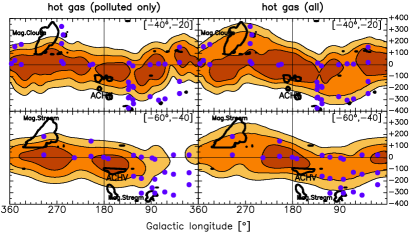
Fig. 8 shows two representative longitude-velocity () slices for the warm (panels on the left) and the hot (panels on the right) gas of F80. Slices derived for the polluted gas alone and for the polluted+pristine material are adjacent to each other. The three contours shown enclose , and of the total flux of the modelcubes, by analogy with a Gaussian distribution. The location of the observed absorption systems in the position-velocity diagram for these latitudes is plotted on top of the slices. As in Marasco et al. (2013), the modelcube of warm gas is compared to the absorption data of Lehner et al. (2012) (Si III, Si IV, C II, C III, C IV) while the hot gas is compared to the joined datasets of Sembach et al. (2003) and Savage et al. (2003) (O VI). Warm material at has been neglected as it was excluded in the observations of Lehner et al. (2012).
The latitude bins chosen emphasize the differences between the whole gas and the polluted material alone. Several detections occur at velocities that are well beyond those predicted by the warm-hot polluted material of the simulation. Instead, the inclusion of pristine gas from the CGM, which rotates at a lower speed than the disc, significantly increases the relative line-of-sight velocities reached by the warm-hot material and produces a better overlap with the observations. Using our iterative KS test we find that only of the detections of Lehner et al. are compatible with the warm polluted material alone, whereas this percentage increases to when including the unpolluted gas. This suggests that the gas cycle produced by stellar feedback can not be solely responsible for the observed warm absorption features, as many absorbers have kinematics that are more consistent with that of the CGM. This discrepancy is significantly mitigated when we consider the O VI detections of Sembach and Savage, as the percentage of reproduced features passes from for the hot polluted material alone to when all the gas is considered, indicating that a good fraction of O VI around galaxies might come from stellar feedback. We notice that these results do not change when metal and thermal diffusions are included in the simulations: we derived the same slices of Fig. 8 using the version of F40 where diffusion is included, and we found similar results. Still, the models can account at most for about half of the detections. A possibility is that some of the high-velocity O VI absorption features observed by Sembach et al. (2003) could originate in the CGM of nearby galaxies and are therefore not related to the Milky Way. Following Marasco et al. (2013), we removed from our catalogue 41 O VI features that can be associated to external galaxies, and found that the fraction of the remaining O VI detections that is reproduced by our model increases to . We therefore conclude that the kinematics of the hot gas predicted by our runs is compatible with that shown by the majority of the O VI absorbers observed around the Galaxy.
4.3.2 Location
Under the hypothesis that the gas responsible for the observed absorption features is best represented by a mixture of warm-hot polluted and unpolluted gas, we use the simulation to determine what is the typical distance of the intervening absorption material.
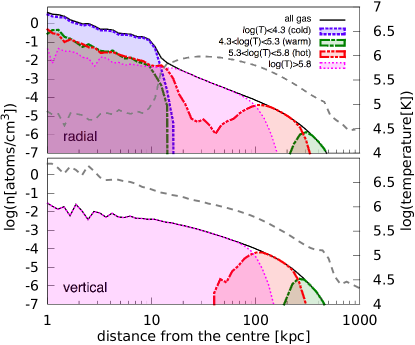
Fig. 9 shows both the radial (i.e., parallel to the disc) and the vertical (perpendicular to the disc) gas volume density profiles in model F80. The former has been derived by considering all gas particles in a cone centred on the system centre with an aperture of above and below the midplane, which allows us to intersect the region of the disc and exclude any contamination from gas above it, while for the latter we used a cone of around the rotation axis of the system. We used different lines and colours to represent the various phases of the gas. Cold gas is present only inside the galaxy disc, as it appears only in the inner of the radial profile. The vertical profile does not show the presence of cold material even in the innermost regions, where cold extra-planar gas is located. This happens because, as discussed in Section 4.2, this layer has a toroidal shape and therefore it is missed by the cone of view that we adopt. Warm and hot gas are instead located both in the disc and in the CGM.
As the kinematics of the warm gas coming from the disc is not in agreement with the observations (Section 4.3.1) we must focus on the warm material in the CGM, which appears to be located at distances between and from the centre, beyond the hot gas. As we are adopting a simple temperature threshold to discriminate between warm and hot material, this can be interpreted in terms of a temperature gradient in the CGM. The temperature of the CGM in the inner region of the system is larger than that in the outskirts (long-dashed line in the bottom panel of Fig. 9), inducing a spatial separation between warm and hot material and creating a deficit of warm gas between and . However, gas at this temperature is commonly seen in absorption within from galaxies (e.g. Tumlinson et al., 2013). Furthermore, in the Milky Way, there is evidence that most of the warm absorbers are located in the lower halo, within a few kpc from the Galaxy disc (Lehner & Howk, 2011; Wakker et al., 2012; Marasco et al., 2013).
The hot gas in F80 extends radially from the system centre up to more than from the disc, although it is absent in the inner in the direction perpendicular to the midplane. This is in agreement with the O VI impact-parameters derived in external galaxies: both Stocke et al. (2006) and Wakker & Savage (2009) found that low-redshift intergalactic O VI originates within 500 kpc from bright galaxies. In order to verify whether the absorption systems are widespread in the CGM or are confined within a shell at a given distance from the system centre, we proceed as follows: we consider the angular position and the of the O VI absorbers found by Sembach et al. (2003) and Savage et al. (2003), and we determine at what distance from the disc the hot gas particles of F80 with the same position and are located. We found that there is no preferential location for these particles, of them lie between 20 and 200 kpc from the centre.
Our findings suggest that the location of the hot gas predicted by model F80 is in agreement with the absorption-line observations, while that of the material at a lower temperature is not. We stress that our results are valid also for the models with lower feedback, as their density and temperature profiles are very similar to those of F80. The only exceptions are found in the inner region of the radial profile where, as the feedback decreases, the hot material inside the disc gets increasingly replaced by warm gas in response to the lower amount of energy injected into the ISM. One may wonder whether our findings are affected by the lack of metal and thermal diffusion, as the mixing between the different gas phases can alter the temperature profile of the CGM. To address this question, we compared the gas temperature and density distribution in F40 with those derived by re-simulating the same system with thermal and metal diffusion included. We found no differences, except that the low-density hot gas located between and from the center disappears, likely because it gets thermalized by the (hotter and denser) surrounding coronal gas. It is possible that warm or cold material arises in the inner hundreds of kpc from the discs only in a full cosmological context as a consequence of late-time filamentary cold-mode accretion, as suggested by high-resolution cosmological simulations of Milky Way-like systems (Kereš & Hernquist, 2009; Joung et al., 2012; Stinson et al., 2012). Insofar as our findings point towards this scenario, we remind the reader that the evolution of the CGM in the systems depends in principle on the initial conditions of the simulation. Adopting an isothermal corona (e.g. Binney et al., 2009), a lower baryonic fraction (motivated by X-ray observations, see Anderson & Bregman, 2010), a different distribution of the initial angular momentum, the presence of substructure, or a different feedback recipe are all choices that might have lead to different results.
4.3.3 Column density
Since the hot phase of the gas in the simulation is the one that best matches the position and the kinematics of the observed O VI absorption systems, it is interesting to test whether the amount of hot gas in the simulations is consistent with the observed O VI column densities. The comparison between the simulations and the observations is not straightforward, as the former are not designed to keep track of the various heavy elements nor to determine the gas ionization balance. In the following, we attempt to determine the O VI column density in a generic line of sight by using the information that is available for each particle, namely its total mass, temperature and metal abundance.
In the models, the O VI mass associated to each gas particle of total mass can be written as
| (3) |
where is the oxygen mass associated to the particle and is the mass of the elements heavier than helium. The three bracketed terms in eq.(3) can be determined separately. We assume collisional ionization equilibrium (CIE) to evaluate as a function of the temperature of the particle, by using the oxygen ionization-balance table of Sutherland & Dopita (1993). Note that the assumption of CIE should be solid for O VI systems in the halo of galaxies, as discussed by Sembach et al. (2003). The quantity is the metal abundance of the particle, which is known in all our simulations. Finally, we assume solar abundance ratios for our gas and set (Lodders, 2010).
We use a procedure similar to that described in Section 4.1 to build a modelcube where each voxel contains information on the O VI column density per unit velocity at the position of the simulated sky. The O VI column density at position will be simply given by
| (4) |
where and are two generic line-of-sight velocities. Following Marasco et al. (2013), we use eq. (4) to compute in all line-of-sights where O VI detections have been found in the combined datasets of Sembach et al. (2003) and Savage et al. (2003). The integral in eq. (4) is calculated between and , where is the mean velocity and is the line-width of the observed O VI absorption feature. By considering all the O VI column densities computed in the various line-of-sights, we find for model F80 an average value of , compatible with the value derived from the observations, . This result changes little when metal and thermal diffusions are included, as the average O VI column density in the version of F40 that includes diffusion is . Considering all the uncertainties, we conclude that the systems show a layer of hot gas whose kinematics, location and column densities are compatible with what is inferred for the Milky Way and external galaxies from O VI measurements.
5 Discussion
5.1 The impact of stellar feedback
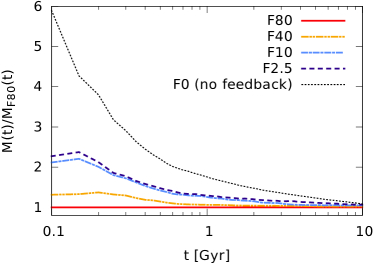
One of the most puzzling features of the simulated galaxies is that, as shown by Fig. 1, all star formation histories are very similar despite the fact that changes significantly from simulation to simulation. This result dramatically differs from that found by S06, i.e. that the injection of energy into the ISM slows down the star formation processes and therefore the same amount of fuel gets smoothly consumed on longer timescales. The main difference between our work and that of S06 is that the systems have coronae and hot-mode accretion happens all the time. Our findings indicate that, at least in the range of feedback energies studied in this work, gas accretes onto the discs - and star formation proceeds - in a similar fashion for all the simulated systems. But is stellar feedback affecting the hot-mode accretion at all? To answer this question, we ran another simulation (F0) adopting the same initial conditions as the other simulations, but with stellar feedback switched off altogether. Fig. 10 shows the total stellar mass assembled in all our runs (including F0), normalized to the stellar mass assembled by F80, as a function of time. Clearly, the lower the feedback is, the quicker the stellar mass is assembled. In particular, throughout the first Gyr, F0 builds a stellar component that is several times more massive than that of F80 (consistent with the results of S06), while the difference between the runs with intermediate feedback and F80 is less pronounced. This discrepancy slowly fades away with time: after 10 Gyr of evolution the total stellar mass assembled is virtually the same in all systems. Our interpretation is that, at the beginning of the simulation, stellar feedback quickly removes a significant fraction of gas that was piling up at the centre of the system, quenching star formation in the first few hundreds of Myr. A key point is that, in the feedback energy range explored in the models, this material remains gravitationally bound to the system, thus it slowly re-accretes onto the disc and takes part in the process of star formation. After 10 Gyr, the total amount of stars formed in the simulations with feedback and in that without feedback is similar, as the total amount of fuel available does not differ. As F0 has used most of its star forming fuel at the beginning of its evolution, the amount of neutral hydrogen left at is , of that available in the disc of F80 at the same time.
It must be pointed out that the parameter , on which our analysis is focussed, is only one of the many ingredients that determine the global ‘effectiveness’ of stellar feedback in simulations. For instance, Governato et al. (2010) realized the importance of the density threshold of gas eligible for being star-forming in simulations of dwarf galaxies: the larger the threshold, the more efficient the feedback is in preventing the formation of a prominent stellar bulge by producing strong outflows from the center that remove low angular momentum material. To explore this scenario, we re-ran our simulation F40 by increasing the star formation density threshold from our ‘fiducial’ value of cm-3 (S06) to cm-3. We found that the final ( Gyr) stellar mass of this new system is similar to that reported in Table 1, but the central stellar surface density is about smaller than that of our fiducial run F40, indicating that now feedback is slightly more efficient in preventing a mass stockpiling at the system centre. The total H I mass, also, is slightly larger (). The change in kinematics is however negligible, as the peak rotational velocity of this new system is only lower than that of our fiducial run. A detailed analysis of the impact of the density threshold on our systems is beyond the purpose of our study, but these results may indicate that massive systems like those studied in this paper are relatively less affected by large variation of this quantity.
Finally we would like to stress that, even though our runs adopt a relatively high , in state-of-the art cosmological simulations even larger values are required or additional feedback mechanisms (like radiative feedback from young stars or AGN feedback) are included in order to match the observations (Hopkins et al., 2014; Schaye et al., 2015). Our system with highest feedback shows a layer of extra-planar H I which is less massive and extended than that observed in NGC 891, a galaxy with a similar star formation rate and comparable total H I and stellar masses (Oosterloo et al., 2007; Fraternali et al., 2011). In future studies, it will be interesting to explore values of larger than those considered in this work.
5.2 The origin of the rotational lag
In Sections 3.1 and 4.2 we discussed the morphology and the kinematics of the extra-planar cold gas of the model with highest feedback, F80. To our knowledge, this is the first time that a global hydrodynamical simulation of a disc galaxy shows the presence of a thick H I disc produced by stellar feedback with kinematics in agreement with the observations. Melioli et al. (2009) used adaptive mesh refinement hydrodynamical simulations to follow the dynamical evolution of a galactic fountain flow powered by OB associations in a Milky Way-like galaxy. Both the supernova rate and energy input used in their work are comparable to those adopted in model F80. Melioli et al. (2009) found that gas from the ISM gets lifted up to a few kpc above the disc and falls back approximately to the same radius, in agreement with our results. However, they could not reproduce the lag in rotational velocity that is observed in the H I halo of real galaxies, and suggested that the galactic fountain flow interacts with extragalactic material inflowing onto the galaxy with low angular momentum to produce these lagging kinematics. The same conclusions were previously found by Fraternali & Binney (2008) (hereafter FB08) using a dynamical model of the galactic fountain. In our simulations, a natural source of gas inflow is the gas corona. Following Peek et al. (2008), the net (inflow-outflow) gas accretion in a spherical shell at a distance from the system centre can be determined in the models as
| (5) |
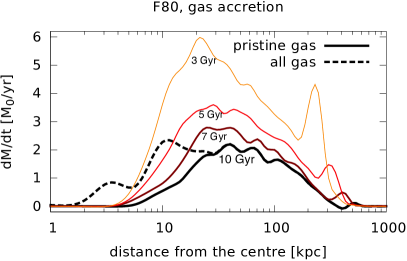
where is the mass of the -th gas particle, is the radial (i.e. directed towards the centre) component of its velocity, is the thickness of the shell and the sum is extended to all particles inside that shell. Fig. 11 shows the net (inflow-outflow) gas flow as a function of the distance from the system centre in F80, derived at four different times by evaluating eq.(5) in a series of shells, each one located at a distance () from the centre. At , pristine gas (solid line) between and is globally inflowing at a rate of about . At smaller distances, the inflow of pristine material appears to vanish as particles get contaminated by supernova feedback from the disc. However, when the total (polluted + pristine) gas is considered, the inflow appears to proceed down to the system centre (dashed line). In addition to the gas accreted from the corona, the discs of our systems are re-fuelled also by stellar winds, which return to the ISM about of the gas converted into stars. Therefore, we estimate that the rate at which new gas is reverted to the disc of F80 at is about , which comes relatively close to the SFR of this system (). We also point out that in all the models (including F0) the mass flow profile is very similar, suggesting that stellar feedback does not have a big impact on the way the models are accreting gas from the CGM. Fig. 11 shows also that the gas accretion rate was higher at early times, peaking around at and at . Interestingly, this is in good agreement with the inflow rates derived from simulations of Milky Way-like galaxies in a full cosmological context (e.g. Brook et al., 2014).
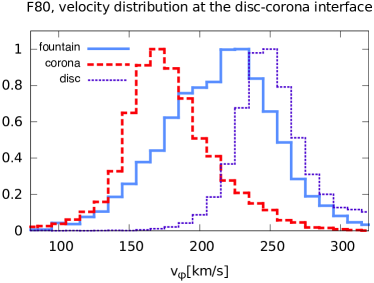
In model F80, it is not straightforward to determine the details of the interaction between the cold, metal-rich gas lifted from the disc and the hot coronal material inflowing to the centre, as pristine gas particles are absent in the region where extra-planar cold gas exists. This is likely caused by stellar winds from evolved stars in the thick stellar disc, which inject mass and metals into the surrounding gas particles (S06). In fact, pristine gas in F80 appears only above from the disc, precisely where the stellar component fades out. This implies that, at the disc-corona interface, we can not anymore use the simple polluted/unpolluted criterium to determine to which component a gas particle belongs. However, we found that the metallicity distribution of gas within a few kpc from the disc is bimodal, with two clear peaks located around and and a separation occurring roughly at . For the purpose of investigating the disc-corona interplay, we interpret the gas at as material ejected from the disc by stellar feedback and taking part in the galactic fountain gas cycle, and the gas at as coronal gas which has never been part of the disc but is polluted by thick disc stars. Our interpretation is corroborated by the fact that gas particles at are preferentially located outside the disc, while those at a higher metallicity are mainly located inside it. Fig. 12 shows the rotation velocity distribution for these two components in the region where extra-planar cold gas is present, , and compares it with that of the underlying H I disc (). Clearly, coronal gas rotates much slower than the material in the disc, whereas the galactic fountain gas distributes in between these two components. The kinematics of the coronal gas is not surprising since, given the high temperature, this material is partially pressure-supported and therefore must rotate at a velocity lower than that of the circular orbit. Thus, a very likely interpretation is that metal-rich gas expelled from the disc interacts hydrodynamically with the slow-rotating and inflowing corona, loses angular momentum and produces a rotation velocity gradient in agreement with the H I observations. This mechanism is qualitatively similar to that proposed by FB08.
We stress that the loss of angular momentum experienced by fountain gas is likely to happen only at the disc-corona interface, where the specific angular momentum of the coronal gas is less than that of the disc material. However, powerful feedback events can eject gas up to distances of several tens or hundreds of kpc, where this condition is reversed: this material can gain some angular momentum from the corona before being re-accreted back to the disc (Brook et al., 2012; Übler et al., 2014). It is possible that such a mechanism occurs also in our runs since polluted gas is present up to from the system centres.
The effects of the disc-corona interplay on the accretion of coronal gas have been studied in a series of papers (Marinacci et al., 2011; Marasco et al., 2012; Fraternali et al., 2013). In these works, a combination of dynamical models and high-resolution hydrodynamical simulations have been used to propose a scenario where the cooling of the lower corona is enhanced by stellar feedback from the disc via the galactic fountain mechanism. This process, known as ‘supernova-driven gas accretion’, can hardly take place in our simulations as the resolution is not adequate to describe the turbulent mixing between these two gas layers.
6 Conclusions
We analysed the outcome of four N-body+SPH simulations of a Milky-Way like system produced by the radiative cooling of a rotating gaseous corona embedded in a dark matter halo. Each simulation uses the same initial conditions, but differs by the amount of energy per supernova, , injected into the interstellar medium, which spans a factor of 32 from the lowest feedback model ( erg/SN) to the highest feedback model ( erg/SN). We studied how the morphology and the kinematics of these systems after 10 Gyr of evolution compare to those of the Milky Way. In addition, we performed a direct comparison with the H I and absorption-line data of the Milky Way by simulating an observation of the simulated systems from within the galaxy. Our main results are the following:
-
•
in the range of input energies considered, stellar feedback has almost no impact on the star formation histories of the model galaxies;
-
•
stellar feedback significantly affects the vertical distribution of cold gas, as high feedback produces thicker discs with larger velocity dispersion;
-
•
the simulation with the highest feedback (F80) shows a prominent layer of extra-planar cold gas. The kinematics of this medium is consistent with that derived in real galaxies like the Milky Way and NGC 891, although its column density is about one order of magnitude lower. This finding supports the idea that such features are produced by feedback activity from star-forming discs.
-
•
The location, kinematics and typical column density of the hot () gas in F80 are consistent with those inferred in the Milky Way and external galaxies via O VI absorption line studies. Gas at lower temperatures is commonly observed in absorption around galaxies, but it is instead scarce in the CGM of our simulated systems.
In addition, we found that the increase of affects the stellar component in two ways: a) it systematically enhances the central stellar surface density, and consequently the concentration of dark matter in the galaxy centres; b) it reduces the thickening and the velocity dispersion of the stellar disc.
Acknowledgments
The authors thank the anonymous referee for insightful comments. AM and TvdH acknowledge support from the European Research Council under the European Union’s Seventh Framework Programme (FP/2007-2013) / ERC Grant Agreement nr. 291531. VPD was supported by STFC Consolidated grant # ST/J001341/1. FF acknowledges financial support from PRIN MIUR 2010-2011, project “The Chemical and Dynamical Evolution of the Milky Way and Local Group Galaxies”, prot. 2010LY5N2T. Simulations in this paper were carried out using the computational facility at the University of Malta procured through the European Regional Development Fund, Project ERDF-080222http://www.um.edu.mt/research/scienceeng/erdf_080).
References
- Agertz et al. (2009) Agertz O., Teyssier R., Moore B., 2009, MNRAS, 397, L64
- Anderson & Bregman (2010) Anderson M. E., Bregman J. N., 2010, ApJ, 714, 320
- Aumer & Binney (2009) Aumer M., Binney J. J., 2009, MNRAS, 397, 1286
- Barbieri et al. (2005) Barbieri C. V., Fraternali F., Oosterloo T., Bertin G., Boomsma R., Sancisi R., 2005, A&A, 439, 947
- Begeman (1987) Begeman K. G., 1987, PhD thesis, , Kapteyn Institute, (1987)
- Binney & Merrifield (1998) Binney J., Merrifield M., 1998, Galactic astronomy
- Binney et al. (2009) Binney J., Nipoti C., Fraternali F., 2009, MNRAS, 397, 1804
- Bois et al. (2011) Bois M., Emsellem E., Bournaud F., Alatalo K., Blitz L., Bureau e. a., 2011, MNRAS, 416, 1654
- Boomsma et al. (2008) Boomsma R., Oosterloo T. A., Fraternali F., van der Hulst J. M., Sancisi R., 2008, A&A, 490, 555
- Bregman (1980) Bregman J. N., 1980, ApJ, 236, 577
- Broeils & Rhee (1997) Broeils A. H., Rhee M.-H., 1997, A&A, 324, 877
- Brook et al. (2012) Brook C. B., Stinson G., Gibson B. K., Roškar R., Wadsley J., Quinn T., 2012, MNRAS, 419, 771
- Brook et al. (2014) Brook C. B., Stinson G., Gibson B. K., Shen S., Macciò A. V., Obreja A., Wadsley J., Quinn T., 2014, MNRAS, 443, 3809
- Bullock et al. (2001) Bullock J. S., Dekel A., Kolatt T. S., Kravtsov A. V., Klypin A. A., Porciani C., Primack J. R., 2001, ApJ, 555, 240
- Combes (2008) Combes F., 2008, in Funes J. G., Corsini E. M., eds, Formation and Evolution of Galaxy Disks Vol. 396 of Astronomical Society of the Pacific Conference Series, Secular Evolution of Disk Galaxies. p. 325
- Crain et al. (2010) Crain R. A., McCarthy I. G., Frenk C. S., Theuns T., Schaye J., 2010, MNRAS, 407, 1403
- Dalla Vecchia & Schaye (2008) Dalla Vecchia C., Schaye J., 2008, MNRAS, 387, 1431
- Dalla Vecchia & Schaye (2012) Dalla Vecchia C., Schaye J., 2012, MNRAS, 426, 140
- de Blok (2010) de Blok W. J. G., 2010, Advances in Astronomy, 2010, 5
- Debattista et al. (2006) Debattista V. P., Mayer L., Carollo C. M., Moore B., Wadsley J., Quinn T., 2006, ApJ, 645, 209
- Dekel & Birnboim (2006) Dekel A., Birnboim Y., 2006, MNRAS, 368, 2
- Dickey & Lockman (1990) Dickey J. M., Lockman F. J., 1990, Annual Review of Astronomy & Astrophysics, 28, 215
- Dwek et al. (1995) Dwek E., Arendt R. G., Hauser M. G., Kelsall T., Lisse C. M., Moseley S. H., Silverberg R. F., Sodroski T. J., Weiland J. L., 1995, ApJ, 445, 716
- Fraternali & Binney (2006) Fraternali F., Binney J. J., 2006, MNRAS, 366, 449
- Fraternali & Binney (2008) Fraternali F., Binney J. J., 2008, MNRAS, 386, 935
- Fraternali et al. (2013) Fraternali F., Marasco A., Marinacci F., Binney J., 2013, ApJL, 764, L21
- Fraternali et al. (2011) Fraternali F., Sancisi R., Kamphuis P., 2011, A&A, 531, A64
- Fraternali & Tomassetti (2012) Fraternali F., Tomassetti M., 2012, ArXiv e-prints
- Fraternali et al. (2002) Fraternali F., van Moorsel G., Sancisi R., Oosterloo T., 2002, AJ, 123, 3124
- Gentile et al. (2013) Gentile G., Józsa G. I. G., Serra P., Heald G. H., de Blok W. J. G., Fraternali F., Patterson M. T., Walterbos R. A. M., Oosterloo T., 2013, A&A, 554, A125
- Governato et al. (2010) Governato F., Brook C., Mayer L., Brooks A., Rhee G., Wadsley J., Jonsson P., Willman B., Stinson G., Quinn T., Madau P., 2010, Nature, 463, 203
- Haardt & Madau (2001) Haardt F., Madau P., 2001, in Neumann D. M., Tran J. T. V., eds, Clusters of Galaxies and the High Redshift Universe Observed in X-rays Modelling the UV/X-ray cosmic background with CUBA
- Hobbs et al. (2013) Hobbs A., Read J., Power C., Cole D., 2013, MNRAS, 434, 1849
- Hopkins et al. (2008) Hopkins A. M., McClure-Griffiths N. M., Gaensler B. M., 2008, ApJL, 682, L13
- Hopkins (2013) Hopkins P. F., 2013, MNRAS, 428, 2840
- Hopkins et al. (2014) Hopkins P. F., Kereš D., Oñorbe J., Faucher-Giguère C.-A., Quataert E., Murray N., Bullock J. S., 2014, MNRAS, 445, 581
- Joung et al. (2012) Joung M. R., Bryan G. L., Putman M. E., 2012, ApJ, 745, 148
- Kalberla et al. (2005) Kalberla P. M. W., Burton W. B., Hartmann D., Arnal E. M., Bajaja E., Morras R., Pöppel W. G. L., 2005, A&A, 440, 775
- Kalberla & Dedes (2008) Kalberla P. M. W., Dedes L., 2008, A&A, 487, 951
- Kalberla & Kerp (2009) Kalberla P. M. W., Kerp J., 2009, Annual Review of Astronomy & Astrophysics, 47, 27
- Kaufmann et al. (2009) Kaufmann T., Bullock J. S., Maller A. H., Fang T., Wadsley J., 2009, MNRAS, 396, 191
- Kaufmann et al. (2006) Kaufmann T., Mayer L., Wadsley J., Stadel J., Moore B., 2006, MNRAS, 370, 1612
- Keller et al. (2014) Keller B. W., Wadsley J., Benincasa S. M., Couchman H. M. P., 2014, MNRAS, 442, 3013
- Kereš & Hernquist (2009) Kereš D., Hernquist L., 2009, ApJL, 700, L1
- Kereš et al. (2009) Kereš D., Katz N., Fardal M., Davé R., Weinberg D. H., 2009, MNRAS, 395, 160
- Kereš et al. (2005) Kereš D., Katz N., Weinberg D. H., Davé R., 2005, MNRAS, 363, 2
- Kregel et al. (2002) Kregel M., van der Kruit P. C., de Grijs R., 2002, MNRAS, 334, 646
- Lehner & Howk (2011) Lehner N., Howk J. C., 2011, Science, 334, 955
- Lehner et al. (2012) Lehner N., Howk J. C., Thom C., Fox A. J., Tumlinson J., Tripp T. M., Meiring J. D., 2012, MNRAS, p. 3333
- Levine et al. (2006) Levine E. S., Blitz L., Heiles C., 2006, ApJ, 643, 881
- Lodders (2010) Lodders K., 2010, in Goswami A., Reddy B. E., eds, Principles and Perspectives in Cosmochemistry Solar System Abundances of the Elements. p. 379
- Macciò et al. (2007) Macciò A. V., Dutton A. A., van den Bosch F. C., Moore B., Potter D., Stadel J., 2007, MNRAS, 378, 55
- Maloney (1993) Maloney P., 1993, ApJ, 414, 41
- Marasco & Fraternali (2011) Marasco A., Fraternali F., 2011, A&A, 525, A134+
- Marasco et al. (2012) Marasco A., Fraternali F., Binney J. J., 2012, MNRAS, 419, 1107
- Marasco et al. (2013) Marasco A., Marinacci F., Fraternali F., 2013, MNRAS, 433, 1634
- Marinacci et al. (2011) Marinacci F., Fraternali F., Nipoti C., Binney J., Ciotti L., Londrillo P., 2011, MNRAS, pp 855–+
- McMillan (2011) McMillan P. J., 2011, MNRAS, 414, 2446
- McWilliam & Zoccali (2010) McWilliam A., Zoccali M., 2010, ApJ, 724, 1491
- Melioli et al. (2009) Melioli C., Brighenti F., D’Ercole A., de Gouveia Dal Pino E. M., 2009, MNRAS, 399, 1089
- Miller & Scalo (1979) Miller G. E., Scalo J. M., 1979, ApJS, 41, 513
- Minniti et al. (2011) Minniti D., Saito R. K., Alonso-García J., Lucas P. W., Hempel M., 2011, ApJL, 733, L43
- Nataf et al. (2010) Nataf D. M., Udalski A., Gould A., Fouqué P., Stanek K. Z., 2010, ApJL, 721, L28
- Navarro et al. (1996) Navarro J. F., Frenk C. S., White S. D. M., 1996, ApJ, 462, 563
- Ness et al. (2012) Ness M., Freeman K., Athanassoula E., Wylie-De-Boer E., Bland-Hawthorn J., Lewis G. F., Yong D., Asplund M., Lane R. R., Kiss L. L., Ibata R., 2012, ApJ, 756, 22
- Ogiya & Mori (2011) Ogiya G., Mori M., 2011, ApJL, 736, L2
- Oosterloo et al. (2007) Oosterloo T., Fraternali F., Sancisi R., 2007, AJ, 134, 1019
- Peek et al. (2008) Peek J. E. G., Putman M. E., Sommer-Larsen J., 2008, ApJ, 674, 227
- Pisano et al. (2011) Pisano D. J., Barnes D. G., Staveley-Smith L., Gibson B. K., Kilborn V. A., Freeman K. C., 2011, ApJS, 197, 28
- Rahmati et al. (2013) Rahmati A., Pawlik A. H., Raicevic M., Schaye J., 2013, MNRAS, 430, 2427
- Read (2014) Read J. I., 2014, Journal of Physics G Nuclear Physics, 41, 063101
- Read & Gilmore (2005) Read J. I., Gilmore G., 2005, MNRAS, 356, 107
- Roškar et al. (2008) Roškar R., Debattista V. P., Quinn T. R., Stinson G. S., Wadsley J., 2008, ApJL, 684, L79
- Roškar et al. (2008) Roškar R., Debattista V. P., Stinson G. S., Quinn T. R., Kaufmann T., Wadsley J., 2008, ApJL, 675, L65
- Sale et al. (2010) Sale S. E., Drew J. E., Knigge C., Zijlstra A. A., Irwin M. J., Morris R. A. H., Phillipps S., Drake J. J., Greimel R., Unruh Y. C., Groot P. J., Mampaso A., Walton N. A., 2010, MNRAS, 402, 713
- Sancisi et al. (2008) Sancisi R., Fraternali F., Oosterloo T., van der Hulst T., 2008, A&AR, 15, 189
- Savage et al. (2003) Savage B. D., Sembach K. R., Wakker B. P., Richter P., Meade M., Jenkins E. B., Shull J. M., Moos H. W., Sonneborn G., 2003, ApJS, 146, 125
- Scannapieco et al. (2012) Scannapieco C., Wadepuhl M., Parry O. H., Navarro J. F., Jenkins A., Springel V., Teyssier e. a., 2012, MNRAS, 423, 1726
- Schaye et al. (2015) Schaye J., Crain R. A., Bower R. G., Furlong M., Schaller M. e. a., 2015, MNRAS, 446, 521
- Sellwood & Binney (2002) Sellwood J. A., Binney J. J., 2002, MNRAS, 336, 785
- Sembach et al. (2003) Sembach K. R., Wakker B. P., Savage B. D., Richter P., Meade M., Shull J. M., Jenkins E. B., Sonneborn G., Moos H. W., 2003, ApJS, 146, 165
- Shen et al. (2010) Shen S., Wadsley J., Stinson G., 2010, MNRAS, 407, 1581
- Sofue et al. (2009) Sofue Y., Honma M., Omodaka T., 2009, PASJ, 61, 227
- Sofue et al. (2011) Sofue Y., Nagayama T., Matsui M., Nakagawa A., 2011, PASJ, 63, 867
- Stinson et al. (2006) Stinson G., Seth A., Katz N., Wadsley J., Governato F., Quinn T., 2006, MNRAS, 373, 1074
- Stinson et al. (2012) Stinson G. S., Brook C., Prochaska J. X., Hennawi J., Shen S., Wadsley J., Pontzen A., Couchman H. M. P., Quinn T., Macciò A. V., Gibson B. K., 2012, MNRAS, 425, 1270
- Stocke et al. (2006) Stocke J. T., Penton S. V., Danforth C. W., Shull J. M., Tumlinson J., McLin K. M., 2006, ApJ, 641, 217
- Sutherland & Dopita (1993) Sutherland R. S., Dopita M. A., 1993, ApJS, 88, 253
- Tumlinson et al. (2013) Tumlinson J., Thom C., Werk J. K., Prochaska J. X., Tripp T. M., Katz N., Davé R., Oppenheimer B. D., Meiring J. D., Ford A. B., O’Meara J. M., Peeples M. S., Sembach K. R., Weinberg D. H., 2013, ApJ, 777, 59
- Twarog (1980) Twarog B. A., 1980, ApJ, 242, 242
- Übler et al. (2014) Übler H., Naab T., Oser L., Aumer M., Sales L. V., White S. D. M., 2014, MNRAS, 443, 2092
- Villalobos & Helmi (2009) Villalobos Á., Helmi A., 2009, MNRAS, 399, 166
- Vogelsberger et al. (2014) Vogelsberger M., Genel S., Springel V., Torrey P., Sijacki D., Xu D., Snyder G., Bird S., Nelson D., Hernquist L., 2014, Nature, 509, 177
- Wadsley et al. (2004) Wadsley J. W., Stadel J., Quinn T., 2004, New Astronomy, 9, 137
- Wakker & Savage (2009) Wakker B. P., Savage B. D., 2009, ApJS, 182, 378
- Wakker et al. (2012) Wakker B. P., Savage B. D., Fox A. J., Benjamin R. A., Shapiro P. R., 2012, ApJ, 749, 157
- Wakker et al. (2003) Wakker B. P., Savage B. D., Sembach K. R., Richter P. e. a., 2003, ApJS, 146, 1
- Wang et al. (2014) Wang J., Fu J., Aumer M., Kauffmann G., Józsa G. I. G., Serra P., Huang M.-l., Brinchmann J., van der Hulst T., Bigiel F., 2014, MNRAS, 441, 2159
- Werk et al. (2013) Werk J. K., Prochaska J. X., Thom C., Tumlinson J., Tripp T. M., O’Meara J. M., Peeples M. S., 2013, ApJS, 204, 17
- Werk et al. (2014) Werk J. K., Prochaska J. X., Tumlinson J., Peeples M. S., Tripp T. M., Fox A. J., Lehner N., Thom C., O’Meara J. M., Ford A. B., Bordoloi R., Katz N., Tejos N., Oppenheimer B. D., Davé R., Weinberg D. H., 2014, ApJ, 792, 8
- White & Rees (1978) White S. D. M., Rees M. J., 1978, MNRAS, 183, 341