A correlation in Black-Hole transients
Abstract
We compare Hα emission profiles of 12 dynamically confirmed black holes (BHs) and 2 neutron star X-ray transients (SXTs) in quiescence with those of a sample of 43 Cataclysmic Variables (CVs), also quiescent. The full-width-half maximum () of the Hα line in SXTs is tightly correlated with the velocity semi-amplitude of the donor star . This new correlation, when combined with orbital periods (i.e. through photometric light curves), opens the possibility to estimate compact object mass functions from single integration, low-resolution spectroscopy. On the other hand, CVs above the period gap are found to follow a flatter correlation, a likely consequence of their larger mass ratios. We also find that the traces the disc velocity at 42% , independently of binary mass ratio. In addition, for a given , BHs tend to have lower than CVs. This might be explained by the fact that CVs must be seen at higher inclinations to mimic the same projected disc velocities as BH SXTs. For the same reason CVs with km s-1 are mostly eclipsing while none of our sample BHs are. Further, we show that there is a vacant/unoccupied region for CVs in the plane defined by (km/s). Both the correlation and the plane can be exploited, together with photometric light curves, to efficiently discover quiescent BHs in deep Hα surveys of the Galactic Plane.
1 Introduction
Black holes (BH) provide unique laboratories to study key astrophysical phenomena such as accretion, the production of relativistic outflows and gamma ray bursts (e.g. Fender & Gallo 2014; Brown et al. 2000). BHs are usually discovered in transient X-ray binaries (SXTs) thanks to their dramatic, large-amplitude X-ray outbursts111By contrast, persistent X-ray binaries tend to harbour neutron stars.. These are caused by thermal-viscous instabilities in accretion discs which are (slowly) fed by matter transferred from a (donor) companion star (Lasota, 2001). The distribution of BH masses and binary periods provide fundamental constrains to models of supernovae explosions and compact binary evolution. Unfortunately, our understanding of the physics involved in these processes is still patchy because observational data are severely limited by small samples.
The current sample of 50 BH SXTs, with only 17 dynamical confirmations, is the tip of the iceberg of a hidden population of hibernating BHs (see Casares & Jonker 2014). The size of the overall population is highly uncertain. Extrapolation of the number of SXTs discovered in the X-ray era suggests that several thousand dormant BHs are awaiting to be discovered (van den Heuvel, 1992; Tanaka & Shibazaki, 1996; Romani, 1998). On the other hand, modern population-synthesis models predict an even larger population of SXTs (Pfahl et al., 2003; Yungelson et al., 2006). Observational constraints are likely biased low because they suffer from incompleteness and neglect a hitherto unexpected population of long period SXTs with very long duty cycles or even supressed outburst activity (cf. Ritter & King 2002; Menou et al. 1999). Furthermore, there is mounting evidence for the existence of a population of X-ray obscured or intrinsically faint BH SXTs (Corral-Santana et al., 2013; Armas Padilla et al., 2014). It has been shown that the latter could be members of a sizeable population of short period BH transients with low outburst luminosities (Maccarone & Patruno, 2013). And finally, the recent discovery of the first Be/BH binary indicates that some BHs might be accreting ”silently” from the slowly outflow winds of rapidly rotating Be-type stars (Casares et al., 2014). While binary population models predict a very modest number of Be/BH binaries in the Milky Way (Belczynski & Ziolkowski, 2009; Grudzinska et al., 2015) empirical constraints, with only one detection yet, are very loose. Altogether, the only way to make significant progress in our knowledge of the Galactic population of BHs requires the discovery of a large sample of quiescent SXTs and this demands a new research methodology.
Quiescent BH SXTs are particularly difficult to find since they are relatively faint across the electromagnetic spectrum in this state. By their very nature, quiescent states are characterised by extremely low accretion levels ( M⊙ yr-1). The inner disc is truncated in an advected flow and, further, the lack of a solid surface (an exclusive signature of BH) results in extremely weak X-ray, UV and radio luminosities (Narayan & McClintock, 2008; Miller-Jones et al., 2011). On the other hand, the optical spectrum is dominated by the low-mass donor star, with superposed emission lines from the accretion disc gas. The lack of a hard radiation field implies that only emission from neutral H and He is detected. Crucially, the strongest emission line is Hα, but several other Galactic populations are also strong Hα emitters, such as Cataclysmic Variables (CVs), Symbiotic binaries, flare stars, reddened Be stars, T Tauri and other classes of young stellar objects. As a consequence, Hα surveys of the Galactic plane are vastly outnumbered by these populations of contaminating Hα emitters. Attempts to clear out the sample using color selection cuts (Corral-Santana et al., 2008) or X-ray diagnostics (Jonker et al., 2011) still have to prove their effectiveness. Interestingly, new generation radio surveys (SKA and its pathfinders) may offer an alternative route to detect quiescent BHs given the increase in radio-to-X-ray flux ratios at very low luminosities (Maccarone, 2005).
Here we present the discovery of a correlation between the width of the Hα line and the projected velocity of the companion star in quiescent SXTs. This property can be applied, in combination with photometric orbital periods, to gather compact object mass functions and flag new potential BHs. This strategy can be turned into a novel technique to unveil hibernating BHs, technique which appears much more efficient than traditional methods based on time-consuming spectroscopic monitoring of new X-ray novae.
2 The sample
2.1 X-ray Transients
We have assembled a spectroscopic database of dynamically confirmed BH SXTs with Hα emission (see Table 1). Most spectra were collected by us (V404 Cyg, BW Cir, N Mus 91, GS 2000+25, A0620-00, XTE J1650-500, XTE J1859+226, GRO J0422+320, XTE J1118+480) and have been presented in several publications, while others were kindly provided by J. Orosz (XTE J1550-564), R. Remillard (N Oph 77) and A. Fillipenko (N. Vel 93). In addition, three new unpublished spectra of GRO J0422+320 were obtained on the night of 28 Jan 2009 with ALFOSC on the 2.5m Nordic Optical Telescope (NOT) at the Observatorio del Roque de los Muchachos. Integration time was set to 2400s and we used grism #4 and 1” slit to cover the range 3820-9140 at 360 km s-1 resolution. Seventy unpublished Hα spectra of V404 Cyg were also collected between 1994-2005 with the 2.5m Isaac Newton Telescope (INT) and the 4.2m William Herschel Telescope (WHT) at resolutions 36134 km s-1. Five additional spectra of V404 Cyg were obtained on the nights of 5 and 7-8 July 2008 at 200 km s-1 resolution with the 2.1m telescope at the Observatorio San Pedro Mártir (SPM). Finally the sample also includes spectra of the two only neutron star SXTs with a reported radial velocity curve of the companion star, Cen X-4 and XTE J2123-058. Table 1 provides the main observational details and associated references for every system.
2.2 Cataclysmic Variables
We also collected a database of Hα spectra of Cataclysmic Variables (CVs) in quiescence including 41 dwarf novae and two intermediate polars, also classified as classical novae (GK Per and DQ Her). Most of the spectra were acquired during several observing campaigns and Service nights performed with the WHT in 1992, 1993, 1998 and 2006, the INT in 1992, 2001, 2008 and 2009, the NOT telescope in 2008, 2009 and 2012, the 2.2m telescope at Calar Alto Observatory in 1995 and the 2.1m telescope at SPM in 2008. The WHT spectra were obtained with ISIS and the R1200R grating which delivers 40 km s-1 resolution at Hα. The INT spectra were obtained with the IDS spectrograph and gratings R150V, R300V, R900V and R1200R covering the Hα region at 50-320 km s-1 resolution. For the NOT campaigns we used ALFOSC and grism #7 with different slit widths providing 235310 km s-1 resolution. The Calar Alto data were collected with the CASSPEC spectrograph, the f3 camera and grating #11 in second order which delivered 27 km s-1 resolution. The SPM spectra were obtained with the Boller & Chivens spectrograph and a 600 l/mm grating to yield 192 km s-1 resolution. Spectra of 13 CVs (BV Cen, EY Cyg, DX And, HS0218+3229, AH Her, HS2325+8205, SDSS J100658.40+233724, U Gem, CTCV J1300-3052, OY Car, V2051 Oph, SDSS 103533.02+055158 and SDSS J143317.78+101123.3) were kindly provided by different authors while Hα parameters for other 15 CVs were compiled from literature. In addition, spectra of WZ Sge were retrived from the ING archive and reduced by us. The final collection of CV spectra were employed as a test sample for comparison with the Hα properties of SXTs. All the CVs have secured velocity amplitudes () of their companion stars either through radial velocity studies or eclipse light curve solutions (for short period binaries where the companion star is undetected). Table 2 summarizes the main observational details of the CV database. The database is intended to be a representative sample of quiescent CVs with available determinations although we warn about possible selection effects. These will be addressed in the following Section.
3 The correlation
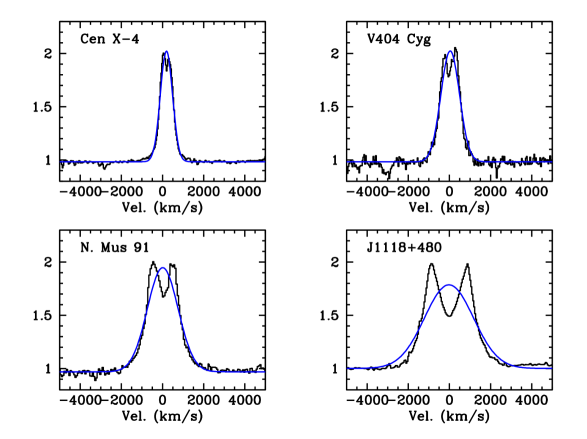
Full-width-half-maximum () values were obtained from gaussian fits to individual Hα profiles in every SXT. The fitted model consists of a constant plus a Gaussian function. Continuum rectified spectra were fitted in a window of 10000 km s-1, centered on the Hα line after masking the neighboring HeI line at 6678. We adopted 1- formal errors on the fitted parameter as derived through minimization. Fig. 1 displays some fit examples to average line profiles covering the entire range of line widths displayed by our data. It is clear from the figure that a simple Gaussian does not provide an accurate description of very broad profiles with large double peak separations. However, we find that the given by the Gaussian model is within 10% of other width parameters obtained from more sophisticated double-Gaussian models. And, more importantly, it is far more robust since double-Gaussian models can easily fail when fitting low signal-to-noise profiles. In addition to the , we also extracted equivalent widths () by integrating the Hα flux in individual spectra, after continuum normalization.
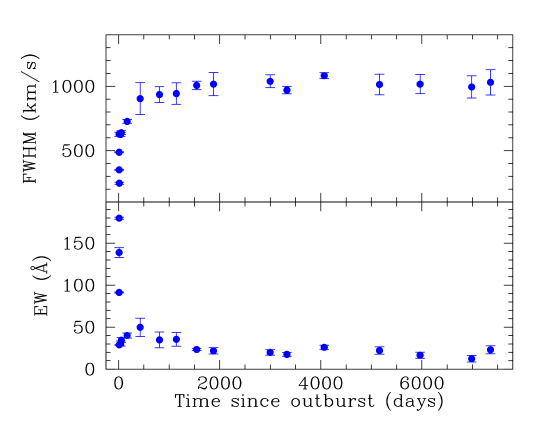
Our 266 spectra of V404 Cyg span over 20 yr and, therefore, present the most complete database yet for the analysis of the secular evolution of accretion discs in quiescent BHs. Fig. 2 presents the evolution of both line parameters, and , in V404 Cyg. The data points have been folded into 50 day bins, except for the first 30 days where 1 day bins were used to better trace the rapid evolution through the outburst. The plot shows a steep rise in (drop in ) followed by a plateau phase starting 1300 days after the peak of the outburst. By taking the as a proxy of the disc radius, Fig. 2 indicates that the accretion disc shrinks during outburst, recovering an equilibrium radius 3.5 yr after the maximum. Evidence of accretion disc shrinkage following outburst has been reported for CVs using eclipse timing and eclipse mapping techniques (Smak, 1984; Baptista & Catalán, 2001). Because we are interested here in comparing average properties of stable quiescent discs in SXTs we decided to trim all data obtained within 1300 days after the peak of the outburst. This leaves 127 useful spectra of V404 Cyg (all since 1993), 94 of BW Cir and 3 of GRO J0422+320 (from 2009).
Table 3 lists the mean and values for SXTs, where the quoted uncertainties represent 1 standard deviation in the distribution of individual measurements. Therefore, our errors mostly reflect time variability in line width and normalized flux. Line variability is mainly caused by aperiodic flares (Hynes et al., 2002) or long-lived disc asymmetries (e.g. hot spots), modulated with the orbital period. In the cases of N. Oph 77 and Vel 93 only one phase averaged spectrum is available and, thus, we adopt to account for the average 10% variability displayed by the remaining binaries. By the same token, we adopt for objects where only one spectrum is available, based on the mean standard deviation in the s of the remaining systems. Instrumental resolution was subtracted quadratically from every value and, therefore, the Hα widths quoted in Table 3 are intrinsic. Table 3 also provides fundamental binary parameters, chiefly the orbital period (), the radial velocity semi-amplitude of the companion star () and the mass of the compact star () and inclination (), when available, with their associated references.
We also collected and from Hα lines in our sample of CV spectra listed in Table 2. In the case of 14 eclipsing binaries (EM Cyg, EX Dra, HS 2325+8205, DQ Her, SDSS J100658.40+233724.4, U Gem, IP Peg, CTCV J1300-3052, HT Cas, OY Car, V2051 Oph, SDSS 103533.02+055158.3, WZ Sge and SDSS J143317.78+101123.3) only spectra obtained 0.05 phases away from the eclipse minimum were considered. As already mentioned, and values were obtained from the literature for 15 CVs. For these cases we adopt a 7% error in and 14% error in , derived from the mean variability measured in the other 28 CVs. These values are listed in Table 4, together with determinations of the orbital period and velocities.
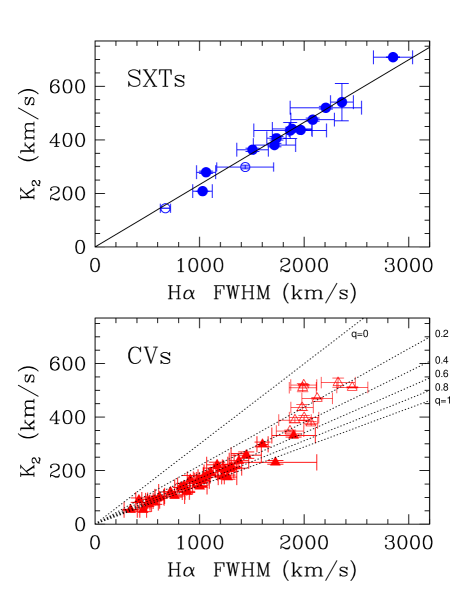
In Figure 3 we compare versus and it can be seen that these quantities are tightly correlated in SXTs, with a Pearson correlation coefficient . A linear fit yields the following relation
| (1) |
where both quantities are given in km s-1. A second order polynomial fit is not justified since the constant coefficient is consistent with zero at 1. In order to assess the error in estimated from the correlation we computed the difference with the true (dynamical) for our 14 SXTs. The values are found to follow a Gaussian distribution with standard deviation of 22 km s-1. We therefore conclude that robust estimates of the velocity can be obtained from the width of the Hα line in SXTs. The uncertainty in the coefficient of the correlation was estimated through a Monte-Carlo simulation of 104 events, assuming that the difference between the model and true values follow a Gaussian distribution with km s-1.
The correlation is expected from basic equations. Assuming that is determined by gas velocity at a characteristic disc radius
| (2) |
where is the mass of the accreting star and the binary inclination. On the other hand, the companion’s velocity is given by
| (3) |
with the mass of the companion star. Therefore,
| (4) |
where is the mass ratio and the binary separation. If we now assume (with ) and use Eggleton’s relation (Eggleton, 1983) to remove then
| (5) |
where
| (6) |
In the domain of SXTs, with , the dependence of Eq. 5 with is modest because varies between 0.770.69. For typical BH SXTs, with , and hence, the empirical correlation, described by eq. 1, implies that the of the Hα line in BH SXTs traces the disc velocity at about 41% . And given that of the line flux is contained within one and that typical quiescent disc radii reach (Marsh et al., 1994; Casares et al., 1995b) we observe that the bulk of the Hα emission arises from the outermost regions of the accretion disc.
Equation 1 stems from the fact that the Keplerian velocity field in the Hα disc provides a fundamental dimension scale of the binary. Similarly to the rotational broadening of the donor star (see Wade & Horne 1988), the mean accretion disc velocity (traced by the ) scales with the donor star’s velocity. Since both are projected velocities along the line of sight, the dependence on inclination cancels out. However, unlike , this new correlation is only weakly dependent on binary mass ratio and hence results in a very tight linear regression. We also note that eq. 1 is more robust than a former empirical relation between and the double peak separation (Orosz et al., 1994; Orosz & Bailyn, 1995) because the latter traces the tidal (outer disc) radius which can be strongly affected by disc asymmetries, the presence of S-wave distortions driven by hot-spots and anomalously low (sub-Keplerian) velocities (e.g. North et al. (2002)).
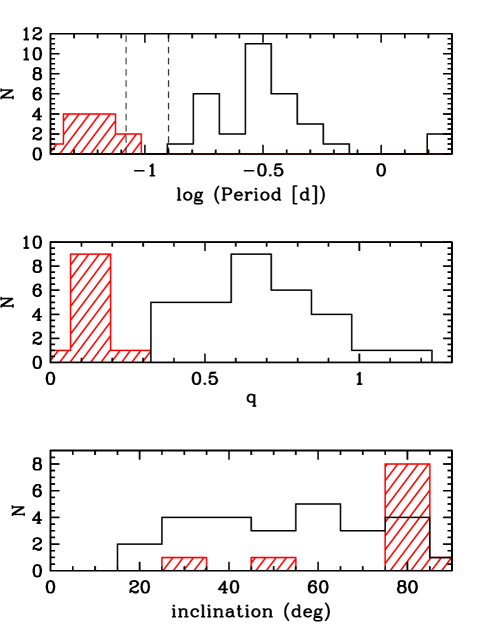
At this point it is instructive to compare how the CVs distribute in the plane. But prior to this it is important to asses the impact of possible selection effects. To start with, since the companion star is mostly detected above the period gap, our reference sample is, in principle, biased toward large mass ratios. The effect is further exacerbated by the fact that the CV population in the 3-4 h period range is dominated by SW Sex and Novalike stars, systems in permanent outburst (Rodríguez-Gil et al., 2007). This explains the paucity of CVs with periods d in our list. To compensate for the deficit of binaries with small values we made an effort to incorporate short period CVs. These are, however, strongly skewed towards high inclinations because only eclipsing CVs can yield reliable values (through light curve modeling) when the companion star is not detected. Fig. 4 presents histograms of the distribution of orbital periods, mass ratios and inclinations in our CV sample, clearly depicting these selection effects. Mass ratios and inclination values were compiled from the references listed in Table 4 and Ritter & Kolb (2003). In the figure we make a distinction between CVs above and below/within the period gap.
Figure 4 shows that the distribution of mass ratios is clearly bimodal and can be described by two Gaussians: 32 long-period CVs cluster at with while 11 short-period CVs define a much narrow peak centered at and with . We note that this is overall similar to the distribution of mass ratios obtained from the entire CV data available in the Ritter’s catalogue (Ritter & Kolb, 2003). The figure also highlights the fact that our short period CVs are strongly biased toward high inclinations. By constrast, there seems to be no significant bias in the inclination of CVs above the gap. In view of this, we find justified to distinguish hereafter between short-period CVs (i.e. below/within the gap) and long-period CVs (above the gap), with the latter not being strongly affected by selection effects.
The bottom panel in Fig. 3 presents the location of the CVs in the plane. The figure shows that long-period CVs display a similar regression to that found for SXTs albeit flatter, i.e. for a given , Hα lines are systematically broader than in SXTs. A linear fit yields , relation which could be used to infer velocities for quiescent CVs above the period gap. We attribute the flatter slope of the CV correlation to their comparatively larger mass ratios, which leads to smaller and thus smaller disc radii (in binary separation units).
If we now bring q=0.63 (i.e. the peak in the q distribution of long-period CVs) into eqs. 5-6 and set from the empirical fit one obtains , in excellent agreement with what was found for SXTs. This implies that the of the Hα line is always formed at about 42% , irrespectively of the binary mass ratio. Despite the large spread in mass ratios the CV correlation appears quite narrow, a consequence of the very weak dependence of with for large values (see dotted lines in the bottom panel of Fig. 3).
The group of short-period CVs, on the other hand, concentrate at large values because of their high inclinations. They are seen to depart from the trend defined by the long-period CVs, approaching the SXT correlation, a result of their small q-values. Although the short-period CVs represent a very biased sample, they are of particular interest because they define the upper limit in the distribution of the CV population.
4 The plane
In a given system, the of any emission line depends on the binary inclination, orbital period and the mass of the compact object. By bringing into eq. 5 and using Kepler’s Third Law we find
| (7) |
Here, the dependence on mass ratio is extremely weak, with varying in the range 0.80 to 0.69 for . Therefore, we can safely assume
| (8) |
where is a constant that can be calibrated using and values listed in Table 3, together with dynamical masses and inclinations available in the literature for 9 SXTs (also listed in Table 3). These yield a mean value km s-1, when and are expressed in units of M⊙ and days, respectively.
On the other hand, the of the Hα line depends on the binary geometry. For instance, Warner (1986) showed that the of Hβ in CVs increases with inclination because of the reduction of continuum brightness as the disc is seen at large inclinations. Therefore, to a first-order approximation one can assume
| (9) |
where the constant Å has been calibrated using the distribution of s and inclinations listed in Table 3 222If we use instead reliable masses and inclinations reported in literature for a subset of 25 CVs from our Table 4 we find km s-1 and Å, in good agreement with the calibration obtained using SXTs..
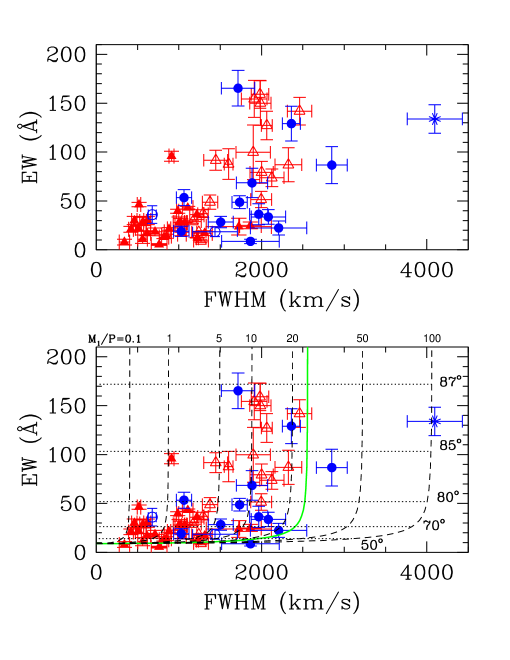
Fig. 5 displays our sample of SXTs and CVs in the plane. Here we have used open triangles to mark eclipsing CVs. BHs are a factor more massive than white dwarfs or NS and thus should possess, on average, wider Hα lines by a factor . Instead, we observe that only one BH (XTE J1118+480) stands out clearly in the right side of the diagram with km s-1. The remaining BHs are mixed up with CVs at lower values because they either have long orbital periods (i.e. cases of V404 Cyg and BW Cir with km s-1) or are viewed at lower inclinations. Fortunately, they cluster in the central part of the diagram between km s-1, a region populated by eclipsing CVs. Since the latter are easily detected through deep (2-3 mag) eclipses we conclude that non-eclipsing binaries with km s-1 are good candidates to host BHs. Incidentally, a population of (short-period) eclipsing BHs with very wide Hα lines would be expected in the right part of the diagram. Scaling from the eclipsing CVs we predict them to show a factor larger widths i.e. km s-1. As a matter of fact, the transient X-ray binary Swift J1357-0933 has been proposed as an extreme inclination BH, although no dynamical solution is yet available (Corral-Santana et al., 2013). We have recently obtained 4 Hα spectra of Swift J1357-0933 with OSIRIS and the R300R grism on the 10.4m Gran Telescopio Canarias (GTC) on 29-30 June 2013, from which we measure km s-1 and . These values are indeed consistent with a short period BH seen at very high inclination. The position of Swift J1357.2-0933 is indicated by an asterisk in the diagram.
Using eqs. 8-9 one can define regions of constant and inclination in the plane. These are marked in the bottom panel of Fig. 5 using dashed and dotted lines respectively. We stress, however, that the quoted inclinations must be considered as mere indicative given the crude approximation involved in eq. 9. The figure suggests (with all the caveats associated to low number statistics) that, for a given , BHs tend to have lower than CVs. This could be explained because, due to their shallower potential wells, CVs must be seen at higher inclinations to mimic the same projected disc velocities as BHs and, therefore, their Hα fluxes are less diluted by the accretion disc continuum. It is interesting to note the position of GRO J0422+320 in the upper left side of the diagram. While the mass of its BH is quite uncertain (see Casares & Jonker 2014) both the large and low factor suggest it hosts a low-mass BH, in line with the results of Casares et al. (1995a) and Gelino & Harrison (2003).
Finally, we can tentatively define a forbidden region for CVs in the plane by taking extreme parameters i.e. M☉ and min, the period minimum spike observed in the distribution of CV periods (Gänsicke et al., 2009). This yields M⊙/d and thus , limit which is marked by a green solid line in the plot. As a test we have examined a random sample of 236 dwarf novae selected from Sloan DR7. Sloan CVs show the same trend as seen in Fig. 5 i.e. they populate the region leftwards of the green line, with a large spread towards high s up to 350 Å.
5 Discussion: new strategies to detect dormant BHs
To make progress in our understanding of the formation and evolution of Galactic BHs it is essential to discover a large sample of secured (dynamically confirmed) BHs. This new sample would allow us to constrain the number density, the orbital period distribution and, ultimately, the BH mass spectrum. Only then we will be able to address fundamental questions such as the role of supernova models in shaping the distribution of BH masses, a current hot topic in the community (Özel et al., 2010; Farr et al., 2011; Kreidberg et al., 2012; Belczynski et al., 2012). Deep Hα surveys of the Galactic plane, combined with spectroscopic surveys, can efficiently select samples of Hα emitting objects with km s-1. This width cut would allow instant removal of Galactic populations of narrow Hα emitters such as planetary nebulae, Be, chromospheric stars, T Tauri and other YSOs. Only high inclination CVs, due to the large gravitational fields of their accreting white dwarfs, are able to produce wide Hα lines.
Fortunately, as we have shown, the width of the Hα line in quiescent BH and NS SXTs is tightly correlated with the projected velocity of the donor star. The relation can, therefore, be exploited, together with supplementary information on orbital periods (e.g. from light curve variability), to gather ”preliminary” mass functions () of compact objects from single epoch spectroscopy i.e. , where is given in days and in km s-1. values can be estimated from single integrations rather than expensive time resolved spectroscopy, allowing a search for dynamical BHs in much deeper fields and using a factor 4 lower spectral resolution than usually employed. Therefore, the novel strategy that we propose is clearly much more efficient than standard spectroscopic techniques, aiming at measuring the orbit of the donor star from the Doppler shift of weak absorption lines. And it may be the only way to infer mass functions in extremely faint BH SXTs i.e. the bulk of the Galactic population. We also note that our technique can be easily executed in crowded regions like globular clusters, where HST time-series photometry can yield orbital periods while ground-based spectroscopy is severely limited by seeing conditions.
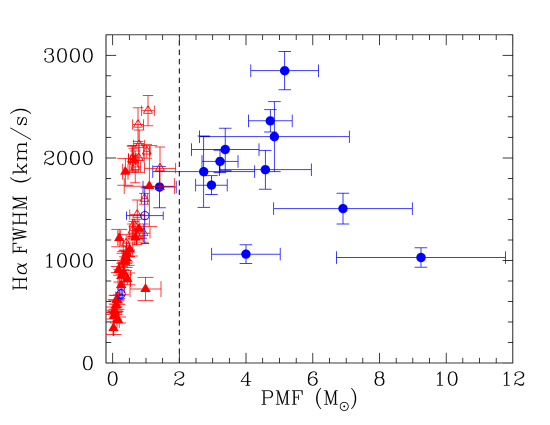
Fig. 6 demonstrates how BHs are nicely segregated from CVs and NS using the correlation. Every BH (except GRO J0422+320) is located in the right hand part of the diagram, beyond the dotted vertical line. Therefore, targets with M⊙ are strong candidates to host BHs. It should be noted that the plotted CV are, in most cases, robust upper limits to true mass functions because, by adopting eq. 1 we overestimate their real values. By comparing the values with the true (dynamical) mass function of BHs one can estimate the typical uncertainty introduced by the correlation. Relative errors in mass function are found to follow an approximate Gaussian distribution with . Therefore, the correlation allows us to estimate mass functions with typically 10% uncertainty. As an example, we have applied eq. 1 to Swift J1357.2-0933, where our quiescent GTC spectra yield km s-1. Extrapolating from eq. 1 we predict km s-1 which, when combined with d, (Corral-Santana et al., 2013) leads to a record mass function M⊙. We note that this figure might even be slightly underestimated since the GTC spectra were taken only d. after the peak of the outburst (see Sect. 3). In any case, the effect would be small compared to our errorbar, which is dominated by propagating the large uncertainty (driven by line variability) into the relation and the mass function equation.
A big step forward in the exploitation of the relation will likely come from the use of imaging techniques. Accurate Hα widths can be measured directly through a combination of customized narrow-band filters, removing the need for any spectroscopy at all. This brings in a new observational signature that we coin here Photometric Mass Function (, taking advantage from the same acronym before). s open a novel concept, i.e. that of weighting mass functions photometrically, and lay the ground for the efficient discovery of new hibernating BHs in large survey volumes. We are currently working on this strategy.
Finally, it should be borne in mind that there is a strong selection effect against detecting high inclination BHs in X-ray selected samples. This is because flared accretion discs obscure X-rays and indeed none of the currently known dynamical BHs has an inclination (Narayan & McClintock, 2005). Since a -based sample will be selected by Hα widths and not X-ray emission we expect this strategy will uncover a significant number of high inclination and even eclipsing BHs. These hold the prospect to render the most accurate BH masses yet because the relative uncertainty in the inclination dominates the mass error budget. Clearly, the newly discovered BHs will have an strategic impact in the construction of the BH mass spectrum.
References
- Armas Padilla et al. (2014) Armas Padilla, M., Wijnands, R., Degenaar, N., Muñoz-Darias, T., Casares, J. & Fender, R.P. 2014, MNRAS, 444, 902
- Baptista et al. (1998) Baptista, R., Catalán, M.S., Horne, K. & Zilli, D. 1998, MNRAS, 300, 233
- Baptista et al. (2000) Baptista, R., Catalán, M.S. & Costa, L. 2000, MNRAS, 316, 529
- Baptista & Catalán (2001) Baptista, R. & Catalán, M.S., 2001, MNRAS, 324, 599
- Baptista et al. (2003) Baptista, R., Borges, B.W., Bond, H.E., Jablonski, F., Steiner, J.E. & Grauer, A.D., 2003 MNRAS, 345, 889
- Barrera & Vogt (1989) Barrera, L.H. & Vogt, N., 1989 A&A, 220, 99
- Beekman et al. (2000) Beekman, G., Somers, M., Naylor, T. & Hellier, C. 2000, MNRAS, 318, 9
- Belczynski & Ziolkowski (2009) Belczynski, K. & Ziolkowski, J. 2009, ApJ, 707, 870
- Belczynski et al. (2012) Belczynski, K., Wiktorowicz, G., Fryer, C.L., Holz, D.E. & Kalogera, V. 2012, ApJ, 757, 91
- Billington et al. (1996) Billington, I., Marsh, T.R. & Dhillon, V.S. 1996, MNRAS, 278, 673
- Borges et al. (2008) Borges, B.W., Baptista, R., Papadimitriou, C. & Giannakis, O. 2008, A&A, 480, 481
- Brown et al. (2000) Brown, G.E., Lee, C.-H., Wijers, R.A.M.J., Lee, H.K., Israelian, G. & Bethe, H.A. 2000, NewA, 5, 191
- Bruch (2003) Bruch, A. 2003, A&A, 409, 647
- Bruch et al. (1997) Bruch, A., Vrielmann, S., Hessman, F.V., Kochsiek, A. & Schimpke, T. 1997, A&A, 327, 1107
- Cantrell et al. (2010) Cantrell, A.G. et al. 2010, ApJ, 710, 1127
- Casares (1996) Casares, J. 1996, Astrophysics and Space Science Library, Proc. of the 158th coll. of IAU, A. Evans and Janet H. Wood ed., Dordrecht: Kluwer Academic Publishers, 208, p.395
- Casares et al. (1991) Casares, J., Charles, P.A., Jones, D.H.P., Rutten, R.G.M. & Callanan, P.J. 1991, MNRAS, 250, 712
- Casares & Charles (1992a) Casares, J. & Charles, P.A. 1992a, MNRAS, 255, 7
- Casares et al. (1992b) Casares, J., Charles, P.A. & Naylor, T. 1992b, Nature, 355, 614
- Casares et al. (1993) Casares, J., Charles, P.A., Naylor, T. & Pavlenko, E.P. 1993, MNRAS, 265, 834
- Casares & Charles (1994) Casares, J. & Charles, P.A. 1994, MNRAS, 271, L5
- Casares et al. (1995a) Casares, J., Martin, A.C., Charles, P.A., Martín, E.L., Rebolo, R., Harlaftis, E.T. & Castro-Tirado, A.J. 1995a, MNRAS, 276, L35
- Casares et al. (1995b) Casares, J. Charles, P.A & Marsh, T.R. 1995b, MNRAS, 277, L45
- Casares et al. (1997) Casares, J., Martín, E.L., Charles, P.A., Molaro, P. & Rebolo, R. 1997, NewA, 1, 299
- Casares et al. (2002) Casares, J., Dubus G., Shahbaz, T., Zurita, C. & Charles, P.A. 2002, MNRAS, 329, 29
- Casares et al. (2004) Casares, J., Zurita C., Shahbaz, T., Charles, P.A. & Fender, R.P. 2004, ApJ, 613, L133
- Casares et al. (2007) Casares, J., Bonifacio , P., González Hernández, J.I., Molaro, P. & Zoccali, M. 2007, A&A, 470, 1033
- Casares et al. (2009a) Casares, J. et al. 2009a, ApJS, 181, 238
- Casares et al. (2009b) Casares, J., Martínez-Pais, I.G. & Rodríguez-Gil, P. 2009b, MNRAS, 399, 1534
- Casares & Jonker (2014) Casares, J. & Jonker, P.G. 2014, SSRv, 183, 223
- Casares et al. (2014) Casares, J., Negueruela, I., Ribó, M., Ribas, I., Paredes, J.M., Herrero, A. & Simón-Díaz, S. 2014, Nature, 505, 378
- Copperwheat et al. (2010) Copperwheat, C.M., Marsh, T.R., Dhillon, V.S., Littlefair, S.P., Hickman, R., Gänsicke, B.T. & Southworth, J. 2010, MNRAS, 402, 1824
- Copperwheat et al. (2012) Copperwheat, C.M. et al. 2012, MNRAS, 421, 149
- Corral-Santana et al. (2008) Corral-Santana, J.M., Casares, J., Martínez-Pais, I.G. & Rodríguez-Gil, P. 2008, AIPC, 1010, 79
- Corral-Santana et al. (2011) Corral-Santana, J.M., Casares, J., Shahbaz, T., Zurita, C., Martínez-Pais, I.G. & Rodríguez-Gil, P. 2011, MNRAS, 413, L15
- Corral-Santana et al. (2013) Corral-Santana, J.M., Casares, J., Muñoz-Darias, T., Rodríguez-Gil, P., Shabaz, T., Zurita, C., Torres, M.A.P. & Tyndall, A. 2013, Science, 339, 1048
- Davey & Smith (1992) Davey, S. & Smith, R.C. 1992, MNRAS, 257, 476
- D’avanzo et al. (2005) D’avanzo, P., Campana, S., Casares, J., Israel, G.L., Covino, S., Charles, P.A. & Stella, L. 2005, A&A, 444, 905
- Drew et al. (1993) Drew, J.E., Jones, D.H.P. & Woods, J.A. 1993, MNRAS, 260, 803
- Echevarría et al. (2007) Echevarría, J., Michel, R., Costero, R. & Zharikov, S. 2007, A&A, 462, 1069
- Eggleton (1983) Eggleton, P.P. 1983, ApJ, 268, 368
- Farr et al. (2011) Farr, W.M. , Sravan, N., Cantrell, A., Kreidberg, L., Bailyn, C.D., Mandel, I. & Kalogera, V. 2011, ApJ, 741, 103
- Fender & Gallo (2014) Fender, R. & Gallo, E. 2014, SSRv, 183, 323
- Filippenko et al. (1999) Filippenko, A.V., Leonard, D.C., Matheson, T., Li, W., Moran, E.C. & Riess, A.G. 1999, PASP, 111, 969
- Friend et al. (1990) Friend, M.T., Martin, J.S., Connon Smith, R. & Jones, D.H.P. 1990, MNRAS, 246, 637
- Gänsicke et al. (2009) Gänsicke, B.T. et al. 2009, MNRAS, 397, 2170
- Gelino et al. (2001) Gelino, D.M., Harrison, T.E. & McNamara, B.J. 2001, AJ, 122, 971
- Gelino & Harrison (2003) Gelino, D.M. & Harrison, T.E. 2003, ApJ, 599, 1254
- Gilliland (1982) Gilliland, R. L. 1982, ApJ, 263, 302
- González Hernández & Casares (2010) Gonzalez Hernandez, J.I. & Casares, J. 2010, A&A, 516, A58
- González Hernández et al. (2011) Gonzalez Hernandez, J.I., Casares, J., Rebolo, R., Israelian, G., Filippenko, A.V. & Chornock, R. 2011, ApJ, 738, 95
- González Hernández et al. (2012) González Hernández, J.I., Rebolo, R. & Casares, J. 2012, ApJ, 744, L25
- Greenhill et al. (2006) Greenhill, J.G. et al. 2006, MNRAS, 372, 1129
- Grudzinska et al. (2015) Grudzinska, M. et al. 2015, MNRAS, arXiv150403146
- Harlaftis et al. (1994) Harlaftis, E.T., Marsh, T.R., Dhillon, V.S. & Charles, P.A. 1994, MNRAS, 267, 473
- Harlaftis et al. (1996) Harlaftis, E.T., Horne, K. & Filippenko, A.V. 1996, PASP, 108, 762
- Harlaftis et al. (1997) Harlaftis, E.T., Steeghs, D., Horne, K. & Filippenko, A.V. 1997, AJ, 114, 1170
- Hessman (1988) Hessman, F.V. 1988, A&AS, 72, 515
- Hessman et al. (1984) Hessman, F.V., Robinson, E.L., Nather, R.E. & Zhang, E.-H. 1984, ApJ, 286, 747
- Horne et al. (1986) Horne, K., Wade, R.A. & Szkody, P. 1986, MNRAS, 219, 791
- Horne et al. (1991) Horne, K., Wood, J.H. & Stiening, R.F. 1991, ApJ, 378, 271
- Horne et al. (1993) Horne, K., Welsh, W.F. & Wade, R.A. 1993, ApJ, 410, 357
- Hynes et al. (2002) Hynes, R.I. et al. 2002, MNRAS, 330, 1009
- Ioannou et al. (2004) Ioannou, Z., Robinson, E.L., Welsh, W.F. & Haswell, C.A. 2004, AJ, 127, 481
- Jonker et al. (2011) Jonker, P.G. et al. 2011, ApJS, 194, 18
- Khargharia et al. (2010) Khargharia, J., Froning, C.S. & Robinson, E.L. 2010, ApJ,716, 1105
- Khargharia et al. (2013) Khargharia, J., Froning, C.S., Robinson, E.L. & Gelino, D.M. 2013, AJ,145, 21
- Kraft et al. (1969) Kraft, R.P., Krzeminski, W. & Mumford, G.S. 1969, ApJ, 158, 589
- Kreidberg et al. (2012) Kreidberg, L., Bailyn, C.D., Farr, W. & Kalogera, V. 2012, ApJ, 757, 36
- Lasota (2001) Lasota, J.-P. 2001, NewAR, 45, 449
- Littlefair et al. (2008) Littlefair, S.P. et al. 2008, MNRAS, 388, 1582
- Maccarone (2005) Maccarone, T.J. 2005, MNRAS, 360, L30
- Maccarone & Patruno (2013) Maccarone, T.J. & Patruno, A. 2013, MNRAS, 428, 1335
- Marsh et al. (1987) Marsh, T.R., Horne, K. & Shipman, H.L. 1987, MNRAS, 225, 551
- Marsh et al. (1990) Marsh, T.R., Horne, K., Schlegel, E.M., Honeycutt, R.K. & Kaitchuck, R.H. 1990, ApJ, 364, 637
- Marsh et al. (1994) Marsh, T.R., Robinson, E.L. & Wood, J.H. 1994, MNRAS, 266, 137
- Martín et al. (1995) Martín, E.L., Casares, J., Charles, P.A. & Rebolo, R. 1995, A&A, 303, 785
- Menou et al. (1999) Menou, K., Narayan, R. & Lasota, J.-P. 1999, ApJ, 513, 811
- Miller-Jones et al. (2011) Miller-Jones, J.C.A., Jonker, P.G., Maccarone, T.J., Nelemans, G., Calvelo, D. E. 2011, ApJ, 739, L18
- Morales-Rueda et al. (2002) Morales-Rueda, L., Still, M.D., Roche, P., Wood, J.H. & Lockley, J.J. 2002, MNRAS, 329, 597
- Narayan & McClintock (2005) Narayan, R. & McClintock, J.E. 2005, ApJ, 623, 1017
- Narayan & McClintock (2008) Narayan, R. & McClintock, J.E. 2008, NewAR, 623, 1017
- Neustroev & Zharikov (2008) Neustroev, V.V. & Zharikov, S. 2008, MNRAS, 386, 1366
- North et al. (2000) North, R.C., Marsh, T.R., Moran, C.K.J., Kolb, U., Smith, R.C. & Stehle, R. 2000, MNRAS, 337, 1215
- North et al. (2002) North, R.C., Marsh, T.R., Kolb, U., Dhillon, V.S. & Moran, C.K.J. 2002, MNRAS, 313, 383
- Orosz et al. (1994) Orosz, J.A., Bailyn, C.D., Remillard, R.A., McClintock, J.E. & Foltz, C.B. 1994, ApJ, 436, 848
- Orosz & Bailyn (1995) Orosz, J.A. & Bailyn, C.D. 1995, ApJ, 446, L59
- Orosz et al. (1996) Orosz, J.A., Bailyn, C.D., McClintock, J.E. & Remillard, R.A. 1996, ApJ, 468, 380
- Orosz et al. (2002) Orosz, J.A. et al. 2002, ApJ, 568, 845
- Orosz et al. (2004) Orosz, J.A., McClintock, J.E., Remillard, R.A. & Corbel, S. 2004, ApJ, 616, 376
- Orosz et al. (2011) Orosz, J.A. et al. 2011, ApJ, 730, 75
- Özel et al. (2010) Özel, F., Psaltis, d., Narayan, R. & McClintock, J.E. 2010, ApJ, 725, 1918
- Patterson et al. (2008) Patterson, J., Thorstensen, J.R.& Knigge, C. 2008, PASP, 120, 510
- Patterson et al. (1998) Patterson, J., Richman, H., Kemp, J. & Mukai, K. 1998, PASP, 110, 403
- Peters & Thorstensen (2005) Peters, C.S. & Thorstensen, J.R. 2005, PASP, 117, 1386
- Pfahl et al. (2003) Pfahl, E., Rappaport, S. & Podsiadlowski, P. 2003, ApJ, 597, 1033
- Pyrzas et al. (2012) Pyrzas, S. et al. 2012, PASP, 124, 204
- Remillard et al. (1996) Remillard, R., Orosz, J.A., McClintock, J.E. & Bailyn, C.D. 1996, ApJ, 459, 226
- Ritter & King (2002) Ritter, H. & King, A.R. 2002, ASP, 261, 531
- Ritter & Kolb (2003) Ritter, H. & Kolb, U. 2003, A&A, 404, 301
- Robinson (1974) Robinson, E.L. 1974, ApJ, 193, 191
- Rodríguez-Gil et al. (2007) Rodríguez-Gil, P. et al. 2007, MNRAS, 377, 1747
- Rodríguez-Gil et al. (2009) Rodríguez-Gil, P. et al. 2009, A&A, 496, 805
- Romani (1998) Romani, R.W. 1998, A&A, 333, 583
- Savoury et al. (2011) Savoury, C.D.J. et al. 2011, MNRAS, 415, 2025
- Savoury et al. (2012) Savoury, C.D.J., Littlefair, S.P., Marsh, T.R., Dhillon, V.S., Parsons, S.G., Copperwheat, C.M. & Steeghs, D. 2012, MNRAS, 422, 469
- Shahbaz et al. (2014) Shahbaz, T., Watson, C.A. & Dhillon, V.S. 2014, MNRAS, 440, 504
- Shafter & Harkness (1986) Shafter, A.W. & Harkness, R.P. 1986, AJ, 92, 658
- Smak (1984) Smak, J. 1984, Acta Astron., 34, 93
- Southworth et al. (2006) Southworth, J. et al. 2006, MNRAS, 373, 687
- Southworth et al. (2009) Southworth, J., Hickman, R.D.G., Marsh, T.R., Rebassa-Mansergas, A., Gänsicke, B.T., Copperwheat, C. M. & Rodríguez-Gil, P. 2009, A&A, 507, 929
- Skidmore et al. (2000) Skidmore, W., Mason, E., Howell, S.B., Ciardi, D.R., Littlefair, S. & Dhillon, V.S. 2000, MNRAS, 318, 429
- Steeghs et al. (2001) Steeghs, D., O’Brien, K., Horne, K., Gomer, R. & Oke, J.B. 2001, MNRAS, 323, 484
- Steeghs et al. (2007) Steeghs, D., Howell, S.B., Knigge., C., Gänsicke, B.T., Sion, E.M. & Welsh, W. 2007, ApJ, 667, 442
- Stover (1981) Stover, R.J. 1981, ApJ, 249, 673
- Tanaka & Shibazaki (1996) Tanaka, Y. & Shibazaki, N. 1996, ARA&A, 34, 607
- Tappert et al. (2001) Tappert, C., Thorstensen, J.R., Fenton, W.H., Bennert, N., Schmidtobreick,L. & Bianchini, A. 2001, A&A, 380, 533
- Thorstensen et al. (2002a) Thorstensen, J.R., Fenton, W.H., Patterson, J., Kemp, J., Halpern, J. & Baraffe, I. 2002a, PASP, 114, 1117
- Thorstensen et al. (2002b) Thorstensen, J.R., Fenton, W.H., Patterson, J., Kemp, J., Krajci, T. & Baraffe, I. 2002b, ApJ, 567, L49
- Thorstensen et al. (2004) Thorstensen, J.R., Fenton, W.H. & Taylor, C.J. 2004, PASP, 116, 300
- Tomsick et al. (2001) Tomsick, J.A., Heindl, W.A., Chakrabarty, D., Halpern, J.P. & Kaaret, P. 2001, ApJ, 559, L123
- Torres et al. (2002) Torres, M.A.P., Casares, J., Martínez-Pais, I.G. & Charles, P.A. 2002, MNRAS, 334, 233
- Tulloch et al. (2009) Tulloch, S.M., Rodríguez-Gil, P. & Dhillon, V.S. 2009, MNRAS, 397, L82
- van den Heuvel (1992) van den Heuvel, E.P.J. 1992, Proc. Inter. Space Year Conf. ESA ISY-3, p.29.
- Wade & Horne (1988) Wade, R.A. & Horne, K. 1988, ApJ, 324, 411
- Warner (1986) Warner, B. 1986, MNRAS, 222, 11
- Watson et al. (2007) Watson, C. A., Steeghs, D., Shahbaz, T. & Dhillon, V.S. 2007, MNRAS, 382, 1105
- Webb et al. (2000) Webb, N.A., Naylor, T., Ioannou, Z., Charles, P.A. & Shahbaz, T. 2000, MNRAS, 317, 528
- Wood et al. (1986) Wood, J., Horne, K., Berriman, G., Wade, R., O’Donoghue, D. & Warner, B. 1986, MNRAS, 219, 629
- Wood & Horne (1990) Wood, J. & Horne, K. 1990, MNRAS, 242, 606
- Wood et al. (2005) Wood, M.A. et al. 2005, ApJ, 634, 570
- Yungelson et al. (2006) Yungelson, L.R., Lasota, J.-P, Nelemans, G., Dubus, G., van den Heuve, E.P.J., Dewi, J. & Portegies Zwart, S. 2006, A&A, 454, 559
- Zurita et al. (2000) Zurita, C. et al. 2000, MNRAS, 316, 137
| Object | # Spectra | Year | Resolution (km/s) | ref |
|---|---|---|---|---|
| Black Holes | ||||
| V404 Cyg | 266 | 1989-2009 | 6-180 | 1-8 |
| BW Cir | 96 | 1995-2006 | 70-110 | 9-10 |
| XTE J1550 -564 | 33 | 2001, 2008 | 55-165 | 11-12 |
| N. Oph 77 | 1 | 1993 | 180 | 13 |
| N, Mus 91 | 29 | 1993-1995 | 74-90 | 14 |
| GS 2000+25 | 25 | 1995 | 196 | 15 |
| A0620-00 | 20 | 2000 | 7 | 16 |
| XTE J1650-500 | 15 | 2002 | 35 | 17 |
| N Vel 93 | 1 | 1998 | 120 | 18 |
| XTE J1859+226 | 10 | 2010 | 255 | 19 |
| GRO J0422+320 | 21 | 1994-1995, 2009 | 230-630 | 8, 20 |
| XTE J1118+480 | 120 | 2011 | 120 | 21 |
| Neutron Stars | ||||
| Cen X-4 | 90 | 1993-2002 | 6-74 | 22-24 |
| XTE J2123-058 | 20 | 2000 | 123-183 | 25 |
References. — (1) Casares et al. (1991); (2) Casares & Charles (1992a); (3) Casares et al. (1992b); (4) Casares et al. (1993); (5) Casares & Charles (1994); (6) Hynes et al. (2002); (7) González Hernández et al. (2011); (8) This paper; (9) Casares et al. (2004); (10) Casares et al. (2009a); (11) Orosz et al. (2011); (12) Orosz et al. (2002); (13) Remillard et al. (1996); (14) Casares et al. (1997); (15) Casares et al. (1995b); (16) González Hernández & Casares (2010); (17) Orosz et al. (2004); (18) Filippenko et al. (1999); (19) Corral-Santana et al. (2011); (20) Casares et al. (1995a); (21) González Hernández et al. (2012);(22) Torres et al. (2002); (23) D’avanzo et al. (2005); (24) Casares et al. (2007); (25) Casares et al. (2002) .
| Object | # Spectra | Year | Resolution (km/s) | ref |
|---|---|---|---|---|
| GK Per | 8 | 1992, 1995, 1998 | 25-70 | 1-2 |
| SDSS 2044-04 | - | 2001-2004 | 190-210 | 3 |
| BV Cen | 63 | 2004 | 10 | 4 |
| RX 1951.7+3716 | - | 2001-2004 | 190-210 | 3 |
| UY Pup | - | 2002-2003 | 190-210 | 5 |
| EY Cyg | 103 | 1998-2001, 2004 | 15-20 | 6 |
| DX And | 4 | 1993 | 180 | 7 |
| SY Cnc | 28 | 1992, 1998-1999, 2003, 2008 | 25-70 | 1,8 |
| AT Ara | - | 2000 | 100 | 9 |
| RU Peg | 2 | 2008 | 60 | 2 |
| GY Hya | - | 2001-2004 | 190-210 | 3 |
| CH UMa | 16 | 2008-2009 | 60-320 | 2 |
| V392 Hya | - | 2001-2004 | 190-210 | 3 |
| RY Ser | - | 2003 | 190-210 | 5 |
| HS 0218+3229 | 56 | 2002 | 55-75 | 10 |
| EM Cyg | 3 | 2008 | 60 | 2 |
| Z Cam | 12 | 2009 | 60 | 2 |
| SDSS 0813+45 | - | 2002 | 190-210 | 5 |
| V426 Oph | 4 | 2006 | 40 | 2 |
| SS Cyg | 23 | 2008 | 60-250 | 2 |
| LY UMa | - | 2000 | 190-500 | 11 |
| BF Eri | 5 | 2009 | 235 | 2 |
| TT Crt | - | 2000-2003 | 190-210 | 5 |
| AH Her | 10 | 1980-1981 | 60 | 12 |
| EX Dra | 31 | 2001 | 50 | 2 |
| HS 2325+8205 | 42 | 2005, 2007 | 215 | 13 |
| DQ Her | 4 | 2009 | 60 | 2 |
| SDSS J100658.40+233724 | 68 | 2008 | 140 | 14 |
| SS Aur | 28 | 2008, 2013 | 90-320 | 2 |
| U Gem | 32 | 1999, 2008 | 16-320 | 2,15 |
| CN Ori | 17 | 1986 | 137 | 16 |
| IP Peg | 28 | 1988, 2009 | 50-150 | 2,17 |
| CTCV J1300-3052 | 24 | 2010 | 45 | 18 |
| QZ Ser | - | 2002 | 200 | 19 |
| Z Cha | - | 1984 | 150 | 20 |
| HT Cas | 10 | 2008 | 60-190 | 2 |
| OY Car | 28 | 2010 | 46 | 21 |
| V2051 Oph | 31 | 1998, 2009 | 55-430 | 2,23 |
| SDSS 103533.02+055158.3 | 51 | 2006 | 70 | 23 |
| WZ Sge | 384 | 1996 | 25 | 24 |
| SDSS J143317.78+101123.3 | 38 | 2008 | 32 | 25 |
| SDSS 1507+52 | - | 2006 | 160 | 26 |
| EI Psc = J2329+0628 | - | 2001 | 180 | 27 |
Note. — Information on SDSS 2044-04, RX 1951.7+3716, UY Pup, AT Ara, GY Hya, V392 Hya, RY Ser, SDSS 0813+45, LY UMa, TT Crt, CN Ori, QZ Ser, Z Cha, SDSS 1507+52 and EI Psc has been extracted from literature. In the case of CN Ori, the and values are obtained from 17 individual measurements listed in table 1 of Barrera & Vogt (1989). The AH Her spectra are phased binned averages.
References. — (1) Martín et al. (1995); (2) this paper; (3) Peters & Thorstensen (2005); (4) Watson et al. (2007); (5) Thorstensen et al. (2004); (6) Echevarría et al. (2007); (7) Bruch et al. (1997); (8) Casares et al. (2009b); (9) Bruch (2003); (10) Rodríguez-Gil et al. (2009); (11) Tappert et al. (2001); (12) Horne et al. (1986); (13) Pyrzas et al. (2012); (14) Southworth et al. (2009); (15) Echevarría et al. (2007); (16) Barrera & Vogt (1989); (17) Harlaftis et al. (1994); (18) Savoury et al. (2012); (19) Thorstensen et al. (2002a); (20) Marsh et al. (1987); (21) Copperwheat et al. (2012); (22) Steeghs et al. (2001); (23) Southworth et al. (2006); (24) Skidmore et al. (2000), (25) Tulloch et al. (2009); (26) Patterson et al. (2008); (27) Thorstensen et al. (2002b) .
| Object | (d) | (km/s) | (km/s) | (Å) | (M⊙) | (deg) | ref †† This column provides references for the adopted values of , , and . |
|---|---|---|---|---|---|---|---|
| Black Holes | |||||||
| V404 Cyg | 6.47129 | 208.4 0.6 | 1029 94 | 19.0 5.2 | 1,2 | ||
| BW Cir | 2.54451 | 279.0 4.7 | 1062 91 | 53.4 8.2 | 3 | ||
| XTE J1550-564 | 1.5420333 | 363.1 6.0 | 1506 151 | 28.4 5.8 | 11.53.9 | 754 | 4 |
| N. Oph 77 | 0.5228 | 441.0 6.0 | 1885 189 | 68.5 15.1 | 6.21.2 | 7010 | 5 |
| N. Mus 91 | 0.4326058 | 406.0 7.0 | 1735 92 | 48.7 6.5 | 7.00.6 | 542 | 6,7 |
| GS 2000+25 | 0.3440915 | 519.9 5.1 | 2207 341 | 22.4 7.2 | 5.58.8 | 5874 | 8,9 |
| A0620-00 | 0.32301405 | 437.1 2.0 | 1966 110 | 36.4 10.8 | 6.60.3 | 511 | 10,11 |
| XTE J1650-500 | 0.3205 | 435.0 30.0 | 1866 348 | 8.7 2.3 | 12 | ||
| N Vel 93 | 0.285206 | 475.4 5.9 | 2082 208 | 33.7 7.4 | 13 | ||
| XTE J1859+226 | 0.274 | 541.0 70.0 | 2361 109 | 129.1 17.8 | 14 | ||
| GRO J0422+320 | 0.2121600 | 380.6 6.5 | 1716 202 | 165.3 18.2 | 15 | ||
| XTE J1118+480 | 0.1699337 | 708.8 1.4 | 2850 187 | 86.7 18.9 | 6.98.2 | 6879 | 16,17 |
| Neutron Stars | |||||||
| Cen X-4 | 0.6290522 | 144.6 0.3 | 678 48 | 36 9 | 1.94 | 32 | 18,19 |
| XTE J2123-058 | 0.24821 | 298.5 6.9 | 1437 272 | 18.5 5.0 | 1.50.3 | 734 | 20,21 |
References. — (1) Casares (1996); (2) Khargharia et al. (2010); (3) Casares et al. (2009a); (4) Orosz et al. (2011); (5) Harlaftis et al. (1997); (6) Orosz et al. (1996); (7) Gelino et al. (2001); (8) Harlaftis et al. (1996); (9) Ioannou et al. (2004); (10) González Hernández & Casares (2010); (11) Cantrell et al. (2010); (12) Orosz et al. (2004); (13) Filippenko et al. (1999); (14) Corral-Santana et al. (2011); (15) Webb et al. (2000); (16) González Hernández et al. (2012); (17) Khargharia et al. (2013); (18) Casares et al. (2007); (19) Shahbaz et al. (2014); (20) Tomsick et al. (2001); (21) Zurita et al. (2000).
| Object | (d) | (km/s) | (km/s) | (Å) | ref †† This column provides references for the adopted values of and . |
|---|---|---|---|---|---|
| GK Per | 1.9968 | 120.5 0.7 | 722 113 | 18.1 4.0 | 1 |
| SDSS 2044-04 | 1.68 | 90.0 8.0 | 420 29 | 21.0 2.9 | 2 |
| BV Cen | 0.611179 | 137.3 0.3 | 820 58 | 13.0 1.4 | 3-4 |
| RX 1951.7+3716 | 0.492 | 81.0 7.0 | 566 40 | 29.0 4.1 | 2 |
| UY Pup | 0.479269 | 102.0 4.0 | 615 43 | 17.0 2.4 | 5 |
| EY Cyg | 0.4593249 | 54.0 2.0 | 341 63 | 8.0 3.0 | 5 |
| DX And | 0.4405019 | 105.8 3.8 | 761 96 | 5.4 0.9 | 7-8 |
| SY Cnc | 0.3823753 | 88.0 2.9 | 560 58 | 10.9 4.2 | 9 |
| AT Ara | 0.37551 | 99.5 3.2 | 618 43 | 30.0 4.2 | 10 |
| RU Peg | 0.3746 | 121.0 2.0 | 881 21 | 21.4 01.4 | 11 |
| GY Hya | 0.3472309 | 176.08.0 | 1267 89 | 9.0 1.3 | 2 |
| CH UMa | 0.3431843 | 76.0 3.0 | 518 22 | 46.3 2.2 | 5 |
| V392 Hya | 0.324952 | 144.0 9.0 | 850 60 | 14.0 2.0 | 2 |
| RY Ser | 0.3009 | 87.0 6.0 | 519 36 | 22.0 3.1 | 5 |
| HS 0218+3229 | 0.297229661 | 162.4 1.4 | 1023 70 | 27.9 4.0 | 12 |
| EM Cyg | 0.290909 | 202.0 3.0 | 1242 86 | 18.0 0.9 | 13-14 |
| Z Cam | 0.289840 | 193.0 17.0 | 1107 64 | 43.1 1.3 | 15 |
| SDSS 0813+45 | 0.2890 | 54.0 7.0 | 461 32 | 30.0 4.2 | 5 |
| V426 Oph | 0.285314 | 179.0 2.0 | 1224 13 | 12.5 0.3 | 16-17 |
| SS Cyg | 0.27512973 | 165.0 1.0 | 986 14 | 39.5 2.0 | 17-18 |
| LY UMa | 0.271278 | 141.0 3.0 | 1002 70 | 28.0 5.6 | 19 |
| BF Eri | 0.270881 | 182.5 0.9 | 1069 34 | 27.7 0.5 | 20 |
| TT Crt | 0.2683522 | 212.0 5.0 | 1310 92 | 17.0 2.4 | 5 |
| AH Her | 0.258116 | 175.0 2.0 | 1037 52 | 16.2 1.9 | 18,21 |
| EX Dra | 0.20993698 | 210.0 14.0 | 1292 63 | 37.0 4.0 | 22-23 |
| HS 2325+8205 | 0.194334535 | 237.0 28.0 | 1377 93 | 48.8 7.2 | 24 |
| DQ Her | 0.193620919 | 227.0 10.0 | 1168 101 | 28.8 1.5 | 25-26 |
| SDSS J100658+233724 | 0.18591324 | 258.0 12.0 | 1446 144 | 91.7 10.2 | 27 |
| SS Aur | 0.1828 | 167.0 15.0 | 911 30 | 95.8 5.2 | 28-29 |
| U Gem | 0.17690619 | 298.4 9.0 | 1602 53 | 87.7 15.6 | 30-31 |
| CN Ori | 0.16319006 | 231.0 7.0 | 1725 395 | 23.8 8.6 | 31-32 |
| IP Peg | 0.1582061029 | 331.3 5.8 | 1899 208 | 99.8 28.0 | 33-34 |
| CTCV J1300-3052 | 0.088940717 | 378.0 6.0 | 2064 66 | 127.2 14.7 | 35-36 |
| QZ Ser | 0.0831612 | 207.0 5.0 | 1218 85 | 36.0 5.0 | 37 |
| Z Cha | 0.0744992335 | 398.0 9.0 | 2000 140 | 79.3 11.1 | 38-39 |
| HT Cas | 0.0736472029 | 389.0 9.0 | 1912 155 | 154.4 18.9 | 40-41 |
| OY Car | 0.0631209343 | 470.0 2.7 | 2125 147 | 73.7 9.0 | 42-43 |
| V2051 Oph | 0.0624278634 | 436.0 11.0 | 1981 107 | 159.1 14.2 | 44-45 |
| SDSS 103533.02+055158.3 | 0.0570067 | 520.03.0 | 1996 125 | 51.5 8.3 | 46 |
| WZ Sge | 0.056688 | 510.0 15.0 | 1986 129 | 150.1 22.8 | 47-48 |
| SDSS J143317.78+101123.3 | 0.054240679 | 511.02.0 | 2460 148 | 141.914.1 | 46 |
| SDSS 1507+52 | 0.04625834 | 529.017.0 | 2325 163 | 87.017.4 | 49 |
| EI Psc = J2329+0628 | 0.044566 | 348.0 4.0 | 1865 131 | 25.0 3.5 | 50 |
References. — (1) Morales-Rueda et al. (2002); (2) Peters & Thorstensen (2005); (3) Gilliland (1982); (4) Watson et al. (2007); (5) Thorstensen et al. (2004): (6) Echevarría et al. (2007); (7) Bruch et al. (1997); (8) Drew et al. (1993) ; (9) Casares et al. (2009b); (10) Bruch (2003); (11) Stover (1981); (12) Rodríguez-Gil et al. (2009); (13) Robinson (1974); (14) North et al. (2000); (15) Kraft et al. (1969); (16) Hessman (1988); (17) North et al. (2002); (18) Hessman et al. (1984); (19) Tappert et al. (2001); (20) Neustroev & Zharikov (2008); (21) Horne et al. (1986); (22) Baptista et al. (2000); (23) Billington et al. (1996); (24) Pyrzas et al. (2012); (25) Wood et al. (2005); (26) Horne et al. (1993); (27) Southworth et al. (2009); (28) Shafter & Harkness (1986); (29) Davey & Smith (1992); (30) Marsh et al. (1990); (31) Friend et al. (1990); (32) Barrera & Vogt (1989); (33) Copperwheat et al. (2010); (34) Beekman et al. (2000); (35) Savoury et al. (2011); (36) Savoury et al. (2012); (37) Thorstensen et al. (2002a); (38) Wood et al. (1986); (39) Wood & Horne (1990); (40) Borges et al. (2008) ; (41) Horne et al. (1991); (42) Greenhill et al. (2006); (43) Copperwheat et al. (2012); (44) Baptista et al. (2003); (45) Baptista et al. (1998); (46) Littlefair et al. (2008); (47) Patterson et al. (1998); (48) Steeghs et al. (2007); (49) Patterson et al. (2008); (50)Thorstensen et al. (2002b).