Present address: ]University of Washington, Seattle, United States of America
Present address: ]Max-Planck-Institute of Quantum Optics, Garching, Germany.
Present address: ]LPSC, Université Grenoble Alpes, CNRS/IN2P3, Grenoble, France
Present address: ]Michigan State University, East-Lansing, USA.
Observation of gravitationally induced vertical striation of polarized ultracold neutrons by spin-echo spectroscopy
Abstract
We describe a spin-echo method for ultracold neutrons (UCNs) confined in a precession chamber and exposed to a magnetic field. We have demonstrated that the analysis of UCN spin-echo resonance signals in combination with knowledge of the ambient magnetic field provides an excellent method by which to reconstruct the energy spectrum of a confined ensemble of neutrons. The method takes advantage of the relative dephasing of spins arising from a gravitationally induced striation of stored UCN of different energies, and also permits an improved determination of the vertical magnetic-field gradient with an exceptional accuracy of 1.1 pT/cm. This novel combination of a well-known nuclear resonance method and gravitationally induced vertical striation is unique in the realm of nuclear and particle physics and should prove to be invaluable for the assessment of systematic effects in precision experiments such as searches for an electric dipole moment of the neutron or the measurement of the neutron lifetime.
Spin-echo resonances, first observed by Hahn in 1950 Hahn1950 , have proven to be a very powerful tool in nuclear magnetic resonance (NMR) experiments for identifying different sources of depolarization in spin-polarized samples. In particular, the – pulse sequence proposed by Carr and Purcell Carr1954 is widely applied to distinguish the intrinsic spin-lattice or spin-spin coherence time from the global coherence time dominated by dephasing of precessing spins due to spatially varying magnetic fields. Another established application of the spin-echo technique is in neutron scattering Mezei1972 where it is used to resolve correlation times below 1 . Essentially, the spin-echo technique can be applied in solid and soft matter samples where the intrinsic component is long compared to dephasing, which can even be the case for . Two similar components of depolarization Harris2014 exist in experiments using UCNs Baker2006 ; Ban2007 ; Serebrov2008 ; Lamoreaux2009 ; Altarev2009 ; Altarev2010 ; Serebrov2010 where coherence times of several hundred seconds have been achieved. The defining characteristic of UCNs is that they are reflected from appropriate material surfaces at all angles of incidence, even at room temperature, conserving kinetic energy as they do so. They can therefore be confined for observation times that are commensurate with neutron -decay: inelastic scattering with phonons from the storage-vessel walls contributes to their loss rate. This peculiarity also makes them ideal for neutron lifetime measurements. A measurement of the evolution of the energy spectrum in these UCN storage experiments can give insight into energy dependent systematic effects and could help to understand the disagreement between beam and storage experiments Olive2014 .
Ultracold neutrons have kinetic energies of the same order of magnitude as their gravitational potential energy above the lower confining surface. For any given UCN is constant during storage, although for the ensemble the average energy decreases over time because faster neutrons have a higher loss rate. These energy-dependent losses result in a time dependence of both depolarization terms, making a function of the free-precession time. For neutrons , so, e.g., UCN with kinetic energy of 200 neV can rise about 200 cm in the gravitational field. Therefore, it is convenient (and common) to refer to the energy of UCN in terms of the maximum height (in cm) attainable within Earth’s gravitational field, and we do so here during our analysis, although we revert to (in neV) for our final results.
Two channels of field-induced depolarization of UCNs exist: the known intrinsic depolarization due to inhomogeneous magnetic fields Cates1988PRA37 ; McGregor1990 ; Pendlebury2004 ; Schmid2008 ; Golub2011 ; Pignol2012a , and an energy-dependent relative dephasing for different energies in a vertical magnetic-field gradient. The latter shows an interplay between gravitationally defined spatial distributions of the neutrons and a vertical magnetic-field gradient and has only recently been studied theoretically Knecht2009 ; Harris2014 ; Afach2015PRD . It is the subject of this investigation which uses a new form of spin-echo spectroscopy that also circumvents effects provoked by the time-dependent softening of the UCN spectrum. Prior to this, the spin-echo resonance method was used in a study of Berry’s phase with UCNs to cancel any dynamic phase shift Filipp2009 with a coherence time of approximately 850 ms.
We have measured UCN spin-echo signals using an apparatus dedicated to the neutron electric dipole moment (nEDM) experiment Baker2011 with a vertical magnetic field of and depolarization times of more than 450 s.
These measurements, together with first-order knowledge of the magnetic-field gradients, were used to determine the energy spectrum of the UCN after storage as well as a precise value for a common offset to the vertical magnetic-field gradients. The technique has the potential to analyze and correct for the so-called geometric-phase effect Pendlebury2004 ; Afach2015ELJD , which is currently the most important systematic effect in experiments searching for an nEDM.
The equilibrium density distribution of UCNs as a function of height above the lower confinement surface in a bottle with diffusely scattering walls is Pendlebury1994 . This leads to a center-of-mass offset of relative to the center plane of a cylindrical precession chamber of radius and height , where
| (1) |
is the time-averaged height of a neutron Harris2014 with .
In the presence of a vertical magnetic-field gradient, neutrons with an energy will precess with an average Larmor frequency of
| (2) |
where is the volume-averaged magnetic field magnitude in the precession chamber for up or down , and Greene1979 is the gyromagnetic ratio of the neutron. This induces an energy-dependent relative phase , where is the free spin-precession (FSP) time. It leads to a relative dephasing which, when averaged over the energy spectrum, can be interpreted as a gravitationally enhanced depolarization. This relative dephasing can be studied by applying a – – spin-echo sequence, varying the time at which the -pulse of duration is applied while keeping constant the total duration between the end of the first and start of the second pulse. This second pulse, at the end of the sequence, is required to transfer information about the spin-precession phase onto the measurable longitudinal spin component. For convenience, we analyze the system in a rotating frame precessing with and inside the storage volume, and we only consider a linear gradient along the primary field axis . Therefore, in the rotating frame, the spins of UCNs with energy precess with average frequency (to first order in )
| (3) |
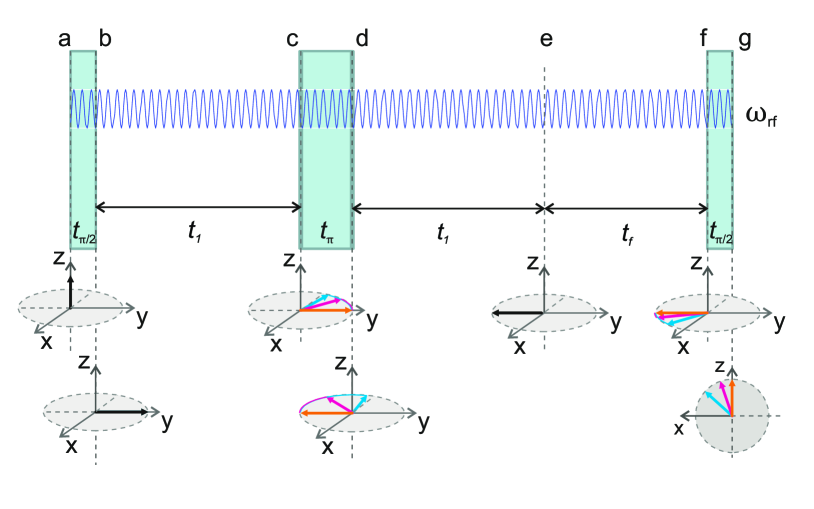
Figure 1 illustrates the evolution of the spins in the rotating frame. The resonance condition under which the spins of all different energies refocus is established when . At this time we measure the highest polarization, which is essentially the polarization without the gravitationally induced dephasing. If we change the start time of the -pulse to values shorter than , the resonance condition will have been met before we apply the second -pulse. As the spins of the different energy classes then proceed to fan out again, the final polarization decreases. Similarly, if the -pulse is applied at times larger than the refocusing is not yet complete by the time the second -pulse is applied.
For a particular UCN energy and fixed the observed polarization after the second -pulse can be written as
| (4) |
By integrating over the UCN energy spectrum at the time of polarization analysis the observed polarization is then
| (5) |
where is normalized to 1 for a fixed .
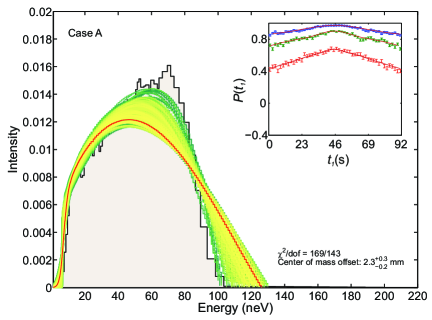
We have used the MCUCN package Bodek2011 with a detailed model of the nEDM experiment at Paul Scherrer Institute (PSI) Baker2011 (, ) and simulated the measurement with a – – spin-flip sequence (tip – flip – tip) for a fully polarized initial population of UCNs. This simulation was carried out for two different UCN energy spectra , parametrized as in equation (7) below, each with three different constant vertical gradients of , , and for a free precession time of . The resulting simulated spin-echo resonances are shown in the inserts of Fig. 2 which can be described by equation (5). In particular we used , with a transverse relaxation rate as derived in Afach2015PRD of
| (6) |
where , and and are the energy-dependent mean velocity, and the effective height of the UCN as introduced in Pendlebury1994 for a cylindrical cell; is a free fit parameter. We found it useful to model the UCN spectrum for a fixed precession time as
| (7) |
where , and , are the points of inflection and slopes of the rising and falling energy edges respectively, while is the high-energy cut-off. is chosen such that . This energy spectrum is based on a very general distribution from the low-energy tail of a Maxwell-Boltzmann distribution, allowing for low- and high-energy cut-offs. A simultaneous nonlinear least-squares fit (algorithm: ‘trust-region-reflective’) to the signals of all three gradients yielded , , , , , and for each of the two spectra. The upper and lower confidence intervals were estimated by carrying out random scans of the parameter space around the best value with ( samples; yellow to dark green curves in Fig. 2):
| (8) |
where is the inverse cumulative function of the statistical -distribution for an confidence level with free parameters and degrees of freedom Rogers1975 . For the numerical integration of equation (5) we used energy bins of equal height: , which is sufficiently small that any systematic error from the finite energy bins would be less than the statistical resolution of each data point. Figure 2 compares spectra extracted from the fit to the input spectra of the simulation. We note that the results become less reliable at higher energies; this is to be expected, since once the neutrons populate the bottle more or less uniformly it becomes increasingly difficult to discriminate between them.
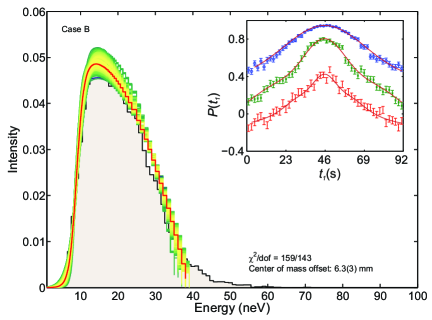
We measured three spin-echo profiles (see Fig. 3) using the apparatus described in Ref. Baker2014 , improved with an array of 16 cesium-vapor magnetometers (CsM) Knowles2009 and a simultaneous spin-analyzing system Afach2015 . The magnetic-field measurement with the CsM array permitted us to calculate the magnetic-field gradients using a polynomial field decomposition up to second order, as described in Ref. Afach2014 . Data were taken for a constant FSP duration of , with three different trim-coil current settings for (down), thereby applying vertical gradients of , , and 38 pT/cm. The uncertainties of the gradient measurements are dominated by systematics due to individual sensor offsets, and amount to 12-14 pT/cm (see Afach2014 ; Afach2014b for a determination of these gradient errors). However, under our conditions, such individual but constant offsets lead to a constant offset of the true that can be determined to within 1-2 pT/cm using the treatment described below.
The measured initial polarization , , was prepared by passing UCNs from the UCN source at the PSI Lauss2013 through a 5 T solenoid magnet. After a filling time of 24 s, the UCN shutter in the ground electrode was closed. For each setting, one fixed radio frequency , and 30.2013 Hz was used. The co-magnetometer measured the mean magnetic field via Green1998 .
A full phase coherent – – spin-flip sequence was applied to the neutrons in the cell before the UCN shutter was then opened again, and the UCN were detected in a pair of spin-state-specific detector channels. A measurement consisted of several cycles with increasing in steps of 9 s. Figure 3 shows the three measured spin-echo resonances. As for the simulated cases, equation (5) was fitted to the data, using the same fitting procedure and in addition randomly varying the initial start values. The frequency from equation (3) was corrected for the difference and was also extended by a term for the second-order gradient in , which was available from the field measurement:
| (9) |
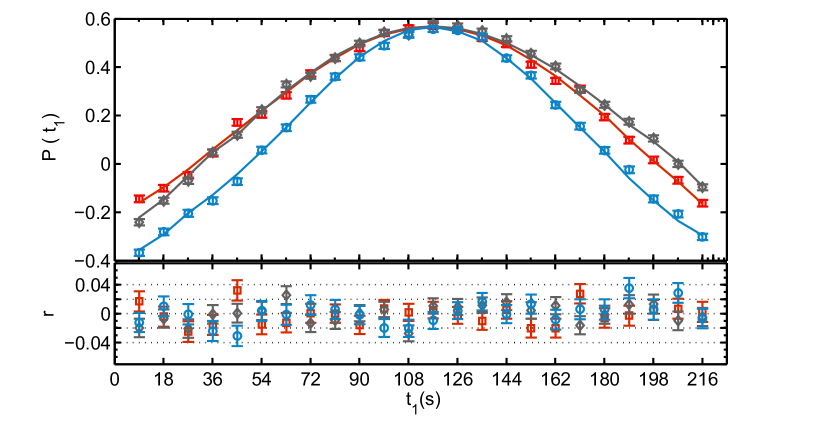
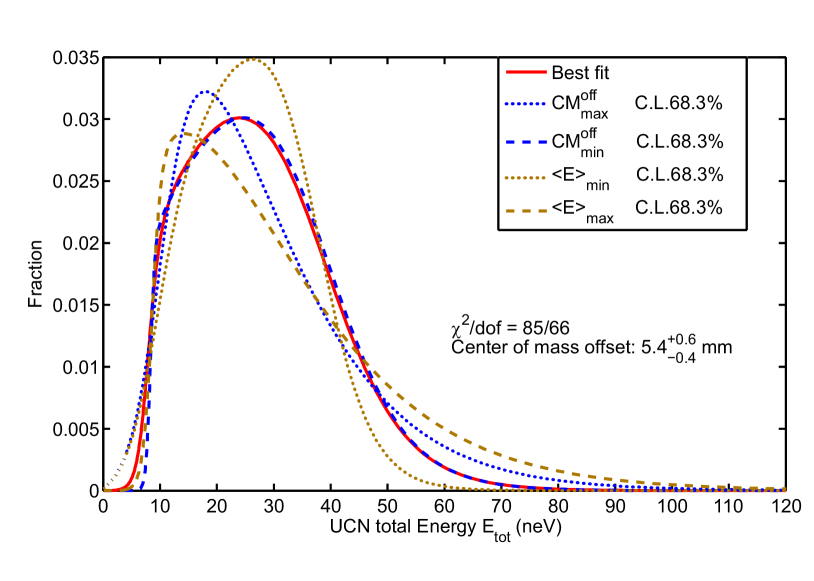
where is the spectrum-independent quadratic expectation value. The fit parameter was included to accommodate the above-mentioned common gradient offset. As the observed polarization at was the same for all three measurements, we used an averaged common for the fit. Figure 4 shows the extracted energy spectrum. The best fit parameters were:, , , , , and , with fixed at . Lower bounds for and were chosen to give smooth physical edges while remained essentially constant for even lower values. The average energy of the measured spectrum is neV, corresponding to a mean velocity at the base of the containment vessel of . The observed intrinsic depolarization time at is , while the calculated dephasing times, correcting for the frequency offset are , , and 279(9) s for the measurements at nominal , 10 , 38 pT/cm respectively. Note that indicates that the intrinsic depolarization is a factor 10 higher than calculated which we attribute to higher order magnetic-field gradients or magnetic impurities of the walls of the precession cell.
The extracted spectrum-averaged UCN to center-of-mass offset is larger using this method than the value 2.35(5) mm Afach2014 deduced from a measurement of the ratio of the precession frequencies of atoms to neutrons, , after 180 s of storage (see Ref. Afach2014 ). This difference is explained by the effect on the measurement of of gravitationally enhanced depolarization, as discussed in Harris2014 ; Afach2015PRD , as well as a softening of the spectrum for longer storage times.
We have demonstrated, using simulations, that the analysis of UCN spin-echo resonance signals in combination with knowledge of the ambient magnetic field provides an excellent method by which to reconstruct the energy spectrum of a confined ensemble of neutrons. The method takes advantage of the relative dephasing of spins arising from a gravitationally induced striation of stored UCN of different energies. Based upon this, measured UCN spin-echo signals have been analyzed. They were taken in a controlled magnetic environment which allowed for long inherent coherence times and permitted a FSP time of 216 s. From these measurements it was possible not only to extract the energy spectrum of stored UCNs, but also to determine a common gradient offset with a resolution of 1.1 pT/cm, and thus to determine the magnetic-field gradient at this level of accuracy. We plan to improve the energy resolution at higher energies ( to 200 neV) by repeating this measurement with a larger bottle of . Using an array of vector magnetometers, as described in e.g. Ref. Afach2015PRL , will further improve this technique. Obtaining the optimal resolution will also require an improved understanding of the intrinsic-depolarization processes , particularly in the limit of very low energies, i.e. , including effects of different specularities of wall reflections and higher order magnetic-field gradients.
This technique will improve the estimation of energy-spectrum dependent systematic effects in high-precision experiments such as searches for the neutron electric dipole moment Baker2011 and for spin-dependent forces Afach2014b . Measurements for different will give access to the evolution of the spectrum during storage, which may help to solve the neutron lifetime controversy Olive2014 . Alternating measurements with and without the -pulse at could also provide a powerful method to improve the magnetic-field homogeneity of typical UCN spin-precession experiments, such as, for example, neutron EDM searches, where it is known that magnetic field gradients can cause false EDM signals when a co-magnetometer is used Pendlebury2004 ; Afach2015ELJD . Using the gradient-offset extraction from a spin-echo measurement in combination with a time-resolved gradient measurement by the CsM array may allow one to correct directly for these false-EDM signals in the future.
Acknowledgments
We would like to thank the PSI staff, in particular F. Burri and M. Meier, for their outstanding support. We also gratefully acknowledge the important work carried out by the workshops throughout the collaborating institutes and the computational power provided by the PL-Grid infrastructure. One of us (EW) benefited from a PhD fellowship of the research foundation Flanders (FWO). This research was financed in part by the Fund for Scientific Research, Flanders; grant GOA/2010/10 of KU Leuven; the Swiss National Science Foundation Projects 200020-144473 (PSI), 200021-126562 (PSI), 200020-149211 (ETH) and 200020-140421 (Fribourg); and grants ST/K001329/1, ST/M003426/1 and ST/L006472/1 from the UK’s Science and Technology Facilities Council (STFC). The original apparatus was funded by grants from the UK’s PPARC (now STFC). The LPC Caen and the LPSC acknowledge the support of the French Agence Nationale de la Recherche (ANR) under reference ANR-09-BLAN-0046. Our Polish partners wish to acknowledge support from the National Science Centre, Poland, under grant no. UMO-2012/04/M/ST2/00556.
References
- (1) E. L. Hahn. Phys. Rev. 80 (1950) 580, doi:10.1103/PhysRev.80.580.
- (2) H. Carr and E. Purcell. Phys. Rev. 94 (1954) 630, doi:10.1103/PhysRev.94.630.
- (3) F. Mezei. Zeitschrift für Physik 255 (1972) 146, doi:10.1007/BF01394523.
- (4) P. Harris, J. Pendlebury and N. Devenish. Phys.Rev. D89 (2014) 016011, doi:10.1103/PhysRevD.89.016011.
- (5) C. A. Baker et al. Phys. Rev. Lett. 97 (2006) 131801, doi:10.1103/PhysRevLett.97.131801.
- (6) G. Ban et al. Phys. Rev. Lett. 99 (2007) 161603, doi:10.1103/PhysRevLett.99.161603.
- (7) A. Serebrov et al. Phys. Lett. B 663 (2008) 181, doi:10.1016/j.physletb.2008.04.014.
- (8) S. K. Lamoreaux and R. Golub. J. Phys. G 36 (2009) 104002, doi:10.1088/0954-3899/36/10/104002.
- (9) I. Altarev et al. Phys. Rev. Lett. 103 (2009) 081602, doi:10.1103/PhysRevLett.103.081602.
- (10) I. Altarev et al. EPL 92 (2010) 51001, doi:10.1209/0295-5075/92/51001.
- (11) A. Serebrov et al. JETP Letters 91 (2010) 6, doi:10.1134/S0021364010010029.
- (12) K. A. Olive et al. Chin. Phys. C 38, 2014, 090001.
- (13) G. Cates, S. Schaefer and W. Happer. Phys. Rev. A 37 (1988) 2877, doi:10.1103/PhysRevA.37.2877.
- (14) D. D. McGregor. Phys. Rev. A 41 (1990) 2631, doi:10.1103/PhysRevA.41.2631.
- (15) J. M. Pendlebury et al. Phys. Rev. A 70 (2004) 032102, doi:10.1103/PhysRevA.70.032102.
- (16) R. Schmid, B. Plaster and B. W. Filippone. Phys. Rev. A 78 023401, doi:10.1103/PhysRevA.78.023401.
- (17) R. Golub, R. Rohm and C. Swank. Phys. Rev. A 83 (2011) 023402, doi:10.1103/PhysRevA.83.023402.
- (18) G. Pignol and S. Roccia. Phys. Rev. A 85 (2012) 042105, doi:10.1103/PhysRevA.85.042105.
- (19) A. Knecht. Towards a new measurement of the neutron electric dipole moment. Ph.D. thesis, Universität Zürich (2009), ucn.web.psi.ch/papers/Thesis_Andreas_Knecht_2009_a.pdf.
- (20) S. Filipp et al. Phys. Rev. Lett. 102 (2009) 030404, doi:10.1103/PhysRevLett.102.030404.
- (21) C.A. Baker et al. Phys. Proc. 17 (2011) 159, doi:10.1016/j.phpro.2011.06.032.
- (22) J.M. Pendlebury and D.J. Richardson. Nucl. Instr. and Meth. in Phys. Res. A 337 (1994) 504, doi:10.1016/0168-9002(94)91120-7.
- (23) K. Bodek et al. Phys. Proc. 17 (2011) 259, doi:10.1016/j.phpro.2011.06.046.
- (24) S. Afach et al. submitted to PRD (2015), (arXiv:1506.06563).
- (25) G. Greene et al. Phys. Rev. D 20 (1979) 2139, dooi:10.1103/PhysRevD.20.2139
- (26) D.W.O. Rogers. Nucl. Instrum. Meth. 127 (1975) 253, doi:10.1016/0029-554X(75)90496-6.
- (27) C.A. Baker et al. Nucl. Instr. and Meth. in Phys. Res. A 736 (2014) 184, doi:10.1016/j.nima.2013.10.005.
- (28) P. Knowles et al. Nucl. Instr. and Meth. in Phys. Res. A 611 (2009) 306, doi:10.1016/j.nima.2009.07.079.
- (29) S. Afach et al. submitted to Eur. Phys. J. A (2015), (arXiv:1502.06876).
- (30) B. Lauss. Phys. Proc. 51 (2014) 98, doi:10.1016/j.phpro.2013.12.022.
- (31) S. Afach et al. Phys. Lett. B 739 (2014) 128, doi:10.1016/j.physletb.2014.10.046.
- (32) S. Afach et al. Phys. Lett. B 745 (2015) 58, doi:10.1016/j.physletb.2015.04.024.
- (33) K. Green et al. Nucl. Instr. and Meth. in Phys. Res. A 404 (1998) 381, doi:10.1016/S0168-9002(97)01121-2.
- (34) S. Afach et al. Opt. Exp. 23(2015) 22108, doi:10.1364/OE.23.022108.
- (35) S. Afach et al. accepted by Eur. Phys. J. D (2015), (arXiv:1503.08651).