Optical injection and spectral filtering of high-power UV laser diodes
Abstract
We demonstrate injection-locking of high-power laser diodes operating at 397nm. We achieve stable operation with injection powers of and a slave laser output power of up to 110mW. We investigate the spectral purity of the slave laser light via photon scattering experiments on a single trapped ion. We show that it is possible to achieve a scattering rate indistinguishable from that of monochromatic light by filtering the laser light with a diffraction grating to remove amplified spontaneous emission.
Many experiments involving atomic ions require high-power ultraviolet c.w. laser light, which is in general technically difficult to produce. The most common method for achieving high powers in the UV is to use cavity-enhanced second harmonic generation to frequency-double visible laser light. Typical visible light sources employed are dye lasers Wineland et al. (1978), sum-frequency mixed fibre lasers (Wilson et al., 2011; Lo et al., 2013), or amplified diode lasers Linke et al. (2013). Violet/UV solid-state diode lasers are an attractive alternative to these technically complex sources, and are presently available in wavelengths close to the resonant transitions of , , and ions. Diode lasers typically possess very low intensity noise, but inferior spectral purity compared with frequency-doubled sources.
Trapped atomic ions have important applications in atomic clocks Diddams et al. (2004), precision spectroscopy Schmidt et al. (2005); Roos et al. (2006), and quantum computing Monroe and Kim (2013). The main challenges for quantum computing are achieving sufficiently high-fidelity logic operations, and scaling up the number of qubits to the large numbers required for useful information processing. For trapped-ion quantum computing, high-power solid-state lasers would assist in addressing both these challenges. The highest-fidelity two-qubit quantum logic gate so far demonstrated was implemented using a Raman laser transition in at , and required of c.w. laser power at the ions Ballance et al. (2014). Due to losses from acousto-optic modulators, optic fibres, and intensity stabilization systems, the power required at the laser source was . According to our error model, the dominant contribution to the gate error was due to photon scattering; this can be reduced if more laser power is available Ozeri et al. (2007). The Raman scattering error-per-gate for fixed gate time scales with , where is the Raman laser power. Since , where is the effective Rabi frequency, and this means that for higher laser power the detuning from resonance of the transition can be increased, while maintaining fixed . Since the Raman scattering rate scales with fewer photons are scattered and the gate error decreases with increasing laser power. If one is interested in making a useful quantum computer it is necessary to significantly scale up the laser systems; due to their smaller physical size and easier fabrication and maintenance, injected diode laser systems appear to be easier to scale up than frequency-doubled systems. Additional requirements on the Raman lasers used for driving gates are a pure frequency spectrum, stable intensity and good phase coherence between the two Raman beams. Injected laser diodes inherently have a very stable intensity and good phase coherence.
In this paper we demonstrate injection-locking of a pair of nominal high-power laser diodes. The spectral purity of the injected lasers is investigated with scattering rate experiments on and improved by inserting a diffraction grating and telescope into the beam path. The intensity stability is measured on a photodiode and compared to that of a frequency-doubled system. The phase coherence is investigated via an optical heterodyne experiment.
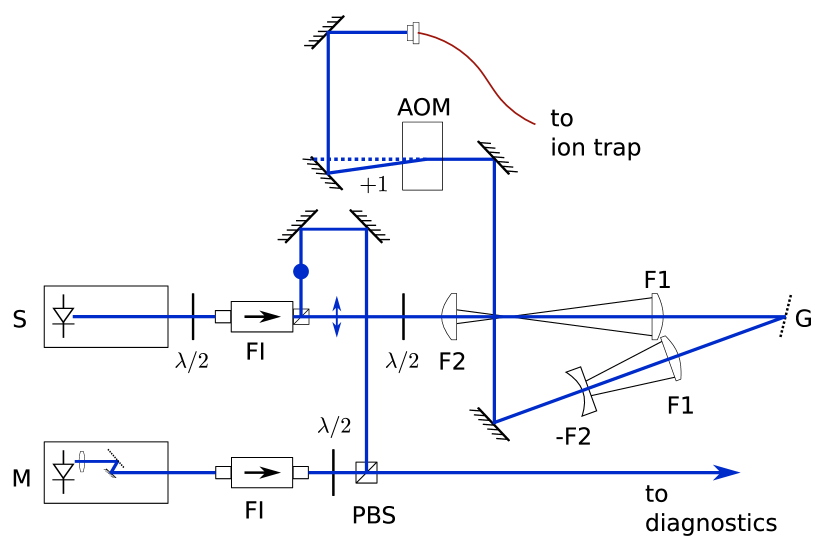
The injection setup is shown in Fig.1. Light from the master laser is injected into the slave diode via a side port of the Faraday isolator. The output of the slave laser is directed onto a grating and the 1st order diffracted beam then goes through an AOM. The first-order diffracted beam of the AOM then goes through a single-mode fibre to the trapped ion. The slave laser diodes are frequency-selected laser diodes from Nichia (NDU4316E) mounted in a Toptica DL100 laser head. The master laser is a grating-stabilised extended cavity diode laser. For setting up the injection, the spatial modes are matched via their back-reflections with the slave diode current slightly below threshold. Injection at higher currents is achieved by adjusting the slave temperature, the slave current and the injection beam power for a given master laser frequency. Successful injection was demonstrated over a wide range of frequencies ( or ).
The slave temperature was usually kept at , but for large detunings , where the mode matching between the master laser and the slave diode is worse, other temperatures can be favourable. For stable injection was achieved for temperatures . When increasing the slave current, modes of stable injection appear and disappear. The modes are wide and spaced by . The position of the modes depends on and and is subject to current hysteresis. The width of the modes decreases with increasing slave current. The slave current is limited by the damage threshold of the slave diode and the highest mode in these experiments was typically at , giving . The injection beam power has a large effect on the quality of injection. Typical injection powers are between and . The necessary injection power strongly depends on the master frequency in a non-monotonic fashion. The fibre-coupling efficiency without the use of anamorphic prisms was typically .
Injection would typically stay stable over the course of a day. However the master laser needed occasional current adjustments to suppress parasitic frequency modes. For large detunings the regions of stable injection of the slave laser would become smaller due to the worse mode matching. Due to the large current hysteresis of these modes the injection was therefore often lost within several minutes for higher current modes. However in the wide region of frequencies that we were generally operating in, this did not occur.
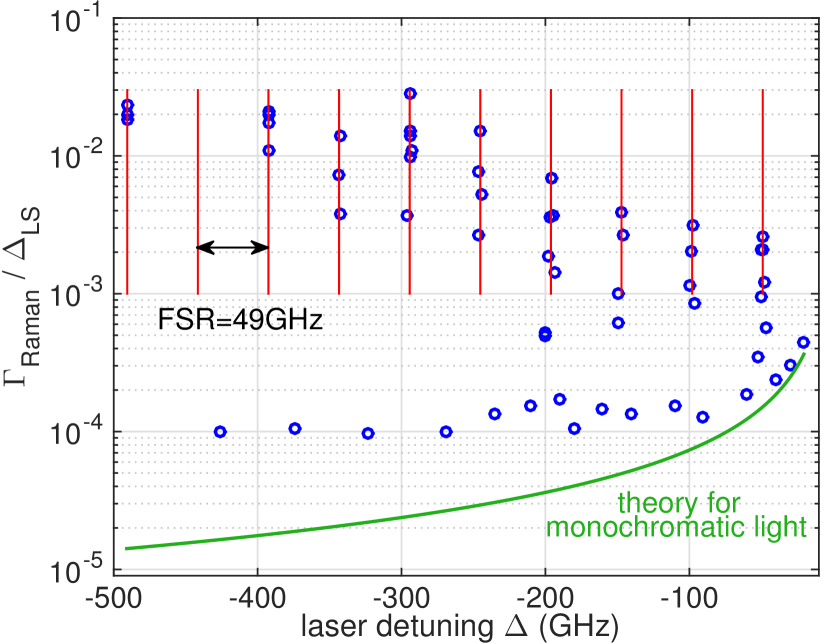
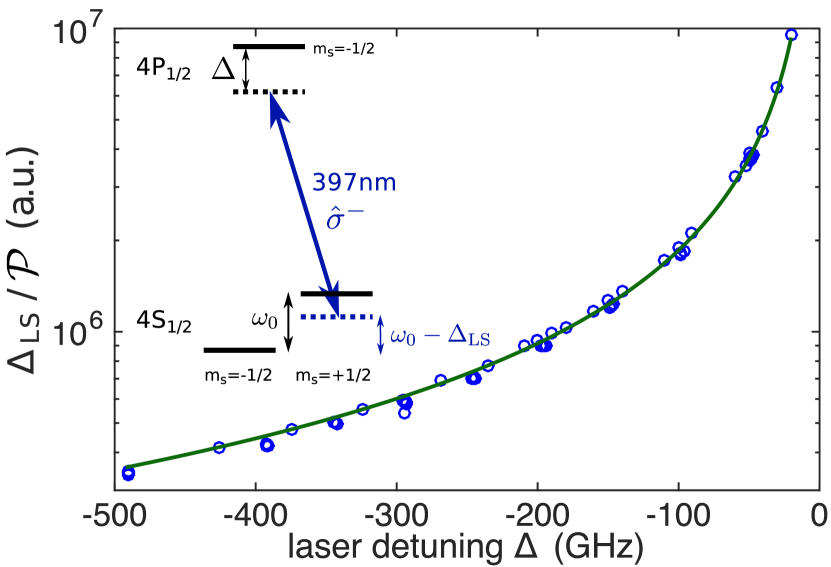
The spectral purity of the injected laser is investigated by measuring the Raman scattering rate. For this the ion was prepared in by optical pumping with a -polarized 397nm laser. Subsequently the -polarized far-detuned (by ) 397nm injected laser was applied for a time . During this time the ion can be off-resonantly excited to the or levels, and can either relax back into by elastic (Rayleigh) scattering, or to or the manifold by inelastic (Raman) scattering. Next, population in is transferred state-selectively to the long lived levels McDonnell et al. (2004). Fluorescence detection is used to determine whether the ion is still in the state, allowing us to infer the population originally in . By fitting the exponential decrease in population in as a function of pulse length , the scattering rate can be deduced. For large detunings , the Raman scattering rate Ozeri et al. (2005) can be described as , with the natural linewidth of the excited state levels ( and ), polarization vector , the coupling strength to the lasers and the fine structure splitting between the and manifolds. For the scattering rate increases strongly and is therefore a good measure for near-resonant parasitic frequencies in primarily monochromatic light. Variations in intensity are normalized by taking the ratio with the differential light shift Wineland et al. (2003) . Even though the light shift also has a frequency dependence , the spectral impurities are too small to cause deviations from the light shift caused by monochromatic light, see Fig. 2. The light shift is therefore suitable to be used for intensity normalization. We measured by Ramsey spectroscopy of the splitting in a spin-echo sequence Hahn (1950), with the far-detuned -polarized beam applied in the second half for varying durations . The pulse sequence is , where are spin-rotations by an angle and are carried out by RF-radiation. State preparation and readout methods are the same as in the scattering rate measurements. Fig. 3 shows the measured scattering rate with scanned detuning from resonance. There are strong peaks in the scattering rate visible, spaced apart from each other. This spacing corresponds to the free spectral range of the internal cavity of the slave laser. The peaks are caused by amplified spontaneous emission (ASE) of the intrinsic modes of the slave cavity that are amplified by the gain medium but stay below lasing threshold Donald (2000). The wings of these peaks cause the scattering rate to be larger than that of monochromatic light for all frequencies, and to stay approximately constant for large detunings rather than to decay strongly. This would therefore increase the scattering errors and is unsuitable for high fidelity gate operations.
(a)
(b)
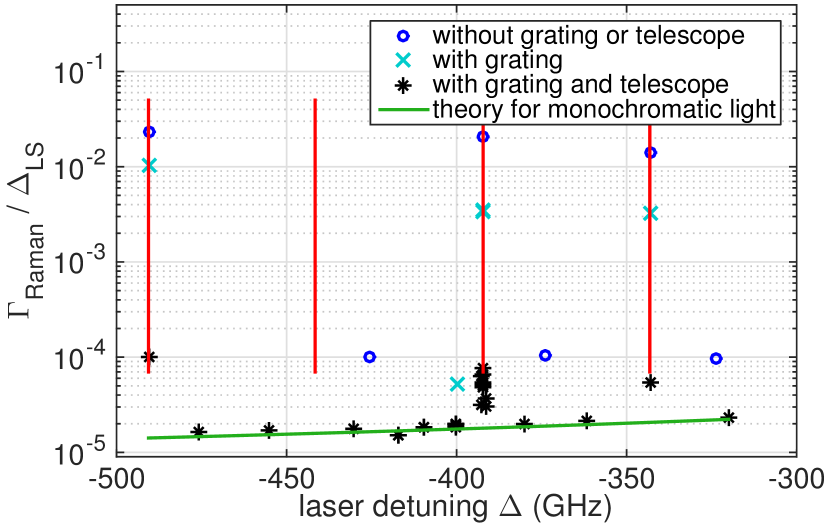
To improve the spectral purity, a blazed grating (Thorlabs GR25-1205) was inserted into the slave beam. This changes the beam direction of parasitic frequencies compared to the desired frequency, and therefore also their beam position at the distant AOM and fibre. Thus the diffraction efficiency and coupling efficiency of parasitic frequencies decreases. The displacement for frequencies detuned by from the carrier differs by from the displacement of the carrier light at a distance of from the grating. The FWHM of the diffraction maximum for our beam with at 1m distance is . To further increase the resolving power of the grating a telescope was inserted into the beam. This increases the spot size on the grating by a factor of 2.5, reducing the FWHM to . Fig. 4 shows the improved scattering data. With both grating and telescope inserted parasitic modes are suppressed by and the scattering baseline corresponds to the scattering rate of monochromatic light. The grating and telescope reduce the power available at the fibre output by .
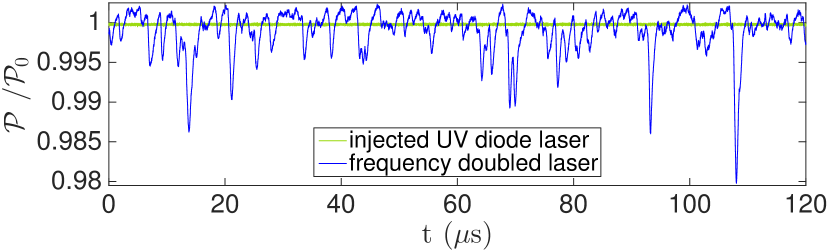
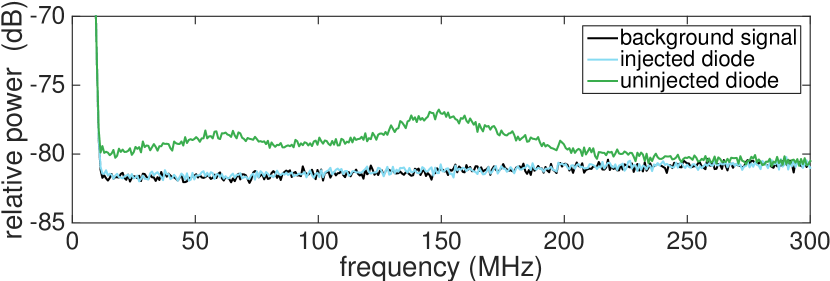
The spectral purity of frequency-doubled systems is inherently very good, since the doubling cavity acts as a frequency filter. Mechanical vibrations of the cavity can however lead to intensity fluctuations. Injected diode lasers on the other hand have an inherently very stable intensity. Fig. 5 (a) shows the intensity stability of the injected slave laser measured with a bandwidth photodiode (Hamamatsu S5973) on an oscilloscope compared to a frequency doubled system. The noise of the injected slave laser light is indistinguishable from the photodiode noise floor, equivalent to an optical power of and therefore , which corresponds to an improvement of at least two orders of magnitude compared to the frequency-doubled system. Analysis of the photodiode signal with a spectrum analyser shows a clear drop in intensity noise of the injected beam compared to a poorly injected or uninjected beam, see Fig. 5(b).
(a)
(b)
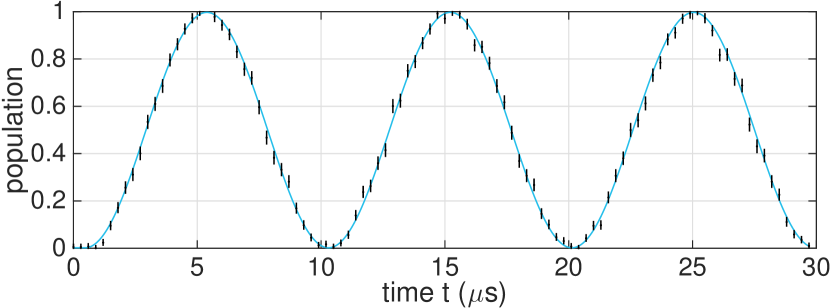
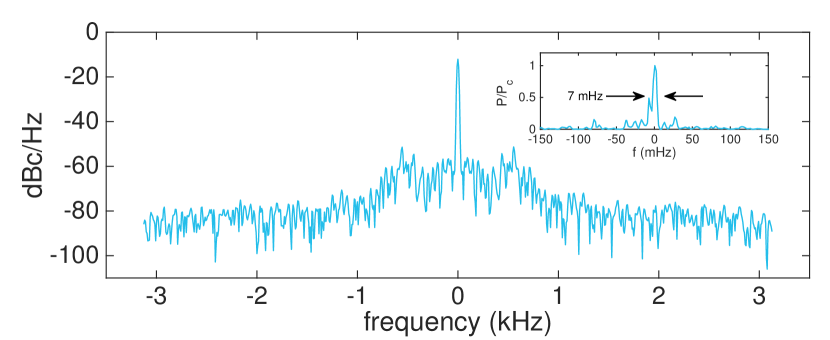
For driving Raman transitions two phase-coherent lasers are necessary, with the transition frequency as their frequency difference. Therefore a second slave laser was added to the setup, which was also injected by the master laser. The phase coherence of the two injected lasers was measured with a heterodyne beat-note experiment with a 10kHz frequency splitting of the two lasers induced by the AOMs in the beampath. The laser beams were combined on a non-polarizing beam-splitter and focussed onto an amplified photodiode about 2m distant from the laser output, after the telescope and the AOM. Both beams had approximately equal power and the same polarization. The signal from the photodiode was analysed on a Fourier-transform spectrum analyser and the result can be seen in Fig. 6 (a). The two injected lasers were also used to drive Rabi oscillations on the - transition, see Fig. 6 (b). The necessary frequency difference of was set by the two AOMs.
In this paper we presented a pair of injected high-power UV diode lasers with intensity stability and spectral purity indistinguishable from that of a monochromatic source over most of the gain profile. The lasers stay stably injected over a day and require injection powers as low as .
Recently injection of a high-power UV 399nm diode laser has also been reported Hosoya et al. (2014).
Funding Information
This work was supported by the UK Engineering and Physical Sciences Research Council (EPSRC).
Acknowledgements
We thank Derek Stacey for helpful discussions and useful comments on the manuscript.
References
- Wineland et al. (1978) D. J. Wineland, R. E. Drullinger, and F. L. Walls, Phys. Rev. Lett. 40 (1978).
- Wilson et al. (2011) A. Wilson, C. Ospelklaus, A. VanDevender, J. Mlynek, D. Leibfried, and D. Wineland, Appl. Phys. B 105, 741 (2011).
- Lo et al. (2013) H.-Y. Lo, J. Alonso, D. Kienzler, B. Keitch, L. de Clercq, V. Negnevitsky, and J. Home, Appl. Phys. B 114, 17 (2013).
- Linke et al. (2013) N. Linke, C. Ballance, and D. Lucas, Optics Letters 38, 5087 (2013).
- Diddams et al. (2004) S. Diddams, J. Bergquist, S. Jefferts, and C. Oates, Science 306, 1318 (2004).
- Schmidt et al. (2005) P. Schmidt, T. Rosenband, C. Langer, W. Itano, J. Bergquist, and D. Wineland, Science 309 (2005).
- Roos et al. (2006) C. Roos, M. Chwalla, K. Kim, M. Riebe, and R. Blatt, Nature 443 (2006).
- Monroe and Kim (2013) C. Monroe and J. Kim, Science 8, 1164 (2013).
- Ballance et al. (2014) C. Ballance, T. Harty, N. Linke, and D. Lucas, arXiv 1406.5473 (2014).
- Ozeri et al. (2007) R. Ozeri, W. Itano, R. Blakestad, J. Britton, J. Chiaverini, J. Jost, C. Langer, D. Leibfried, R. Reichle, S. Seidelin, J. Wesenberg, and D. Wineland, Phys. Rev. A 75 (2007).
- McDonnell et al. (2004) M. J. McDonnell, J. Stacey, S. Webster, J. Home, A. Ramos, D. Lucas, D.N.Stacey, and A. Steane, Phys. Rev. Lett. 93, 153601 (2004).
- Ozeri et al. (2005) R. Ozeri, C. Langer, J. Jost, B. DeMarco, A. Ben-Kish, B. Blakestad, J. Britton, J. Chiaverini, W. Itano, D. Hume, D. Leibfried, T. Rosenband, P. Schmidt, and D. Wineland, Phys. Rev. Lett. 95 (2005).
- Wineland et al. (2003) D. J. Wineland, M. Barrett, J. Britton, J. Chiaverini, B. DeMarco, W. M. Itano, B. Jelenković, C. Langer, D. Leibfried, V. Meyer, T. Rosenband, and T. Schätz, Philosophical transactions. Series A, Mathematical, physical, and engineering sciences 361, 1349 (2003).
- Hahn (1950) E. L. Hahn, Phys. Rev. 80, 580 (1950).
- Donald (2000) C. Donald, Development of an Ion Trap Quantum Information Processor, D.Phil. thesis, University of Oxford (2000).
- Hosoya et al. (2014) T. Hosoya, M. Miranda, R. Inoue, and M. Kozuma, arXiv 1412.0794v1 (2014).